The compact radio structure of radio-loud narrow line Seyfert 1 galaxies
Abstract
We present the compact radio structure of three radio-loud narrow line Seyfert 1 galaxies from VLBA archive data at 2.3, 5 and 8.4 GHz. In RXS J16290+4007, the radio structure is mostly unresolved. The combination of compact radio structure, high brightness temperature and inverted spectrum between simultaneous 2.3 and 8.4 GHz, strongly favors jet relativistic beaming. Combining with the VLBI data at 1.6 and 8.4 GHz from literatures, we argued that RXS J16333+4718 may also harbor a relativistic jet, with resolved core-jet structure in 5 GHz. B3 1702+457 is clearly resolved with well defined jet component. The overall radio steep spectrum indicates that B3 1702+457 is likely a source optically defined as NLS1 with radio definition of compact steep spectrum sources. From these three sources, we found that radio loud NLS1s can be either intrinsically radio loud (e.g. B3 1702+457), or apparently radio loud due to jet beaming effect (e.g. RXS J16290+4007 and RXS J16333+4718).
1 Introduction
While both permitted and forbidden optical emission lines are present in narrow line Seyfert 1 galaxies (NLS1), their broad Balmer lines are narrower than that of normal broad line Seyfert 1 galaxies with the FWHM of the line less than 2000 (Osterbrock & Pogge 1985; Goodrich 1989). Moreover, NLS1 galaxies also exhibit other extreme observational properties, such as the relatively weak forbidden-line emission, i.e., (Goodrich 1989), strong permitted optical/UV Fe II emission lines (Boroson & Green 1992; Grupe et al. 1999; Véron-Cetty et al. 2001), steep soft X-ray spectra (Wang et al. 1996; Boller et al. 1996; Grupe et al. 1998), and rapid X-ray variability (Leighly 1999; Komossa & Meerschweinchen 2000). NLS1 galaxies are thought to be young AGNs with relatively small black hole masses and high accretion rate (indicated by Eddington ratios: the bolometric-to-Eddington luminosity ratio ) (e.g., Boroson 2002; Collin & Kawaguchi 2004).
Conventionally, NLS1 galaxies were thought to be radio quiet. With the discovery of radio loud NLS1s, it is realized that NLS1s simply have low probability to be radio loud, instead of completely radio quiet (e.g. Komossa et al., 2006). Compared to about 10%-15% for normal broad line AGNs and quasars (e.g., Ivezić et al. 2002), only 7% of all NLS1 galaxies are radio loud (Komossa et al. 2006; Zhou et al. 2006), while only of the NLS1s are ‘very’ radio loud (radio loudness ). As shown in Komossa et al. (2006), the radio-loud NLS1 galaxies are generally compact, steep spectrum sources in the radio regime, therefore, they are likely associated with compact steep-spectrum (CSS) radio sources. In contrast, observational evidences have shown that several of the radio- loudest NLS1 galaxies display blazar characteristics and harbor relativistic jets (Doi et al., 2007; Zhou et al., 2007; Yuan et al., 2008). Yuan et al. (2008) presented a comprehensive study of a sample of 23 genuine radio-loud NLS1 AGNs with radio loudness larger than 100. The radio sources of the sample are ubiquitously compact, unresolved on scales of several arcseconds. Some of these objects show interesting radio to X-ray properties that are unusual to most of the previously known radio-loud NLS1 AGNs, but are reminiscent of blazars, including flat radio spectra, large-amplitude flux and spectral variability, compact VLBI cores, very high variability brightness temperatures, enhanced optical continuum emission, flat X-ray spectra, and blazar-like spectral energy distributions (SEDs) (also see Foschini et al., 2009a). Despite that the number of radio loud NLS1s is rapidly growing (Zhou et al., 2006), mechanisms driving the NLS1 radio properties is still not clear, such as, accretion rate, black hole spin, host galaxy properties and merger history.
Although a relativistic jet has been proposed to exist in radio-loud NLS1s (e.g. Komossa et al., 2006; Yuan et al., 2008; Foschini et al., 2009a), only until recently its existence can be strongly proved through the ray emission successfully detected in several radio-loud NLS1s (Abdo et al., 2009a, b, c; Foschini et al., 2009b). Especially from these observations, radio-loud NLS1s were claimed to be a third class of ray AGNs, besides blazars and radio galaxies (e.g. Abdo et al., 2009c). To explore the jet properties in radio-loud NLS1s, the global e-VLBI observations have been made for the first ray detected radio-loud NLS1 PMN J0948+0022 (Abdo et al., 2009b), and more observations are proposed111http://www.evlbi.org/gallery/images.html.. However in general, still not much is known for the VLBI compact radio structure of radio-loud NLS1s, from which the jet properties can be directly explored, such as jet orientation, and jet beaming effect. Recently, Doi et al. (2006, 2007) performed high-resolution VLBI observations for several radio-loud NLS1 AGNs and found that they are unresolved with milliarcsecond resolutions, setting direct lower limits on the brightness temperatures in the range of K. They also found that inverted radio spectra are common in the radio-loudest objects. The authors suggested that Doppler beaming, presumably resulting from highly relativistic jets, can explain the observations naturally. Most recently, Doi et al. (2009) found significant pc-scale structures with high brightness temperatures for five radio-loud NLS1s from the VLBA high-resolution observations, indicating nonthermal jets in these sources. Moreover, the authors claimed that the central engines of some radio loud NLS1s can generate mildly- or highly-relativistic jets, which make them apparently radio-loud. However, the nuclei of some NLS1s have the ability to generate jets significantly strong enough to make them intrinsically radio-loud.
In this paper, we present the high resolution radio structure of three radio-loud NLS1s from the unpublished VLBA archive data. The observations and data reduction is shown in Section 2, and the results is given in Section 3. The last section is dedicated to discussions. Throughout the paper, we assume a cosmology with , , and (Spergel et al., 2003). The spectral indices is defined as , in which is the flux density at frequency .
2 Observations and Data reduction
We searched VLBA archive for the unpublished data of the sources claimed as NLS1s in various literatures. The data of three sources were finally archived, which covers three radio bands 2.3, 5 and 8.4 GHz. All these three sources have been imaged in 8.4 GHz with Japanese VLBI Network (JVN) (Doi et al., 2007), and 1.6 GHz VLBA observations have been recently shown in Doi et al. (2009). The source list is shown in Table 1, in which the JVN 8.4 GHz flux density, FIRST 1.4 GHz, GB6 5 GHz flux density and the conventional radio loudness are given.
All the observations were made in phase referencing mode. The targets, their corresponding phase referencing calibrator and the angular distances between target and phase referencing calibrator are listed in Table 2, most of which lies within a range of around the targets except for the observations of B3 1702+457 at two epochs with angular distance of . The average on-source observational time is about 70 minutes. Data reductions are made in AIPS. Atmosphere and parallactic angle effects on data are calibrated before fringe fitting of phase referencing calibrator are made, and its solutions are applied to the corresponding target. Bandpass corrections and self-calibrations are made before data are averaged in 30 seconds so that we can obtain the results of as high as possible signal to noise ratio. The imaging and model fitting process is performed in DIFMAP with all the base contour levels given below in the final residual images. The model fitting results are given in Table 3.
3 Results and discussion
3.1 Brightness temperature
From the high-resolution VLBA images, the brightness temperature of radio core in the rest frame can be estimated with (Ghisellini et al., 1993)
| (1) |
in which is source redshift, is core flux density at frequency , and is source angular diameter with a and b being major and minor axis, respectively. The intrinsic brightness temperature can be related with by
| (2) |
in which is Doppler factor.
The brightness temperature can also be measured from variability, which is correspondingly called variability brightness temperature and can be estimated as (Yuan et al., 2008)
| (3) |
where is the Boltzmann constant, the luminosity distance, the variable portion of the observed flux density, the corresponding radio power at the emission frequency in the source rest frame, the observing frequency, and the time span in the observer’s frame. The intrinsic brightness temperature can be related with by
| (4) |
where is Doppler factor.
Normally, the upper limit of physically realistic brightness temperature of nonthermal radio emission can be taken as the equipartition brightness temperature K (Readhead, 1994), or the inverse Compton catastrophic brightness temperature K (Kellermann & Pauliny-Toth 1969, but see Singal 2009 for other interpretations). Consequently, the Doppler factor can be constrained either by equation (2) or equation (4). However, it should be noted that the Doppler factor constrained in these ways is generally smaller than that from gamma rays (Abdo et al., 2009c). This is due to the fact that gamma rays are produced in very compact regions, whose compactness is required for gamma rays to escape, but this in turn means that these compact blobs are also optically thick to radio frequencies (synchrotron self-absorption). As the blob is sufficiently expanded to be optically thin for radio emission, it is likely that it has decelerated (e.g. Blandford & Königl, 1979).
3.2 Individual objects
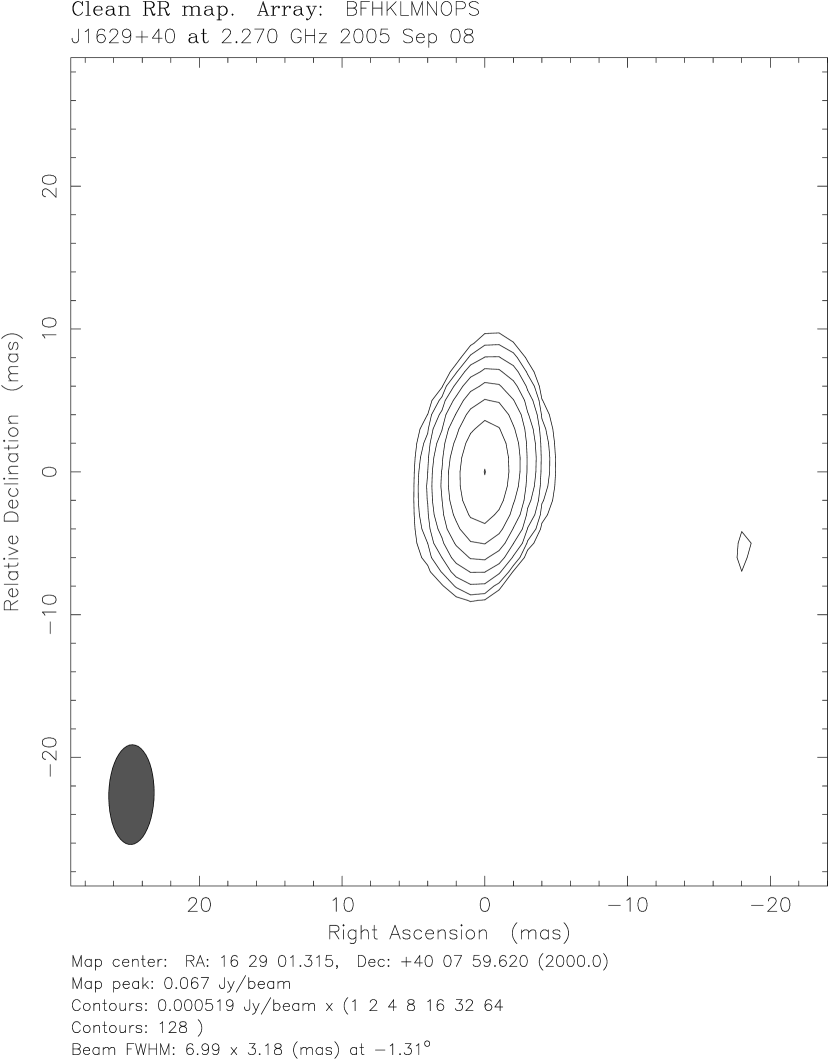
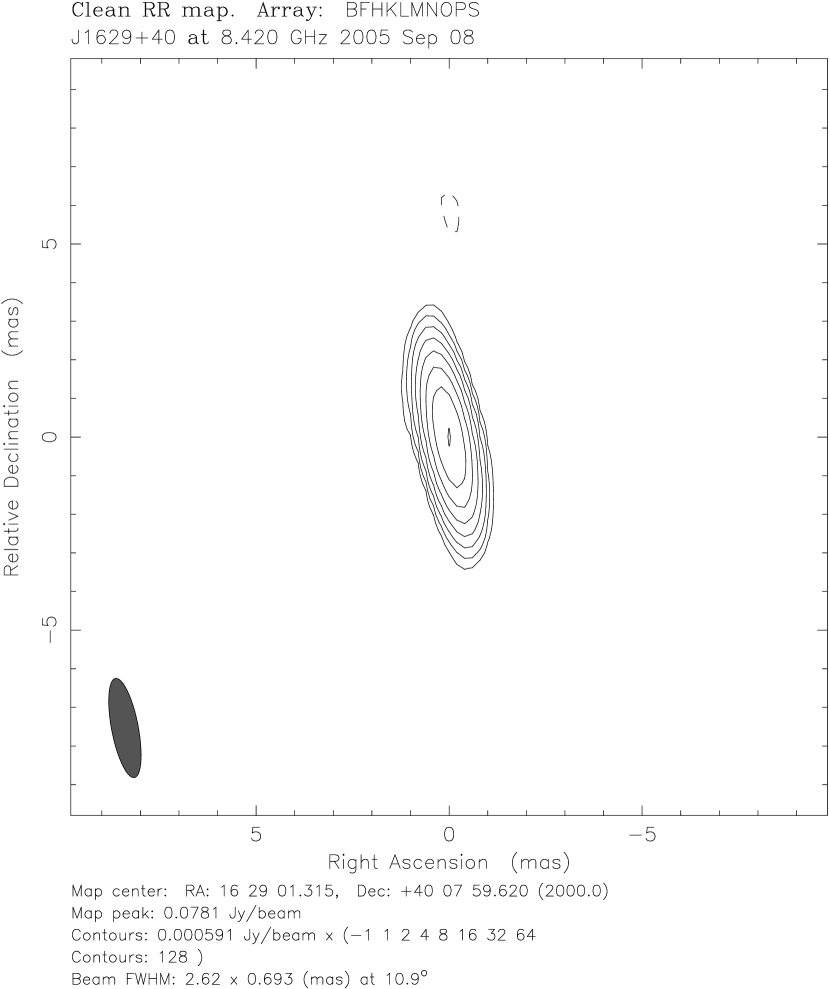
— We show the radio structure of this source in Fig. 1, in which the source is compact and unresolved in all images, except that it is slightly resolved with an eastern component at 5 GHz on December 2005. The simultaneous observations at 2.3 and 8.4 GHz show an inverted spectrum , which is consistent with the inverted spectrum between FIRST 1.4 and GB6 5 GHz (see Table 1, see also Zhou & Wang, 2002). The brightness temperature at all wavebands are high , especially it reaches at 8.4 GHz. The inverted spectrum, compact structure and high brightness temperature all together suggest a Doppler beaming effect in this source. This is further supported by the flux variations. Although the variation is not evident during two epoch 5 GHz observations (see Table 3), large variations are found when comparing with the previous data at 5 GHz (22 mJy, Véron-Cetty & Véron, 2001) and 8.4 GHz (JVN 26.3 mJy, Doi et al., 2007). At 8.4 GHz, the variability brightness temperature is quite high K (see Table 3). The high values are commonly explained as emission originating from relativistic jets (Blandford & Königl, 1979). Conservatively taking the inverse Compton limit , the minimum Doppler factor can be estimated as or . This results in , which can be larger if the equipartition brightness temperature K is used as limit (Readhead, 1994). To conclude, this source can be a blazar-like NLS1s with jet pointing towards us with small viewing angle (see also Doi et al., 2007; Yuan et al., 2008; Doi et al., 2009), which is consistent with the results presented in Padovani et al. (2002).
Tentatively putting our data at 2.3, 5 and 8.4 GHz together, we find
the radio spectrum are resemble to that of High Frequency Peakers
(HFPs), i.e. compact objects with a simple convex radio spectrum
turning over at frequencies well above a few GHz, which likely
represent the earliest stage in individual radio source evolution
(e.g. Dallacasa et al., 2000; Orienti, 2009). While this should be checked with
further simultaneous multiwaveband observations, as a matter of
fact, its spectral shape above 5 GHz is inverted, as measured by
simultaneous multiwavelength observations with Effelsberg 100-m
telescope by Neumann et al. (1994). Alternatively, it is likely that the
beaming effect boosted the radio emission as well as the peak
frequency of the synchrotron self-absorption spectra
(e.g. Doi et al., 2007). As pointed out by Orienti (2009), HFPs are
selected on the basis of both the convex shape of their spectra and
the high frequency at which the spectral peak occurs. In this way,
it is possible that boosted objects matching the selection criteria
contaminate the HFPs sample. Indeed, from the analysis of the radio
properties, Orienti (2009) found that HFPs galaxies are not variable,
are unpolarized and exhibit a Double/Triple structure, typical of
young radio sources. On the other hand, the majority of HFPs quasars
are strongly variable, polarized and with Core-Jet structure, as
expected in beamed objects. Therefore, RXS J16290+4007 is likely a
boosted object rather than a genuine HFPs young radio sources.
— This source is unresolved at JVN 8.4 GHz
milliarcsecond resolution (Doi et al. 2007), and at 1.6 VLBA GHz
(Doi et al., 2009). Its spectral shape above 5 GHz is inverted, as
measured by simultaneous multiwavelength observations by Neumann et
al. (1994). We present 5 GHz radio structure in Fig. 2, at
which it is slightly resolved into core-jet structure. Combining JVN
8.4 GHz (Doi et al., 2007) and VLBA 1.6 GHz data (Doi et al., 2009) with our 5
GHz data, we find that the core spectral index is flat between 1.6
and 5 GHz , which is consistent with that of
Zhou & Wang (2002) (see Table 1). The high brightness temperature
at 5 GHz K in combination with the flat
spectrum indicate that an at least mild relativistic jets is likely
responsible for the radio emission and structure. However, the
spectra is steep between 1.6 and 8.4 GHz
(Doi et al., 2009), and between 5 and 8.4 GHz . The steep
spectrum and compact radio structure make this source resemble to
CSS source. This however is not conclusive, since the observations
were not performed simultaneously. Indeed, the variation can be
clearly seen when comparing GB6 with VLBA 5 GHz data. Therefore,
further simultaneous multi-epoch VLBI observations are needed to
investigate the spectral index of this source, then to explore the
source nature.
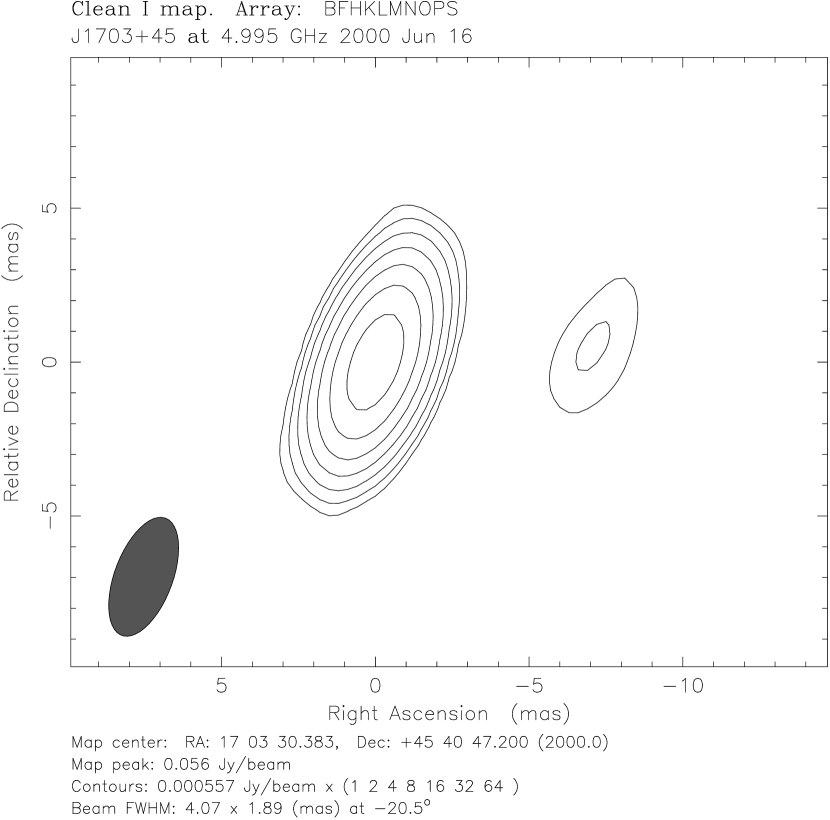
— This source was classified as Compact Steep
Spectrum (CSS) sources with turnover frequency
MHz in the sample of Compact Radio sources at Low Redshift (CORALZ)
(Snellen et al., 2004). The VLBA 5 GHz radio structure is shown in Fig.
3, in which the source is resolved into core-jet structure
with weak radio jet components clearly seen in two images. The
spectral index between FIRST 1.4 GHz and GB6 5 GHz show a steep
spectrum with (see Table 1).
Consistently, the VLBA 1.6 GHz (Doi et al., 2009) and JVN 8.4 GHz
(Doi et al., 2007) show a steep index , which is also
present between VLBA 5 GHz and JVN 8.4 GHz (see Tables
1 and 3). In contrast, the spectral index of the
prominent radio component become flat with VLBA 1.6
and 5 GHz data, from which the radio core can be identified.
However, VLBA 1.6 GHz and 5 GHz were not obtained simultaneously,
therefore, the steep spectrum of 1.6 GHz and 5 GHz can not be
completely excluded due to the variability. Indeed, the flux
variation is apparent at 5 GHz. The GB6 flux density is 24.7 mJy
(see Table 1), whereas the flux density of VLBA core is
56.8 mJy on June 2000 (see Table 3). It thus is possible
that the VLBA 5 GHz data were taken when the source was at high
state, while 1.6 GHz data was at relatively low state, which results
in a flat spectrum between VLBA 1.6 GHz and 5 GHz. The brightness
temperature of this source does not show a severe beaming effect,
which is not inconsistent with the steep spectrum nature of this
source. In order to investigate the genuine spectral index, it is no
doubt that the simultaneous observations are required to explore the
nature of the radio structure. In addition, the flux monitoring also
enable us to explore the nature of this source since genuine CSS
sources usually do not show voilent variations (O’Dea, 1998).
4 Discussion
While the high brightness temperature and compact radio structure indicate the jet origin of radio emission, the spectral index are not homogenous in three sources. The inverted spectrum of RXS J16290+4007 from simultaneous 2.3 and 8.4 GHz observations has shown that beaming effect plays important role in making high radio loudness, which is supported by the inverted spectrum above 5 GHz measured by simultaneous multiwavelength observations (Neumann et al., 1994). Similarly, the beaming effect may likely also present in RXS J16333+4718, as shown by the inverted spectrum above 5 GHz (Neumann et al., 1994). This is supported by the flat spectrum between 1.6 and 5 GHz, despite that further simultaneous multi-band observations are needed for confirmation. These two sources are thus likely intrinsically radio quiet or intermediate (depends on the strength of beaming effect), however, are apparently radio loud due to the beaming effect in radio emission (see also Doi et al., 2009). In contrast, the overall spectrum of B3 1702+457 are steep, in combination with the compact structure, making this source resemble to CSS sources. This source can be intrinsically radio loud since the beaming effect may not be important. Indeed, the radio loudness of this source is only , relatively small compared to RXS J16290+4007 () and RXS J16333+4718 (, see Table 1). To summarize, radio loud NLS1s can be either intrinsically radio loud, or apparently radio loud due to jet beaming effect (see also Doi et al., 2009).
Both having strong emission lines and Doppler boosted jet emission, the most radio loud NLS1s and flat spectrum radio quasars are presumably related together. Indeed, several radio-loudest NLS1 galaxies have been found to display blazar characteristics and harbor relativistic jets (Doi et al., 2007; Zhou et al., 2007; Yuan et al., 2008), which have been strongly proved by the detected rays (Abdo et al., 2009a, b, c; Foschini et al., 2009b). As claimed by Yuan et al. (2008), in a sample of 23 radio-loud NLS1 AGNs with radio loudness larger than 100, some objects show radio to X-ray properties that are reminiscent of blazars, some of which even resemble high-energy-peaked flat spectrum radio quasars (HFSRQs) in their SEDs with synchrotron peak frequency likely at around UV/X-ray regimes. RXS J16290+4007, the Doppler boosted object as shown in Section 3.2, was suggested by Padovani et al. (2002) to be the first HFSRQ for its modeled synchrotron peak at Hz. A steep soft X-ray spectrum with photon index implies a synchrotron origin for X-ray emission (Padovani et al., 2002; Grandi et al., 2006). While HFSRQs represent the outlier of blazar sequence (Fossati et al., 1998; Ghisellini et al., 1998), they have not definitely been found yet (Landt et al., 2008; Maraschi et al., 2008). Nevertheless, the existence of HFSRQs is explained in Ghisellini & Tavecchio (2008), in which the jet dissipation region is out of the broad-line region, resulting in a much reduced energy density of BLR photons in the jet region. Therefore, the cooling due to the inverse Compton process is not severe, causing a high synchrotron peak frequency although the source luminosity can be high. Taking the disk-corona emission into account and assuming the jet dissipation out of BLR, the jet parameters of RXS J16290+4007 has been estimated by Maraschi et al. (2008) through SED modeling, of which the X-ray emission are dominated by the synchrotron emission from jet. Although it is regarded as HFSRQs, the authors found that RXS J16290+4007 well follows the general blazar spectral sequence established by blazars in Celotti & Ghisellini (2008) in terms of parameter diagram of , the energy of electrons radiating the peak synchrotron luminosity, and the radiation energy density (magnetic field plus synchrotron photons) or the total jet power (see their Figs. 9 and 11 in Maraschi et al., 2008).
In another blazar-like NLS1, RXS J1633+4718, a flat X-ray spectrum with found by Yuan et al. (2008), is not inconsistent with the typical X-ray spectra of FSRQs, which are flat and extend from the soft to the hard X-ray band ( with a dispersion ; see, e.g., Reeves & Turner 2000). Such flat X-ray spectra is usually interpreted as inverse Compton radiation from the relativistic jets and beaming. On the other hand, the prominent soft X-ray excess is also found in RXS J1633+4718, which is typical of normal NLS1 galaxies (Yuan et al., 2008). Intriguingly, however, RXS J1633+4718 shows a broadband SED similar to that of HFSRQs (Yuan et al., 2008). For B3 1702+457, the CSS-like source, the spectral index at 2-10 keV is , and the soft X-ray excess is evident, which is typical of normal NLS1 galaxies (Vaughan et al., 1999). It might be true that the X-ray emission of radio loud NLS1s can be a mixture of the emission from disk-corona and nonthermal jets. The fraction of each components may alter with the significance of beaming effect, in the way that the disk-corona emission may dominate over nonthermal one for sources with little (if any) beaming effect (e.g. B3 1702+457; PKS 2004-447 in Gallo et al. (2006) and Foschini et al. (2009a), but see Abdo et al. (2009c) for alternatives), however, nonthermal one may dominate in case of significant beaming effect (e.g. RXS J16290+4007, see Maraschi et al., 2008). The similar competition was found in FSRQs from the optical variability in the form that the nonthermal jet emission becomes dominant when source is brighter, however, thermal emission from accretion disk is dominant when source is at low state, resulting in a tendency of redder when brighter (e.g. Gu et al., 2006). Although the beaming effect are usually believed to be nontrivial in FSRQs, the thermal emission from accretion disk can be significant and even are dominant in the optical region (e.g. Raiteri et al., 2007; Chen et al., 2009). Interestingly, the multiwavelength campaign of the ray detected radio-loud NLS1 PMN J0948+0022 from radio to rays, shown the emerging of the accretion disk emission when the synchrotron emission decreased (Abdo et al., 2009b). It is likely also the case in X-ray waveband (e.g. Foschini et al., 2009a), though it is claimed that in most radio loud quasars the contribution from a hot disk corona to the observed X-rays is negligible (in the hard X-ray band 2 keV), except for the steep-spectrum soft X-ray excess below 1 keV (e.g., Brinkmann et al. 1997; Yuan et al. 2000). Indeed, the integrated model including synchrotron jet emission, disk-corona emission and inverse Compton emission from jet has been used to model SED of NLS1s, from which the nature of radio loud NLS1s can be well studied (Abdo et al., 2009a, b, c; Foschini et al., 2009b).
While it strongly confirms the presence of a relativistic jet in radio-loud NLS1s, the ray detection is also important to study the jet properties by modeling the SEDs, e.g. the jet power, from which the characteristic of radio-loud NLS1s can be explored. Through the model fit including synchrotron self-Compton (SSC), external Compton (EC), and accretion disk-corona in four gamma-ray detected NLS1s, their jet powers are found in the average range of blazars with two sources in the region of quasars, and another two in the range of typical of BL Lac objects (Abdo et al., 2009c). However, the main differences with respect to blazars are in the black hole masses and accretion rates, as argued in Abdo et al. (2009c), with the former about 1-2 orders of magnitude lower than the typical blazar masses, and the later obviously higher than those of blazars. Moreover, blazars are usually hosted by elliptical galaxies, while it is likely to be spiral ones in radio-loud NLS1s (e.g. Zhou et al., 2006). From these observational evidences, Abdo et al. (2009c) claimed that radio-loud NLS1s may represent a third subset of ray AGNs, besides blazars and radio galaxies. If this is the case, it remains unclear whether radio-loud NLS1s should follow the blazar sequence (e.g. RXS J16290+4007 in this work). This certainly needs further investigations. On the other hand, it is still not clear why radio-loud NLS1s host a relativistic jet, and how it is formed. It can be even more complicated in terms of the fact that the host galaxies of NLS1s is generally of spiral type, which breaks the paradigm associating relativistic jets with giant elliptical (e.g. Marscher, 2009).
Although the accretion disk and jet are found to be closely related (e.g. Cao & Jiang, 2001; Gu et al., 2009a), the details of disk-jet coupling is not known yet, besides that jet formation and radio loud/quiet dichotomy of AGNs are not well understood (e.g. Tchekhovskoy et al., 2009). As one possibility, jet activity can be intermittent, due to, for example, the accretion disk instability (e.g. Czerny et al., 2009), which is recently adopted to explain CSS/GPS sources (Wu, 2009a). The existence of double double radio sources seems to support the intermittent scenario (e.g. Marecki & Szablewski, 2009). Optically, NLS1s are thought to be young AGNs with small black hole mass accreting at high accretion rate, implying the central accretion process are at the early stage of accretion history. In radio band, the compact nature of radio structure of CSS sources are believed to be due to the fact that sources are at early stage of evolutionary history, at which radio jets do not have time to expand to large scale yet (e.g. O’Dea, 1998; Gu et al., 2009b; Wu, 2009b). The high occurrence of sources optically defined as NLS1s with radio definition of CSS or GPS, suggests that the connection could have a physical origin (Gallo et al., 2006; Komossa et al., 2006), for example, perhaps the black hole environment and the radio component are forming simultaneously. It has been proposed that the narrow-line emission nebula of GPS/CSO galaxies is likely still in the early phases of its evolution, meanwhile they are at early evolutionary phases of radio-loud AGN (Vink et al., 2006). It might also be interesting to note that low-power CSS can probably be the parent population of the flat-spectrum RL NLS1 galaxies with beamed jet emission, as speculated in Yuan et al. (2008). Therefore, NLS1-CSS/GPS sources, for example, B3 1702+457 in this work, can be precious targets to explore the triggering of accretion process as well as the jet activity. As an example, the investigation of the SED of PKS 2004-447, a CSS and possible radio-loud NLS1, was recently presented by Abdo et al. (2009c), utilizing radio to ray data. Although the scarce, non-simultaneous data and the weakness of the -ray emission, preclude the tightly constrains on jet parameters, the jet power of PKS 2004-447 is claimed to be in the range typical of BL Lac Objects. As it may give clues on the trigger of AGNs activity, the potential connection between radio-loud NLS1 and CSS/GPS sources requires further investigations based on the large sample of radio-loud NLS1s (e.g. Zhou et al., 2006).
References
- Abdo et al. (2009a) Abdo A. A. et al., 2009a, ApJ, 699, 976
- Abdo et al. (2009b) Abdo A. A. et al., 2009b, ApJ, 707, 727
- Abdo et al. (2009c) Abdo A. A. et al., 2009c, ApJ, 707, L142
- Becker et al. (1995) Becker R. H., White R. L., Helfand D. J., 1995, ApJ, 450, 559
- Blandford & Königl (1979) Blandford R. D., Königl A., 1979, ApJ, 232, 34
- Boller et al. (1996) Boller T., Brandt W. N., Fink H., 1996, A&A, 305, 53
- Boroson (2002) Boroson T. A., 2002, ApJ, 565, 78
- Boroson & Green (1992) Boroson T. A., Green R. F., 1992, ApJS, 80, 109
- Brinkmann et al. (1997) Brinkmann W., Yuan W., Siebert J., 1997, A&A, 319, 413
- Cao & Jiang (2001) Cao X. W., Jiang D. R., 2001, MNRAS, 320, 347
- Celotti & Ghisellini (2008) Celotti A., Ghisellini G., 2008, MNRAS, 385, 283
- Chen et al. (2009) Chen Z. Y., Gu M. F., Cao X. W., 2009, MNRAS, 397, 1713
- Collin & Kawaguchi (2004) Collin S., Kawaguchi T., 2004, A&A, 426, 797
- Czerny et al. (2009) Czerny B., Siemiginowska A., Janiuk A., Nikiel-Wroczynski B., Stawarz L., 2009, ApJ, 698, 840
- Dallacasa et al. (2000) Dallacasa D., Stanghellini C., Centonza M., Fanti R., 2000, A&A, 363, 887
- Doi et al. (2006) Doi A., Nagai H., Asada K., Kameno S., Wajima K., Inoue M., 2006, PASJ, 58, 777
- Doi et al. (2007) Doi A. et al., 2007, PASJ, 59, 703
- Doi et al. (2009) Doi A. et al., 2009, ApJ, submitted
- Foschini et al. (2009a) Foschini L., Maraschi L., Tavecchio F., Ghisellini G., Gliozzi M., Sambruna R. M., 2009a, Adv. Space Res., 43, 889
- Foschini et al. (2009b) Foschini L., et al. 2009b, in ASP Conf. Ser., Accretion and Ejection in AGN: A Global View, ed. L. Maraschi, G. Ghisellini, R. Della Ceca, & F. Tavecchio (San Francisco, CA: ASP), in press (arXiv:0908.3313)
- Fossati et al. (1998) Fossati G., Maraschi L., Celotti A., Comastri A., Ghisellini G., 1998, MNRAS, 299, 433
- Gallo et al. (2006) Gallo L. C. et al., 2006, MNRAS, 370, 245
- Ghisellini et al. (1993) Ghisellini G., Padovani P., Celotti A., Marasch L., 1993, ApJ, 407, 65
- Ghisellini et al. (1998) Ghisellini G., Celotti A., Fossati G., Maraschi L., Comastri A., 1998, MNRAS, 301, 451
- Ghisellini & Tavecchio (2008) Ghisellini G., Tavecchio F., 2008, MNRAS, 387, 1669
- Goodrich (1989) Goodrich R.W., 1989, ApJ, 342, 22
- Grandi et al. (2006) Grandi P., Malaguti G., Fiocchi M., 2006, ApJ, 642, 113
- Gregory et al. (1996) Gregory P. C., Scott W. K., Douglas K., Condon J. J., 1996, ApJS, 103, 427
- Grupe et al. (1999) Grupe D., Beuermann K., Mannheim K., Thomas H.-C., 1999, A&A, 350, 805
- Grupe et al. (1998) Grupe D., Beuermann K., Thomas H.-C., Mannheim K., Fink H. H., 1998, A&A, 330, 25
- Gu et al. (2006) Gu M. F., Lee C. U., Pak S., Yim H. S., Fletcher A. B., 2006, A&A, 450, 39
- Gu et al. (2009a) Gu M. F., Cao X. W., Jiang D. R., 2009a, MNRAS, 396, 984
- Gu et al. (2009b) Gu M. F., Pak S., Ho L. C., 2009b, AN, 330, 253
- Ivezić et al. (2002) Ivezić Ž. et al., 2002, AJ, 124, 2364
- Kellermann & Pauliny-Toth (1969) Kellermann K. I., Pauliny-Toth I. I. K., 1969, ApJ, 155, L71
- Komossa & Meerschweinchen (2000) Komossa S., Meerschweinchen J., 2000, A&A, 354, 411
- Komossa et al. (2006) Komossa S., Voges W., Xu D., Mathur S., Adorf H. M., Lemson G., Duschl W., Grupe D., 2006, AJ, 132, 531
- Landt et al. (2008) Landt H., Padovani P., Giommi P., Perri M., Cheung C. C., 2008, ApJ, 676, 87
- Leighly (1999) Leighly K. M., 1999, ApJS, 125, 297
- Maraschi et al. (2008) Maraschi L., Foschini L., Ghisellini G., Tavecchio F., Sambruna R. M., 2008, MNRAS, 391, 1981
- Marecki & Szablewski (2009) Marecki A., Szablewski M., 2009, A&A, 506, L33
- Marscher (2009) Marscher A., 2009, in Lecture Notes in Physics 794, The Jet Paradigm From Microquasars to Quasars, ed. T. Belloni (Berlin: Springer ), in press (arXiv:0909.2576)
- Neumann et al. (1994) Neumann M., Reich W., Fuerst E., Brinkmann W., Reich P., Siebert J., Wielebinski R., Truemper J., 1994, A&AS, 106, 303
- O’Dea (1998) O’Dea C.P., 1998, PASP, 110, 493
- Orienti (2009) Orienti M., 2009, AN, 330, 167
- Osterbrock & Pogge (1985) Osterbrock D. E., Pogge R. W., 1985, ApJ, 297, 166
- Padovani et al. (2002) Padovani P., Costamante L., Ghisellini G., Giommi P., Perlman E., 2002, ApJ, 581, 895
- Raiteri et al. (2007) Raiteri C. M. et al., 2007, A&A, 473, 819
- Readhead (1994) Readhead A.C.S., 1994, ApJ, 426, 51
- Reeves & Turner (2000) Reeves J. N., Turner M. J. L., 2000, MNRAS, 316, 234
- Singal (2009) Singal A. K., 2009, ApJ, 703, L109
- Snellen et al. (2004) Snellen I. A. G., Mack K.-H., Schilizzi R. T., Tschager W., 2004, MNRAS, 348, 227
- Spergel et al. (2003) Spergel D. N. et al., 2003, ApJS, 148, 175
- Tchekhovskoy et al. (2009) Tchekhovskoy A., Narayan R., McKinney J. C., 2009, ApJ, submitted, arXiv: 0911.2228
- Vaughan et al. (1999) Vaughan S., Reeves J., Warwick R., Edelson R., 1999, MNRAS, 309, 113
- Véron-Cetty et al. (2001) Véron-Cetty M.-P., Véron P., Goncalves A. C., 2001, A&A, 372, 730
- Véron-Cetty & Véron (2001) Véron-Cetty M. P., Véron P., 2001, A&A, 374, 92
- Vink et al. (2006) Vink J., Snellen I., Mack K. H., Schilizzi R., 2006, MNRAS, 367, 928
- Wang et al. (1996) Wang T., Brinkmann W., Bergeron J., 1996, A&A, 309, 81
- Wu (2009a) Wu Q. W., 2009a, ApJ, 701, L95
- Wu (2009b) Wu Q. W., 2009b, MNRAS, 398, 1905
- Yuan et al. (2000) Yuan W., Brinkmann W., Gliozzi M., Zhao Y., Matsuoka M., 2000, A&A, 362, 19
- Yuan et al. (2008) Yuan W., Zhou H. Y., Komossa S., Dong X. B., Wang T. G., Lu H. L., Bai J. M., 2008, ApJ, 685, 801
- Zhou & Wang (2002) Zhou H., Wang T., 2002, Chinese Journal of Astron. & Astrophy., 2, 501
- Zhou et al. (2003) Zhou H., Wang T., Dong X., Zhou Y., Li C., 2003, ApJ, 584, 147
- Zhou et al. (2005) Zhou H., Wang T., Dong X., Li C., Zhang X., 2005, Chinese Journal of Astron. & Astrophy., 5, 41
- Zhou et al. (2006) Zhou H., Wang T., Yuan W., Lu H., Dong X., Wang J., Lu Y., 2006, ApJS, 166, 128
- Zhou et al. (2007) Zhou H. et al., 2007, ApJ, 658, L13


| Source | z | (mJy) | (mJy) | (mJy) | ||
|---|---|---|---|---|---|---|
| RXS J16290+4007 | 0.272 | 11.9 | 17.0 | 26.3 | 182 | -0.28 |
| RXS J16333+4718 | 0.116 | 65.0 | 33.6 | 21.2 | 205 | 0.52 |
| B3 1702+457 | 0.061 | 118.6 | 24.7 | 18.5 | 11 | 1.23 |
Column (1): Source name; Column (2): redshift; Column (3): FIRST 1.4 GHz flux density (Becker et al. 1995); Column (4): GB6 5 GHz flux density (Gregory et al., 1996); Column (5): JVN 8.4 GHz flux density (Doi et al., 2007); Column (6): radio loudness in Zhou & Wang (2002); Column (7): spectral index between 1.4 and 5 GHz.
| Source | z | (GHz) | Date | ID | Calibrator | Dis. (deg) |
|---|---|---|---|---|---|---|
| RXS J16290+4007 | 0.272 | 5 | 04/14/2004 | BP109A | J1625+4134 | 1.56 |
| 5 | 12/14/2005 | BP123C | J1625+4134 | 1.56 | ||
| 2.3, 8.4 | 09/08/2005 | BE042E | J1640+3946 | 2.23 | ||
| RXS J16333+4718 | 0.116 | 5 | 07/20/2000 | BM133C | J1631+4927 | 2.17 |
| B3 1702+457 | 0.061 | 5 | 06/16/2000 | BM133D | J1713+4916 | 3.98 |
| 5 | 08/21/2000 | BM133E | J1713+4916 | 3.98 |
Column (1): Source name; Column (2): redshift; Column (3): frequency; Column (4): observational date; Column (5): Program ID; Column (6): phase referencing calibrator; Column (7): angular distance of phase referencing calibrator to object in unit of degree.
| Source | Date | Comps. | log | log | ||||||
|---|---|---|---|---|---|---|---|---|---|---|
| (GHz) | (mas) | (deg) | (mJy) | (mas) | (K) | (K) | ||||
| RXS J16290+4007 | 5 | 04/14/2004 | C | … | … | 104.9 | 0.45 | 0.61 | 10.9 | 9.9 |
| 5 | 12/14/2005 | C | … | … | 107.8 | 0.50 | 0.54 | 10.9 | … | |
| E | 1.55 | 121.63 | 2.2 | 1.25 | 1.00 | … | … | |||
| 2.3 | 09/08/2005 | C | … | … | 68.9 | 0.56 | 1.00 | 11.0 | … | |
| 8.4 | 09/08/2005 | C | … | … | 78.1 | 0.03 | 1.00 | 12.4 | 12.2 | |
| RXS J16333+4718 | 5 | 07/20/2000 | C | … | … | 51.9 | 0.15 | 1.00 | 11.3 | 8.7 |
| E | 3.67 | 79.15 | 0.9 | 0.28 | 1.00 | … | … | |||
| W | 1.24 | -114.43 | 2.4 | 3.74 | 0.09 | … | … | |||
| B3 1702+457 | 5 | 06/16/2000 | C | … | … | 56.8 | 0.56 | 0.32 | 10.6 | 8.4 |
| W | 7.28 | -85.20 | 1.5 | 1.13 | 1.00 | … | … | |||
| 5 | 08/21/2000 | C | … | … | 55.6 | 0.33 | 0.37 | 11.0 | … | |
| W | 3.60 | -94.97 | 1.0 | 0.07 | 1.00 | … | … |
Note. — Column (1): Source name; Column (2): observing frequency; Column (3): observing date; Column (4): components: C = core, E = eastern components and W = western components; Column (5): the distance to core; Column (6): position angle; Column (7): flux density; Column (8): major axis; Column (9): axial ratio; Column (10): brightness temperature; Column (11): variability brightness temperature.