Spectroscopic confirmation of a galaxy cluster
associated with 7C 1756+6520 at
We present spectroscopic follow-up of an overdensity of galaxies photometrically selected to be at found in the vicinity of the radio galaxy 7C 1756+6520 at . Using the DEIMOS optical multi-object spectrograph on the Keck 2 telescope, we observed a total of -selected sources, comprising blue, star-forming galaxy candidates (s) and red, passively-evolving galaxy candidates (p*), as well as mid-infrared selected AGN candidates. We obtain robust spectroscopic redshifts for blue galaxies, red galaxies and AGN candidates. Assuming all foreground interlopers were identified, we find that only % (%) of the s (p*) galaxies are at . Therefore, the criteria are shown to be relatively robust at identifying galaxies at moderate redshifts. Twenty-one galaxies, including the radio galaxy, four additional AGN candidates and three red galaxy candidates are found with , forming a large scale structure at the redshift of the radio galaxy. Of these, eight have projected offsets Mpc relative to the radio galaxy position and have velocity offsets km s-1 relative to the radio galaxy redshift. This confirms that 7C 1756+6520 is associated with a high-redshift galaxy cluster. A second compact group of four galaxies is found at , forming a sub-group offset by km/s and approximately east of the radio galaxy.
Key Words.:
large scale structure - galaxies: clusters: general - galaxies: evolution - galaxies: individuals (7C 1756+6520)1 Introduction
Galaxy clusters provide an important tool for studying both the formation of galaxies and for deriving cosmological parameters. Out to the furthest redshifts studied thus far, the oldest, most massive galaxies reside within clusters, and thus clusters provide ideal probes of the formation and evolution of galaxies. As the largest collapsed structures in the universe, the cosmic history of galaxy clusters is sensitive to key cosmological parameters (e.g., Vikhlinin et al., 2009; Stern et al., 2010). Significant work has been done to discover more distant galaxy clusters. However, the number of clusters currently confirmed at remains low. Two of the most distant confirmed galaxy clusters were identified from the extended X-ray emission of the intracluster medium: XMMU J2235.3-2557 at (Mullis et al., 2005; Lidman et al., 2008; Rosati et al., 2009) and XMMXCS J2215.9-1738 at (Stanford et al., 2006; Hilton et al., 2007). However, the X-ray identification of candidate clusters is very difficult at since the surface brightness of the extended X-ray emission fades as .
Another method to find galaxy clusters has been to detect overdensities of red sources in optical imaging data using the so-called ‘red sequence method’. Gladders & Yee (2000) showed that two filter imaging is sufficient to perform a cluster search through the detection of the red sequence of early-type galaxies. The colours of such galaxies are quite distinct due to the strong Å break (D4000) in their spectra. However, this break shifts into the near-infrared at , and the colors can become degenerate. Using sensitive mid-infrared data obtained with the Spitzer Space Telescope, the Spitzer Adaptation of the Red-Sequence Cluster Survey (SpARCS; Wilson et al., 2009) team have recently pushed the technique to higher redshift and confirmed one galaxy cluster at . Using full photometric redshifts with effectively a stellar mass-selected galaxy sample, Eisenhardt et al. (2008) have identified 106 galaxy cluster candidates at , 13 of which have been spectroscopically confirmed to date. This technique, which does not depend on the presence of a red sequence, has confirmed three galaxy clusters at , with the most distant at (Stanford et al., 2005).
An alternative method to find high-redshift galaxy clusters is to look in the surroundings of powerful, high-redshift radio galaxies (HzRGs). HzRGs are among the most massive galaxies in the Universe (; Seymour et al., 2007) and therefore are likely to inhabit dense regions. Narrow-band imaging surveys have been intensively conducted in the surroundings of HzRGs, mostly at to search for overdensities of Ly and/or H emitters. Numerous overdensities have been detected and spectroscopically confirmed around radio galaxies at , reaching even to (TN J0924-2201; Venemans et al., 2007). However, Ly emitters are small, faint, young star-forming galaxies with masses of a few (Overzier et al., 2008), and probably represent only a small fraction of the total stellar mass of these clusters. Furthermore, at such high redshifts, these overdensities are suspected to still be forming and not yet bound. The term ‘protoclusters’ is commonly used to describe such systems. A complementary approach is to isolate the evolved, massive galaxy population near HzRGs using purely near-infrared colour selection (Kajisawa et al., 2006; Kodama et al., 2007). Though this method has successfully found overdensities of red galaxies at , it has been challenging to spectroscopically confirm their association with the HzRGs (e.g., Doherty et al., 2010). A few studies have also applied related methods to slightly lower redshift HzRGs — e.g., Stern et al. (2003) and Best et al. (2003) found overdensities of extremely red galaxies in the environments of radio-loud active galactic nuclei (AGN) at .
Recently, Galametz et al. (2009) (G09 hereafter) presented an overdensity of galaxy candidates at in the field of the radio galaxy 7C 1756+6520. The radio galaxy was initially reported to be at by Lacy et al. (1999) based on the tentative identification of a single, uncertain emission feature. Based on deeper Keck spectroscopy, we find that the radio galaxy is, in fact, at (see §3.1). G09 made use of a revised version of the so called ‘ criteria’, a two-colour selection technique based on photometry (Daddi et al., 2004) to isolate galaxies at and classify them as either red, passively evolving (p) or blue, star-forming (s) systems. The star-forming candidates are selected by . The original Daddi et al. (2004) criterion selected passive (p) systems by , but was empirically shown in G09 to have a low success rate at . In G09, we therefore extended the selection criteria to reliably identify galaxies at the low-redshift end of the criteria by defining p* galaxies to have .
G09 selected s and p* galaxies in the field around 7C 1756+6520 using deep, multiwavelength data: -band and -band images from the Large Format Camera (LFC; Simcoe et al., 2000) on the Palomar 5m Hale telescope and a -band (hereafter ) image from the Wide-field Infrared Camera (WIRCAM; Puget et al., 2004) on the Canada-France-Hawaii telescope (see G09, Table 1 for details).
Relative to the four deep MUSYC blank fields (Gawiser et al., 2006; Quadri et al., 2007), G09 found an overdensity of cluster member candidates around 7C 1756+6520 for both s and p* galaxies — by a factor of and , respectively. Using the Spitzer/IRAC colour-colour selection of Stern et al. (2005), we also isolated mid-infrared selected AGN candidates around 7C 1756+6520, which represents an overdensity by a factor of two compared to the IRAC Shallow Survey (Eisenhardt et al., 2004).
We describe in this paper the results of our spectroscopic follow-up of the overdensity found in the surroundings of 7C 1756+6520. The next section presents the selected targets, observations and data reduction. Section 3 describes the results of our spectroscopy and presents the redshift distribution of the observed sources. Section 4 reports the discovery of a concentration of galaxies whose redshifts are close to that of the radio galaxy. We assume a CDM cosmology with km s-1 Mpc-1, and . The magnitudes are expressed in the AB photometric system unless otherwise stated.
2 Keck/DEIMOS Spectroscopy
In order to examine whether the detected overdensities were indeed associated with 7C 1756+6520, we started a spectroscopic follow up campaign at the Keck 2 telescope using the Deep Imaging Multi-Object Spectrograph (DEIMOS; Faber et al., 2003).
We observed one slit mask on UT 2008 August 31 using the 600ZD grating which is blazed at Å, covers a typical wavelength range of Å, and has a spectral resolution of Å (FWHM). This slitmask targeted sources, including one AGN candidate, s galaxies and p* galaxies. Eight 1800s exposures were obtained over the course of three nights using the same mask; conditions were clear with 08 seeing on average.
Two additional slit masks were observed in September 2009, again with DEIMOS and the 600ZD grating. The first mask, observed for a total of 2.5 hr on UT 2009 September 16, contained objects: the radio galaxy itself, five AGN candidates, s galaxies and p* galaxies. This slit mask was oriented so that a p* galaxy south-west of 7C 1756+6520 was on the same slitlet as the radio galaxy itself (e.g., PA). The second slit mask, observed for a total of 1.75 hr on UT 2009 September 17, contained sources: seven AGN candidates, s galaxies and p* galaxies. Both nights were exceptional, with photometric conditions and 05 seeing.
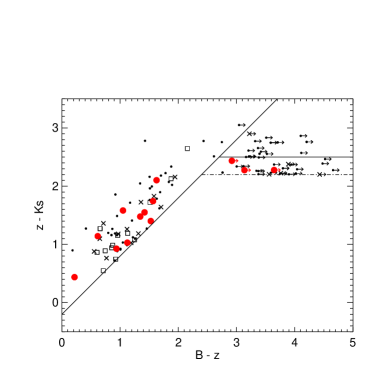
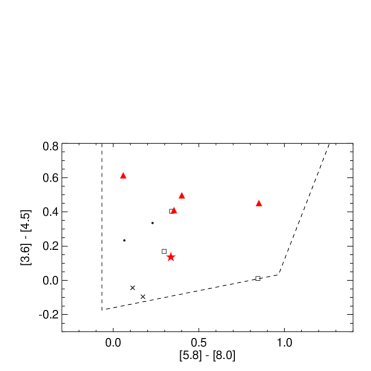
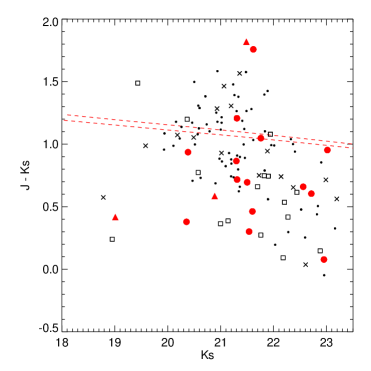
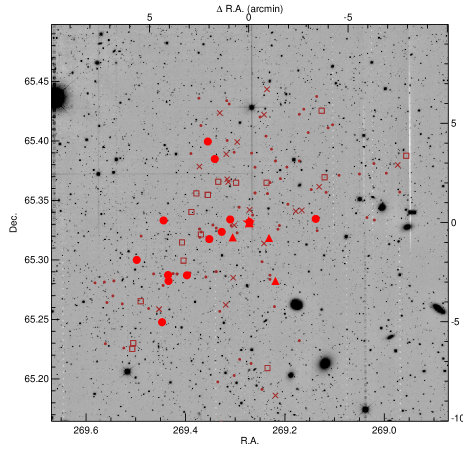
Fourteen galaxies and two AGN were observed multiple times across these three slit masks. Thus, the total number of distinct targets was -selected targets — including () s (p*) galaxies — as well as AGN candidates and the radio galaxy itself. Fig. 1 shows the distribution of the targets in the two colour-colour diagrams used in G09 to select candidate cluster members: the ‘’ diagram for the -selected galaxies and the IRAC vs. diagram for the mid-infrared selected AGN. We refer to G09 for details on the selection techniques. The last panel of Fig. 1 shows the distribution of our targets in a vs. colour-magnitude diagram. Fig. 2 shows the spatial distribution of these targets around the radio galaxy. The targeted sources have optical magnitudes in the range with and near-infrared magnitudes in the range with .
All data were processed using a slightly modified version of the pipeline developed by the DEEP2 team at UC-Berkeley, and data were flux calibrated using archival sensitivity functions for the same instrument configuration derived using standard stars from Massey & Gronwall (1990). The uncertainty on the wavelength calibration, derived from sky lines, was found to be Å and consistent from mask to mask.
3 Results
3.1 Spectrum of 7C 1756+6520
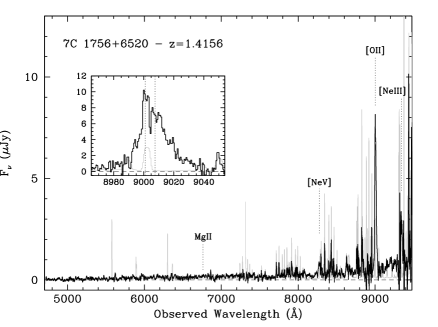
Lacy et al. (1999) tentatively assigned to the radio galaxy based on an uncertain emission line at 6005 Å assumed to be [NeIV]Å. This redshift was assigned a quality ‘’, indicating an ‘uncertain’ redshift. We obtained a quick ( min) spectrum of the radio galaxy during twilight on UT 2009 April 27 using the Low Resolution Imaging Spectrometer (LRIS; Oke et al., 1995) on the Keck 1 telescope. These data detected only a single, faint emission line at 6759 Å from which no reliable redshift could be assigned. The deeper Keck/DEIMOS spectrum obtained in September 2009 (Fig. 3) yielded a redshift of based on three clearly detected emission lines: [NeV]Å, [OII]Å and [NeIII]Å. The [OII] line (Fig. 3, inset) is clearly split in these data. In retrospect, the faint emission line in the LRIS spectrum in fact corresponds to MgIIÅ. We note that the emission line in Lacy et al. (1999), from which their redshift identification was based, is not detected in either of our deeper Keck spectra. It would correspond to restframe Å at the redshift of the radio galaxy and was therefore most likely a spurious detection.
3.2 Spectroscopy of candidate cluster members
The redshift range is often described as the ‘redshift desert’ because optical spectroscopic confirmation of targets in that redshift range is challenging, with most of the strongest classical spectral features (e.g., [OII]Å, D, HÅ, [OIII]Å, HÅ) redshifted longward of the wavelength range where CCDs are most sensitive (e.g., Å). DEIMOS uses a modern, red-sensitive CCD detector which, combined with the grating we had installed for these observations, provides data out to m and would, in principle, detect the [OII] emission line to . However, the sensitivity of the spectrograph detectors rapidly decreases at the longest wavelengths and telluric OH emission becomes progressively problematic, especially at Å (corresponding to for the [OII] line).
A visual inspection of the reduced spectra permitted us to assign spectroscopic redshifts () to galaxies, AGN candidates and the radio galaxy (see §3.1). Due to the design of the masks and the length of the slits, we also obtained additional spectroscopic redshifts of several serendipitous sources. We determined redshifts by fitting emission lines by gaussian profiles. When clearly split, the [OII] doublet was fit by a double gaussian profile. We derived uncertainties on the spectroscopic redshifts by adding in quadrature the fitting uncertainties and the small uncertainty in the wavelength calibration (see §2; Å corresponds to ). We assigned a quality flag ‘A’ or ‘B’ to all measured redshifts: ‘A’ indicates a highly certain based on at least two spectral features or [OII]Å being clearly identified as a doublet; ‘B’ indicates high-level confidence in the based on one well-detected spectral feature. Lower confidence quality flags were recorded during our data analysis, but are not reported here.
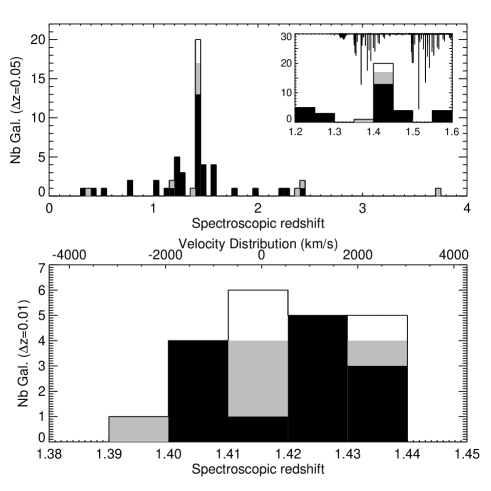
Fig. 4 presents the distribution of our spectroscopic redshifts. Coordinates, , redshift, quality flags (Q), magnitudes and the target selection criteria of all confirmed sources are provided in Table 1 (for members of the HzRG large-scale structure) and Table 2 (for the foreground/background sources). The final column of these tables lists the spectral features used to determine redshifts.
3.2.1 -selected sources
We obtained spectroscopic redshifts for (%) of the targeted -selected sources, including (%) of the s targets and seven (%) of the p* targets. The majority (%) of the redshifts were calculated from the [OII]Å doublet, which is resolved at the spectral resolution of the DEIMOS data. Other features, such as MgIIÅ (either in absorption or emission) or the D4000 break, were also present in several of the spectra, permitting us to unambiguously confirm our redshift identifications.
Of the sources for which we derived successful spectroscopic redshifts, % (%) of the s (p*) galaxies are at . Based on these spectroscopic results, it is challenging to derive definitive conclusions regarding the reliability of the criterion to select high-redshift galaxies. At , bright and numerous sky lines (see Fig. 4, sub-panel) coupled with decreasing detector sensitivity at longer wavelengths limits our ability to measure redshifts based on the [OII] doublet. Furthermore, our redshift coverage does not permit detection of [OII] at (and at slightly lower redshifts for many sources since the spectral coverage of any given source will depend on where it is located on the slitmask). With these caveats in mind, we now briefly discuss the efficiency of the two criteria to identify galaxies at .
s galaxies: Assuming that the s criterion successfully identifies sources with strong signatures of star formation — e.g., strong [OII], [OIII] and H emission lines — then our Keck/DEIMOS data should have yielded robust spectroscopic redshifts for the vast majority of s galaxies at . Indeed, all but four of the successfully identified s sources show these emission lines. The last four are at where the [OII] line had shifted beyond the spectroscopic coverage of our instrument; their redshifts instead are based on absorption lines such as CIV1549 and AlII1670 which are commonly seen in the UV spectra of star-forming galaxies. If we thus assume that our data identified all of the interlopers and that the failed sources are all at , then we find that the s criterion is quite robust, with only % of such targets at .
p* galaxies: As expected, the p* galaxies often presented very red optical continuum with no clear features (e.g., spectral breaks) — indeed, all seven of the p* galaxies for which we did derive spectroscopic redshifts had [OII] emission features. For evolved galaxies, the D4000 break is generally the strongest spectral signature. However, assuming that a spectrum must cover out to restframe Å to robustly identify this feature, then the m cut-off of the DEIMOS data implies that we can only identify D4000 out to ; we are thus forced to rely on weaker spectroscopic features such as B2900 or B2640 to identify evolved galaxies at and beyond. This makes redshift determinations challenging, and is presumably the reason for our low success rate for the p* sources. Assuming that our data identified all of the foreground interlopers and that the failed sources are all at , we find that the p* criteria are also robust, with only 9% of such targets at . We note, however, that this assumption is less robust than the similar assumption for the s galaxies, given the low signal-to-noise ratio of the p spectra.
In the colour-magnitude diagram in Fig. 1 (bottom panel), we show the expected location of the red sequence at for a formation redshift (T. Kodama, private communication; see also Kodama et al., 1998). We targeted numerous p* galaxies with colours consistent with the red sequence for which we unfortunately could not determine a redshift. However, the three p* galaxies that were confirmed to be at all have would have been missed by the standard Daddi et al. (2004) criterion for p galaxies (see §1). Our modified p* criterion presented in G09 increases the completeness of galaxies at . On the other hand, our selection is also contaminated by lower redshift (albeit still relatively distant) objects. The other four p* with are foreground interlopers with .
3.2.2 Mid-infrared selected AGN candidates
Eleven of the AGN candidates presented in G09 were observed and we were able to assign spectroscopic redshifts for of these . The AGN selection criterion of Stern et al. (2005) does not preferentially select AGN in any specific redshift range (other than an inefficiency at selecting sources at where H shifts into the IRAC channel 1 and produces blue [3.6][4.5] colours; see Assef et al. 2010). The mid-infrared selection criteria are also sensitive to both obscured and unobscured AGN (e.g., Eckart et al., 2010). Unsurpringly, therefore, we identified AGN at a range of redshifts () and with a range of properties.
The three AGN at are all classical (e.g., unobscured or type 1) quasars showing broad CIVÅ and CIII]Å emission lines. Two AGN candidates (Table 1, sources and ) do not show any classical AGN features. The first was assigned a quality B spectroscopic redshift of based on a single emission line (which falls on a sky line) attributed to [OII], though the spectrum also shows hints of spectral breaks at restframe Å and Å, making the inferred redshift quite likely. The second source shows a resolved [OII] doublet at . Two AGN candidates at show both the narrow [OII] doublet (which could be due to AGN activity and/or star formation) as well as broad MgII emission, which clearly indicates an AGN. Four of the mid-infrared selected AGN candidates sources are at redshifts close to the radio galaxy and are discussed more in §4.2 (see Table 1).
4 A structure of galaxies associated with 7C 1756+6520
4.1 Companions close to the radio galaxy
In G09 we stated that an s galaxy, a p* galaxy and an AGN candidate are all found within of 7C 1756+6520. For , this corresponds to a projected separation of 50 kpc. The probability of finding three candidates in such a small area is less than %, suggesting that these sources are all associated with the radio galaxy. Both the p* and the AGN candidates were observed with DEIMOS. The p* source shows a clear, resolved [OII] doublet at , and is thus associated with the radio galaxy (Table 1, ID ; quality A). The AGN candidate shows a single, broad emission line which we interpret to be MgII at (Table 1, ID ; quality B). The s galaxy was not observed. We therefore believe that the radio galaxy has at least one, most probably two, and perhaps three close-by companions.
4.2 Two compact sub-groups in a large scale structure
A clear peak is seen in the spectroscopic redshift distribution near the radio galaxy redshift (Fig. 4). Not including the HzRG, galaxies are found with , corresponding to peculiar velocities km s-1 with respect to the radio galaxy. Table 1 reports the coordinates and magnitudes of these galaxies ( including the HzRG), comprising four mid-infrared AGN candidates, three p* galaxies, s galaxies and three serendipitous galaxies. The first serendipitous galaxy, Cl1756.6 (or serendip.1), is blended in all of our imaging bands with an object at . The foreground object, whose photometry is contaminated in all three bands by its projected neighbor, was one of our targeted s galaxies. The second (Cl1756.8, or serendip.2) was observed in the same slit as Cl1756.9, one of the s targets. The two sources are close both on the plane of the sky and in redshift, and are therefore close-by companions. Cl1756.8 is very faint at (detected at ) and was not considered by our criteria. The last serendipitous object (Cl1756.20, or serendip.3) was not selected by any of our criteria. The coordinates and magnitudes of the three p* (Cl1756.5, Cl1756.12 and Cl1756.15 in Table 1) were previously reported in G09 as galaxies , and , respectively (see Table 5 of G09). G09 did not tabulate the s candidates.
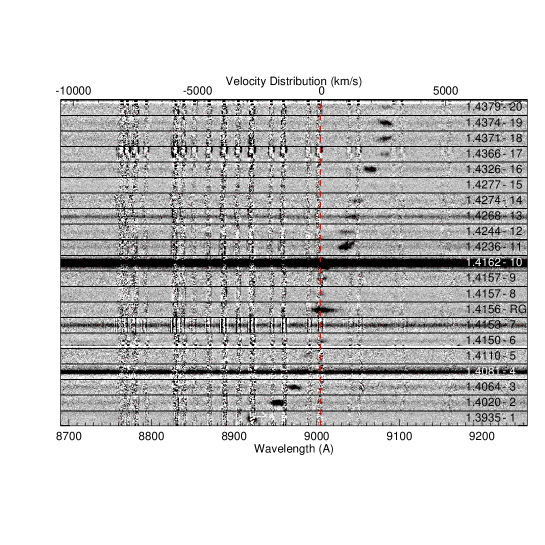
The two dimensional spectra of the galaxies associated with 7C 1756+6520 are shown in Fig. 5, centered near the [OII] line used to determine their redshifts. As expected, the p* galaxies (sources , and ) show fainter [OII] emission lines than most of the AGN or star-forming (s) candidates.
There is still no clear and agreed upon definition of a galaxy cluster. Eisenhardt et al. (2008) considers a cluster spectroscopically confirmed if five galaxies are robustly identified within a radius of Mpc and km s-1. According to this definition, objects (including the radio galaxy) would therefore be part of our galaxy cluster. However, the spectroscopically-confirmed, high-redshift galaxy clusters in Eisenhardt et al. (2008) and elsewhere usually show much narrower velocity distributions. The spectroscopically confirmed members of XMMXCS J2215.9-1738 at all have peculiar velocities offset by less than km s-1 with respect to the cluster redshift (Hilton et al., 2007). Recently, Hayashi et al. (2009) presented an [OII] emission survey of this same cluster. They identified [OII] emitters over a larger area centered on the cluster with km s-1 with respect to the cluster redshift.
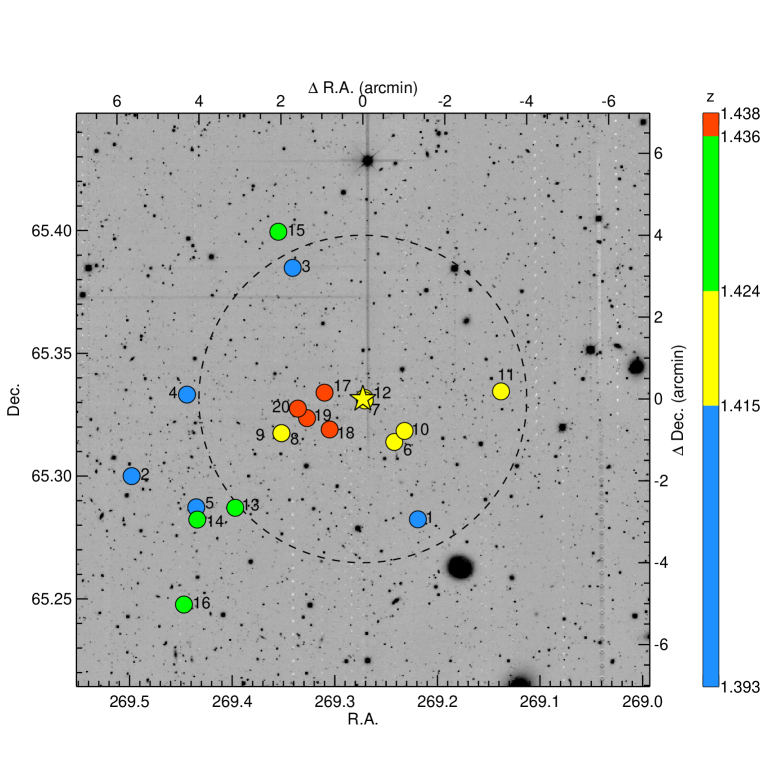
The spatial distribution of the objects is shown in Fig. 6 (the red symbols in Fig. 2 and the three additional serendipitous objects). Seven galaxies (IDs ) have velocities within km s-1 of the radio galaxy redshift (i.e., the assumed cluster redshift) and are found within Mpc of the HzRG (yellow circles; ). The lowest redshift sources (IDs ; blue circles; ) are found with projected separations more than Mpc with respect to the radio galaxy ( beyond Mpc). Objects with (IDs ; green circles) are all more than Mpc distant from the radio galaxy. In contrast, the highest redshift sources (IDs ; orange circles; ) are found within from each other and appear to form a compact sub-structure. We therefore confirm that 7C 1756+6520 is part of a large scale structure of galaxies composed of (at least) two main galaxy groups — the galaxy cluster centered on the radio galaxy redshift () and a compact galaxy sub-group at . Following the methodology of Beers et al. (1990) for a small number of galaxy cluster members, we estimated velocity dispersions using the ‘jackknife of the gapper’ estimator. We found that the velocity dispersion of sources within Mpc from the radio galaxy (i.e., IDs + ID + IDs + the radio galaxy) is km s-1. A velocity dispersion of km s-1 was derived for the galaxy cluster associated with the radio galaxy (yellow circles in Fig. 6). Given the small number of galaxies used in the calculation, the velocity dispersions given here are only indicative.
4.3 A high fraction of AGN cluster members
Four mid-infrared AGN candidates have been confirmed to be associated with 7C1756+6520 (IDs , , and ). Galaxies and , both targeted as s galaxies, also show AGN signatures in their spectra with strong, broad MgII emission lines. Assuming that the mid-infrared selected sources are indeed all active, six AGN (seven with the radio galaxy) have therefore been spectroscopically confirmed in close proximity both spatially and in redshift space. Three of them are found within of the radio galaxy. Studying the surface density of luminous AGN associated with a sample of galaxy clusters at , Galametz et al. (2009) found an excess of AGN within Mpc of the center of clusters at . They identify AGN using three different selection methods including the Stern et al. (2005) mid-infrared selection. Our spectroscopy brings additional evidence that galaxy clusters at have a significant fraction of members being AGN and that they lie preferentially near the cluster center.
5 Conclusions
The observations presented here confirm the existence of a large scale structure of galaxies associated with 7C 1756+6520. We assign a new reliable redshift of to the radio galaxy. Our optical spectroscopy demonstrates the efficiency of the selection technique of Daddi et al. (2004) at finding galaxies at . It also shows that the modified p* criterion presented in G09 increases the completeness of galaxies at . We find twenty galaxies with spectroscopic redshifts consistent with the redshift of 7C 1756+6520. Seven of these galaxies have velocity offsets km s-1 relative to the redshift of the radio galaxy (assumed here to be the galaxy structure mean redshift) and are within Mpc of the radio galaxy. A second compact group of four galaxies (all within of each other) lies at and forms an associated sub-group of galaxies, offset by about to the east of the radio galaxy. 7C 1756+6520 is therefore part of a large scale galaxy structure composed of (at least) two main groups — a galaxy cluster centered on the radio galaxy at (with spectroscopically confirmed members including the radio galaxy) and a compact group at , east of the radio galaxy (with confirmed members so far).
Acknowledgements.
This work is based on a spectroscopic campaign at the W. M. Keck Observatory, a scientific partnership between the University of California and the California Institute of Technology, made possible by a generous gift of the W. M. Keck Foundation. We are very grateful to Tadayuki Kodama for having provided the models of red sequence presented in this paper. We thank the anonymous referee for his/her careful reading of the manuscript and constructive comments. The work of DS and RLG was carried out at Jet Propulsion Laboratory, California Institute of Technology, under a contract with NASA. SAS’s work was performed under the auspices of the U.S. Department of Energy, National Nuclear Security Administration by the University of California, Lawrence Livermore National Laboratory under contract No. W-7405-Eng-48.| ID | Namea | R.A. | Dec. | Qb | Notes | ||||
|---|---|---|---|---|---|---|---|---|---|
| (J2000) | (J2000) | (AB) | (AB) | (AB) | |||||
| Cl 1756.1 | AGN.1110 | 17:56:52.56 | 65:16:56.65 | B | B, B, [OII] | ||||
| Cl 1756.2 | s.6355 | 17:57:59.55 | 65:18:00.64 | A | [OII] | ||||
| Cl 1756.3 | s.9622 | 17:57:21.75 | 65:23:05.04 | A | [OII] | ||||
| Cl 1756.4 | s.7556 | 17:57:46.54 | 65:20:00.48 | A | AGN: broad MgII, [OII] | ||||
| Cl 1756.5 | p.5858 | 17:57:44.40 | 65:17:14.30 | B | [OII]; ID in G09 | ||||
| Cl 1756.6 | serendip.1 | 17:56:57.67 | 65:18:49.45 | A | - | - | - | [OII] | |
| Cl 1756.7d | AGN.1354 | 17:57:04.98 | 65:19:51.00 | B | - | AGN: broad MgII | |||
| HzRG | 7C 1756+6520 | 17:57:05.48 | 65:19:53.75 | A | AGN: [NeV], [OII], [NeIII] | ||||
| Cl 1756.8 | serendip.2 | 17:57:25.00 | 65:19:04.83 | A | [OII] | ||||
| Cl 1756.9 | s.6997 | 17:57:24.43 | 65:19:03.87 | A | [OII] | ||||
| Cl 1756.10 | AGN.1317 | 17:56:55.75 | 65:19:07.00 | A | AGN: broad MgII, [NeV], [OII] | ||||
| Cl 1756.11 | s.7624 | 17:56:33.16 | 65:20:04.46 | A | FeII+MgII absn, [OII ] | ||||
| Cl 1756.12e | p.7523 | 17:57:05.04 | 65:19:54.50 | A | [OII]; ID in G09 | ||||
| Cl 1756.13 | s.5860 | 17:57:35.34 | 65:17:14.39 | A | AGN: broad MgII, [OII] | ||||
| Cl 1756.14 | s.5699 | 17:57:44.06 | 65:16:57.11 | A | [OII] | ||||
| Cl 1756.15 | p.10235 | 17:57:25.20 | 65:23:58.19 | B | [OII]; ID in G09 | ||||
| Cl 1756.16 | s.4449 | 17:57:47.40 | 65:14:52.17 | A | [OII] | ||||
| Cl 1756.17 | s.7625 | 17:57:14.41 | 65:20:02.40 | A | [OII] | ||||
| Cl 1756.18 | AGN.1206 | 17:57:13.08 | 65:19:08.37 | A | [OII] | ||||
| Cl 1756.19 | s.7208 | 17:57:18.31 | 65:19:24.94 | A | [OII] | ||||
| Cl 1756.20 | serendip.3 | 17:57:20.76 | 65:19:39.14 | A | [OII] |
-
a
The names are composed of the selection technique for the source — AGN, s or p ( p* here) — followed by the identification number in our -band (m) catalogue for (AGN) targets. Sources serendipitously identified are given a simple ’serendip.#’ designation.
-
b
Q indicates the quality of the redshift, either ‘A’ indicating a highly certain redshift, or ‘B’ indicating a high level of confidence (see §3.2).
-
c
Magnitudes were derived using SExtractor MAG_AUTO and are therefore slightly different from the aperture magnitudes used to derive colours for candidate selection.
-
d
AGN found within of 7C 1756+6520. No accurate magnitude is available in due to an artifact caused by a bright star in the near-infrared data. See Fig. 12 in G09.
-
e
p* galaxy found within of 7C 1756+6520.
| Namea | R.A. | Dec. | Qb | Notes | ||||
|---|---|---|---|---|---|---|---|---|
| (J2000) | (J2000) | (AB) | (AB) | (AB) | ||||
| s.8902 | 17:57:15.84 | 65:22:04.07 | B | [OIII] | ||||
| AGN.1005 | 17:57:05.48 | 65:19:53.75 | A | CaHK, H, H, [NII] | ||||
| s.4858 | 17:57:48.87 | 65:15:31.59 | A | H, [OIII], H | ||||
| s.9364 | 17:57:29.28 | 65:22:42.61 | B | [OIII] | ||||
| s.7895 | 17:57:05.04 | 65:20:31.57 | A | [OII], H | ||||
| s.6858 | 17:56:58.08 | 65:18:50.05 | B | [OII] | ||||
| s.7921 | 17:56:39.84 | 65:20:30.52 | A | [OII], [NeIII] | ||||
| s.11226 | 17:57:19.44 | 65:25:24.60 | A | [OII], [NeIII], H | ||||
| s.9844 | 17:57:16.38 | 65:23:19.85 | A | [OII] | ||||
| p.7866 | 17:56:42.72 | 65:20:27.97 | B | [OII] | ||||
| AGN.1767 | 17:57:15.33 | 65:21:56.14 | A | MgII, [OII] | ||||
| s.9430 | 17:55:53.37 | 65:22:48.02 | A | AGN: MgII absn, [OII], [NeIII], H, H, | ||||
| p.7359 | 17:57:12.44 | 65:19:45.10 | A | [OII] | ||||
| p.4948 | 17:57:16.54 | 65:15:44.17 | A | [OII] | ||||
| s.11168 | 17:56:57.97 | 65:25:20.26 | A | [OII] | ||||
| s.12407 | 17:56:56.58 | 65:26:36.42 | A | [OII] | ||||
| s.8631 | 17:56:31.31 | 65:21:41.17 | A | [OII] | ||||
| p.10254 | 17:57:11.04 | 65:23:56.76 | A | [NeV], [OII], [NeIII] | ||||
| s.2137 | 17:56:52.56 | 65:11:09.95 | A | H, [OIII], [NII] | ||||
| s.8410 | 17:57:25.15 | 65:21:18.01 | A | [OII] | ||||
| s.7159 | 17:57:28.56 | 65:19:17.93 | A | [OII] | ||||
| s.6886 | 17:57:37.75 | 65:18:53.95 | A | [OII] | ||||
| s.8761 | 17:56:57.03 | 65:21:53.86 | A | [OII] | ||||
| s.8799 | 17:57:11.43 | 65:21:53.94 | A | CIII], MgII abns, [OII] | ||||
| s.2998 | 17:56:56.40 | 65:12:32.76 | A | [OII] | ||||
| s.9006 | 17:56:28.73 | 65:22:10.94 | A | [OII] | ||||
| s.9788 | 17:55:49.35 | 65:23:16.14 | A | FeII+MgII absn | ||||
| s.11725 | 17:56:30.31 | 65:25:31.69 | B | AGN: broad MgII | ||||
| s.5102 | 17:57:57.61 | 65:15:55.59 | A | AlII, MgII | ||||
| s.6330 | 17:57:37.08 | 65:17:58.83 | A | AGN: CIV, CIII], MgII | ||||
| s.3534 | 17:58:01.74 | 65:13:31.73 | A | CIV+AlII absn | ||||
| AGN.1748 | 17:57:20.07 | 65:21:56.96 | A | Quasar: CIV, CIII] | ||||
| AGN.1340 | 17:57:30.88 | 65:21:22.32 | A | Quasar: CIV, CIII] | ||||
| s.3718 | 17:58:01.19 | 65:13:49.25 | A | CIV+AlII absn | ||||
| AGN.1213 | 17:57:33.22 | 65:20:26.24 | A | Quasar: Ly, CIV, CIII] |
-
a
The names are composed of the selection technique for the source — AGN, s or p ( p* here) — followed by the identification number in our -band (m) catalogue for (AGN) targets.
-
b
Q indicates the quality of the redshift, either ‘A’ indicating a highly certain redshift, or ‘B’ indicating a high level of confidence (see §3.2).
-
c
Magnitudes were derived using SExtractor MAG_AUTO and are therefore slightly different from the aperture magnitudes used to derive colours for candidate selection.
References
- Assef et al. (2010) Assef, R. J. et al. 2010, ArXiv:1001.4529
- Beers et al. (1990) Beers, T. C., Flynn, K., & Gebhardt, K. 1990, AJ, 100, 32
- Best et al. (2003) Best, P. N. et al. 2003, MNRAS, 343, 1
- Daddi et al. (2004) Daddi, E. et al. 2004, ApJ, 617, 746
- Doherty et al. (2010) Doherty, M. et al. 2010, A&A, 509, 83
- Eckart et al. (2010) Eckart, M. E., McGreer, I. D., Stern, D., Harrison, F. A., & Helfand, D. J. 2010, ApJ, 708, 584
- Eisenhardt et al. (2004) Eisenhardt, P. R. et al. 2004, ApJS, 154, 48
- Eisenhardt et al. (2008) Eisenhardt, P. R. M. et al. 2008, ApJ, 684, 905
- Faber et al. (2003) Faber, S. M. et al. 2003, in SPIE Conference Series, Vol. 4841, Society of Photo-Optical Instrumentation Engineers (SPIE) Conference Series, 1657–1669
- Galametz et al. (2009) Galametz, A. et al. 2009, A&A, 507, 131
- Galametz et al. (2009) —. 2009, ApJ, 694, 1309
- Gawiser et al. (2006) Gawiser, E. et al. 2006, ApJS, 162, 1
- Gladders & Yee (2000) Gladders, M. D. & Yee, H. K. C. 2000, AJ, 120, 2148
- Hayashi et al. (2009) Hayashi, M. et al. 2009, ArXiv:0911.2530
- Hilton et al. (2007) Hilton, M. et al. 2007, ApJ, 670, 1000
- Kajisawa et al. (2006) Kajisawa, M. et al. 2006, MNRAS, 371, 577
- Kodama et al. (1998) Kodama, T. et al. 1998, A&A, 334, 99
- Kodama et al. (2007) —. 2007, MNRAS, 377, 1717
- Lacy et al. (1999) Lacy, M., Rawlings, S., Hill, G. J., Bunker, A. J., Ridgway, S. E., & Stern, D. 1999, MNRAS, 308, 1096
- Lidman et al. (2008) Lidman, C. et al. 2008, A&A, 489, 981
- Massey & Gronwall (1990) Massey, P. & Gronwall, C. 1990, ApJ, 358, 344
- Mullis et al. (2005) Mullis, C. R. et al. 2005, ApJ, 623, L85
- Oke et al. (1995) Oke, J. B. et al. 1995, PASP, 107, 375
- Overzier et al. (2008) Overzier, R. A. et al. 2008, ApJ, 673, 143
- Puget et al. (2004) Puget, P. et al. 2004, in SPIE, Vol. 5492, Ground-based Instrumentation for Astronomy. Edited by Alan F. M. Moorwood and Iye Masanori., ed. A. F. M. Moorwood & M. Iye, 978–987
- Quadri et al. (2007) Quadri, R. et al. 2007, AJ, 134, 1103
- Rosati et al. (2009) Rosati, P. et al. 2009, ArXiv:0910.1716
- Seymour et al. (2007) Seymour, N. et al. 2007, ApJS, 171, 353
- Simcoe et al. (2000) Simcoe, R. A., Metzger, M. R., Small, T. A., & Araya, G. 2000, in Bulletin of the American Astronomical Society, Vol. 32, Bulletin of the American Astronomical Society, 758–+
- Stanford et al. (2005) Stanford, S. A. et al. 2005, ApJ, 634, L129
- Stanford et al. (2006) —. 2006, ApJ, 646, L13
- Stern et al. (2003) Stern, D., Holden, B., Stanford, S. A., & Spinrad, H. 2003, AJ, 125, 2759
- Stern et al. (2005) Stern, D. et al. 2005, ApJ, 631, 163
- Stern et al. (2010) —. 2010, Journal of Cosmology and Astro-Particle Physics, 2, 8
- Venemans et al. (2007) Venemans, B. P. et al. 2007, A&A, 461, 823
- Vikhlinin et al. (2009) Vikhlinin, A. et al. 2009, ApJ, 692, 1033
- Wilson et al. (2009) Wilson, G. et al. 2009, ApJ, 698, 1943