Fermi Detection of the Pulsar Wind Nebula HESS J1640465
Abstract
We present observations of HESS J1640465 with the Fermi-LAT. The source is detected with high confidence as an emitter of high-energy gamma-rays. The spectrum lacks any evidence for the characteristic cutoff associated with emission from pulsars, indicating that the emission arises primarily from the pulsar wind nebula. Broadband modeling implies an evolved nebula with a low magnetic field resulting in a high -ray to X-ray flux ratio. The Fermi emission exceeds predictions of the broadband model, and has a steeper spectrum, possibly resulting from a distinct excess of low energy electrons similar to what is inferred for both the Vela X and Crab pulsar wind nebulae.
Subject headings:
ISM: individual (HESS J1640465, 1 FGL J1640.84634, 3EG J16394702, G338.30.0) — pulsars: general — supernova remnants1. Introduction
The basic structure of a pulsar wind nebula (PWN) is determined by the spin-down energy injected by the central pulsar and the interaction of the nebula with the interior regions of the supernova remnant (SNR) in which it evolves. Losses from synchrotron radiation in the nebular magnetic field, whose strength depends both on the nature of the injected wind and on the evolving size of the PWN, inverse-Compton scattering of ambient photons by the energetic electron population within the nebula, and adiabatic expansion as the nebula sweeps up the surrounding supernova ejecta, all combine to determine emission structure and long-term evolution of the nebula. (See Gaensler & Slane 2006 for a review.) Multiwavelength observations of PWNe provide crucial information on the underlying particle spectrum which, in turn, strongly constrains both the magnetic field strength and the stage of evolution. Of particular importance is the spectrum of particles injected into the PWN. While this is typically assumed to be a power law, it has long been known that the spectrum of the Crab Nebula is not fully consistent with such a structure; changes in the spectral index in the optical band seem to indicate inherent features in the injection spectrum, and the large population of radio-emitting particles may have a completely distinct origin from that of the higher energy particles.
Complex structure in the observed spectrum of a PWN can originate in a number of ways that are associated with the long-term evolution, including synchrotron losses and interaction with the SNR reverse shock (Reynolds & Chevalier 1984; Gelfand, Slane, & Zhang 2009). In addition, recent studies of the spectrum immediately downstream of the wind termination shock show that, at least in some cases, the injection spectrum itself deviates significantly from a simple power law (Slane et al. 2008), and particle-in-cell simulations of the acceleration process produce spectra that are well-described by a Maxwellian population with a power law tail (Spitkovsky 2008). Any such structure in the spectrum of the injected particles imprints itself on the broadband emission spectrum of the entire nebula. The resulting breaks or regions of curvature in the emission spectrum, and the frequencies at which they are observed, depend upon the energy at which features appear in the electron spectrum as well as the means by which the photons are produced (e.g. synchrotron radiation or inverse-Compton emission). To fully understand the nature of the particle injection, as well as the long-term evolution of PWNe, it is thus crucial to study the emission structure over the entire electromagnetic spectrum.
Gamma-ray observations have provided an important window into the late-phase structure of PWNe. While the X-ray emission from older PWNe is relatively weak due to the long-term decline in magnetic field strength, inverse-Compton scattering of the cosmic microwave background (CMB), as well as other ambient photons, by the energetic particles in the nebula produce very energetic photons, providing unique discovery space for these systems. Even in younger nebulae, the -ray emission provides a crucial probe of the particle spectrum in energy regions that are not accessible with other observations. The inverse-Compton emission from photons with a characteristic temperature peaks at an energy for scattering from electrons of energy . CMB photons scattered into the bandpass of the Fermi Large Area Telescope (LAT), for example, originate from interactions with electrons in the approximate energy range 0.25 – 4 TeV. Such particles produce synchrotron radiation with photon energies in the range eV, where is the magnetic field strength in units of 10G. Depending on the magnetic field, which can range from G or higher for young PWNe, down to G for highly evolved systems, the synchrotron emission from particles in this energy range can be difficult to detect due to instrumentation limitations (at long radio wavelengths), absorption (in the optical/UV range) or confusion with the bright sky Galactic background (in the infrared). Fermi measurements can thus provide a unique probe of the emission from a significant population of the particle spectrum in PWNe.
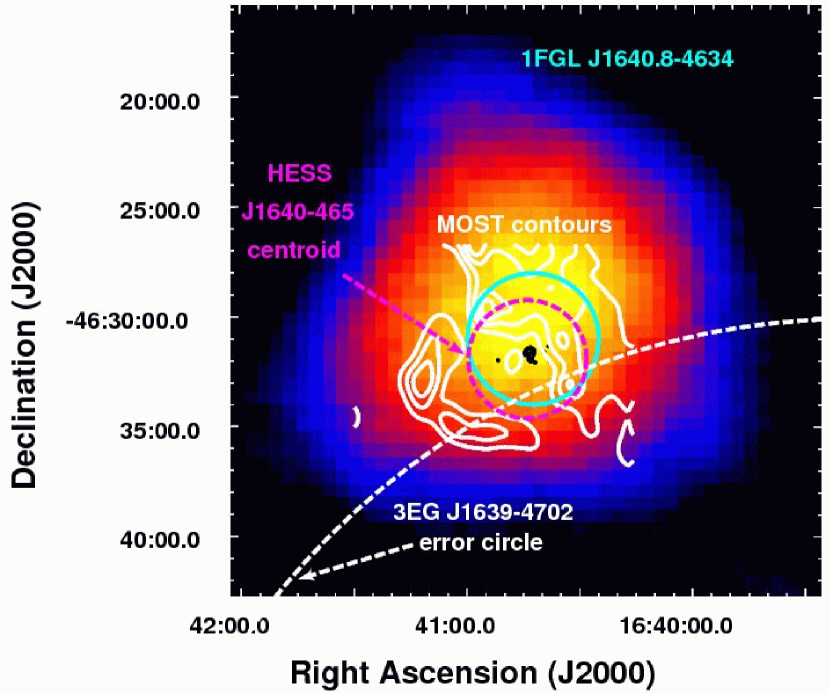
HESS J1640465 (see Figure 1) is an extended source of very high energy -ray emission discovered with the High Energy Stereoscopic System (H.E.S.S.) during a survey of the Galactic plane (Aharonian et al. 2006). Centered within the radio SNR G338.30.0 (Shaver & Goss 1970), the deconvolved TeV image of the source has an RMS width of arcmin (Funk et al. 2007). HI measurements show absorption against G338.30.0 out to velocities corresponding to the tangent point, indicating a distance of at least 8 kpc (Lemiere et al. 2009), and thus implying a rather large size for the PWN ( pc, where is the distance in units of 10 kpc). X-ray observations with XMM (Funk et al. 2007) and Chandra (Lemiere et al. 2009) establish the presence of an accompanying X-ray nebula and an X-ray point source that appears to be the associated neutron star. In addition, Aharonian et al. (2006) noted the presence of the unidentified EGRET source 3EG J16394702 located at a nominal position 34′ from HESS J1640465, but the very large error circle on its position made any association with HESS J1640465 highly uncertain. Here we report on observations of HESS J1640465 with the Fermi-LAT. The observations and data analysis are summarized in Section 2, and a discussion of the observed -ray emission is discussed in the context of the evolutionary state of HESS J1640465 in Section 3. Our conclusions are summarized in Section 4.
2. Observations and Data Analysis
We investigated -ray events acquired from the region surrounding HESS J1640465 with the Fermi-LAT during the period 2008 August 5 to 2009 November 13. Standard event selection was applied, using the “diffuse” class as defined in Atwood et al. (2009), using events with zenith angles less than 105 degrees to minimize the portion of the Earth limb in the LAT field-of-view (Abdo et al. 2009a). The “Pass6 version 3” instrument response functions were used. Standard analysis tools available from the Fermi Science Support Center (version v9r15p2) were used for the reduction and analysis. In this work, the mapcube file gll_iem_v02.fit is used to describe the Galactic -ray emission, and the isotropic component is modeled using the isotropic_iem_v02.txt table. Data analysis details follow those in Castro & Slane (2010).
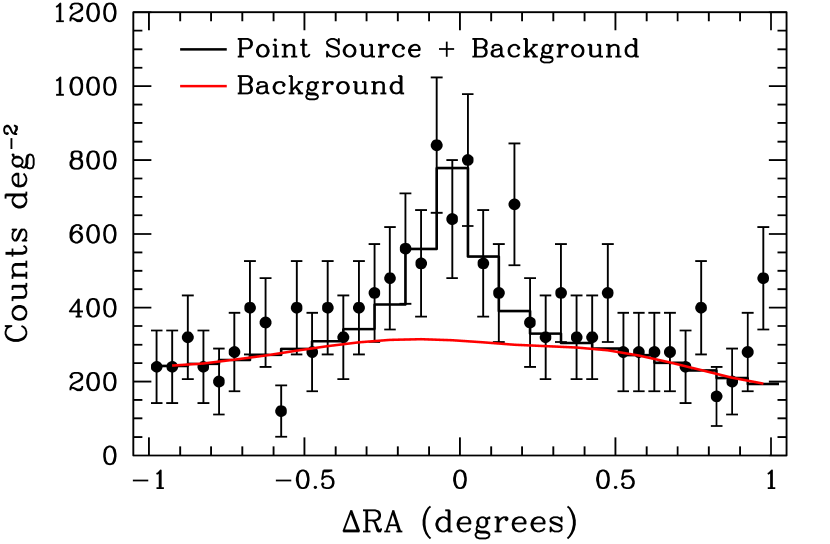
For source detection and spatial analysis of the source, we used only events with energies in the range 2 - 200 GeV converting in the front section of the tracker, where the Point Spread Function (PSF) is narrower. At 2 GeV, the 68% containment radius of the PSF is approximately 18 arcmin, which is considerably larger than the source of interest. Based on an unbinned maximum likelihood analysis, using the gtlike routine, a LAT source coincident with HESS J1640465 is detected with a significance of based on the TS statistic (Mattox et al. 1996). The counts map is shown in Figure 1, along with the uncertainty in the centroid position based on our analysis (cyan circle). We have also included the HESS error circle (magenta) and contours from the XMM observation of HESS J1640465 (black) and the MOST observation of G338.30.0(white contours). The error circle for 3EG J16394702 is indicated by a dashed white circle.111EGRET position contours are not necessarily circular; the radius of the contour shown, from Hartman et al. (1999), contains the same solid angle as the formal 95% contour. The centroid of the LAT emission is located at , , in good agreement with the position of HESS J1640465, and the brightness distribution is consistent with an unresolved source (Figure 2); models for a disk of extent between degrees significantly degrade the quality of the fit, providing strong evidence for an unresolved source.
The source spectrum was extracted using both front and back events, and covering the energy range GeV. Standard background models were used to account for both Galactic and extragalactic diffuse emission as well as instrumental background. Contributions from field sources identified in the one-year Fermi-LAT First Source Catalog (Abdo et al. 2010a) were included in the analysis. The LAT spectrum for HESS J1640465 is shown in Figure 3, and is well-described by a power law with and a [or in the GeV band] based on spectral fits for which statistical error and systematic errors associated with uncertainties in the Galactic background level (estimated by artificially changing the Galactic background normalization by – see Abdo et al. 2009b) are added in quadrature.
We note that Fermi observations of pulsars reveal spectra with distinct cutoffs above GeV (e.g. Abdo et al. 2009). The absence of such a cutoff in Figure 3 implies that that the bulk of the emission does not arise directly from an unseen pulsar in HESS J1640465. Our fits imply a lower limit of 40 GeV (at the 90% confidence level) for any exponential cutoff energy in the spectrum. Joint fits with the HESS spectrum are also well-described by a power law. Addition of a second power law, with an exponential cutoff, does not improve the fit. Such a fit can, however, accommodate of the observed flux in the second power law for cutoff energies between GeV (beyond which such a component is statistically disfavored).

The source 1FGL J1640.84634, from the one-year catalog, is coincident with the source we detect, and the quoted flux is in agreement with our measurements as well. The flux of the source is consistent with that of 3EG J16394702; the spectral index is somewhat flatter, though also consistent within the uncertainties.
3. Discussion
The evolutionary state of a composite supernova remnant system is strongly constrained by the observed size of the SNR and the inferred spin-down properties of the associated pulsar. Radio observations establish a radius pc for G338.30.0. The observed extent of HESS J1640465 constrains the radius of the PWN to pc.222Here, and throughout, refers to the distance from the SNR center to the outer edge of its blast wave, while refers to the distance from the pulsar to the outer boundary of its wind nebula. For evolution in the Sedov phase, the SNR radius is
| (1) |
where is the supernova explosion energy in units of erg, is the number density of the ambient medium, and is the SNR age in kyr. The evolution of the PWN radius through the SNR ejecta is given by (Chevalier 1977)
| (2) |
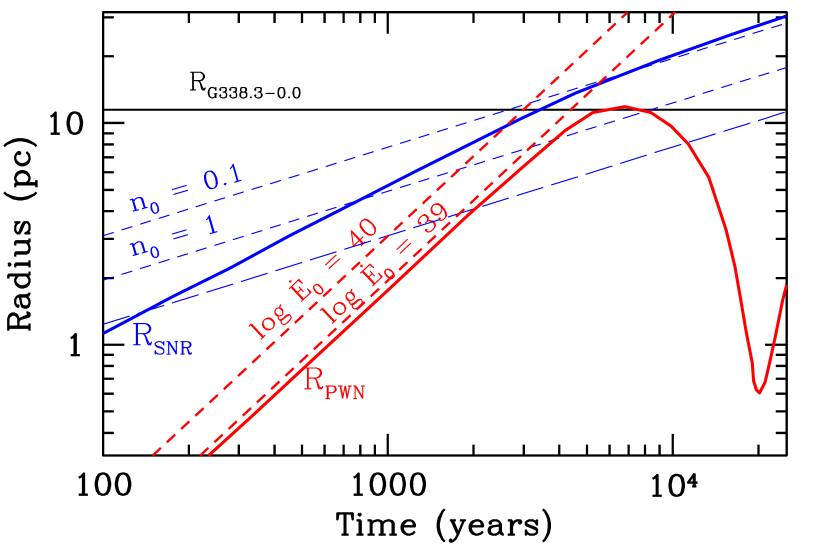
where is the initial spin-down power in units of and is the ejecta mass in units of . Figure 4 illustrates the evolution of the SNR and PWN radii under such assumptions for a range of values for the ambient density and initial spin-down power, assuming an ejecta mass of and . For the observed radius of G338.30.0, we see that the age must be around kyr for reasonable ambient conditions. The PWN has ideally expanded to a larger radius by this time, which means that under real conditions the SNR reverse shock has already encountered and disrupted the PWN. This is illustrated in Figure 4 where the solid blue and red curves show the SNR and PWN radii (respectively) as a function of time for the model shown in Gelfand et al. (2009) with , , , and . Here the early SNR evolution is calculated using the solution from Truelove & McKee (1999), and the SNR and PWN evolution is treated self-consistently. The SNR curve initially rises more quickly than the dashed blue curves, which assume a Sedov solution from the onset, but approaches the Sedov solution at later times. The solid red curve shows a distinct reduction in the radius of the PWN upon compression by the SNR reverse shock. Such a reverse shock interaction is consistent with both the inferred size of HESS J1640465 and with the observed offset between the putative pulsar and the surrounding nebula (Funk et al. 2007, Lemiere et al. 2009).
A full exploration of the parameter space constrained by both the spatial and spectral properties of HESS J1640465 and G338.30.0 is beyond the scope of this initial investigation. Here we have modeled the PWN emission following the description in Lemiere et al. (2009). A simple power law injection of particles from the pulsar into a 1-zone nebula is assumed, and radiative losses are assumed to be dominated by synchrotron radiation.333This assumption is valid for magnetic fields larger than G, which is typically the case in PWNe. We note, however, that at late times (ages of order 10 kyr, as suggested for HESS J1640465), when the magnetic field decreases due to expansion, IC losses can begin to be significant. The time evolution of the pulsar spin-down is determined by
| (3) |
where is a characteristic spin-down timescale for the pulsar and is the pulsar braking index. Pulsations from the putative pulsar have not yet been detected. To estimate the current spindown power, we use the empirical relationship for obtained by Possenti et al. (2002), which yields . Based on the observed scatter in the , the uncertainty on this estimated value may be a factor of 10 or larger. The maximum particle energy is assumed to be limited by the condition that the particle gyroradii do not exceed the termination shock radius (de Jager & Harding 1992). The lower limit on the particle energy is a free parameter, and the overall normalization is set by the wind magnetization parameter , equal to the ratio of power in particles to that in the Poynting flux. The magnetic field in the nebula is assumed to evolve as
| (4) |
where is a free parameter.
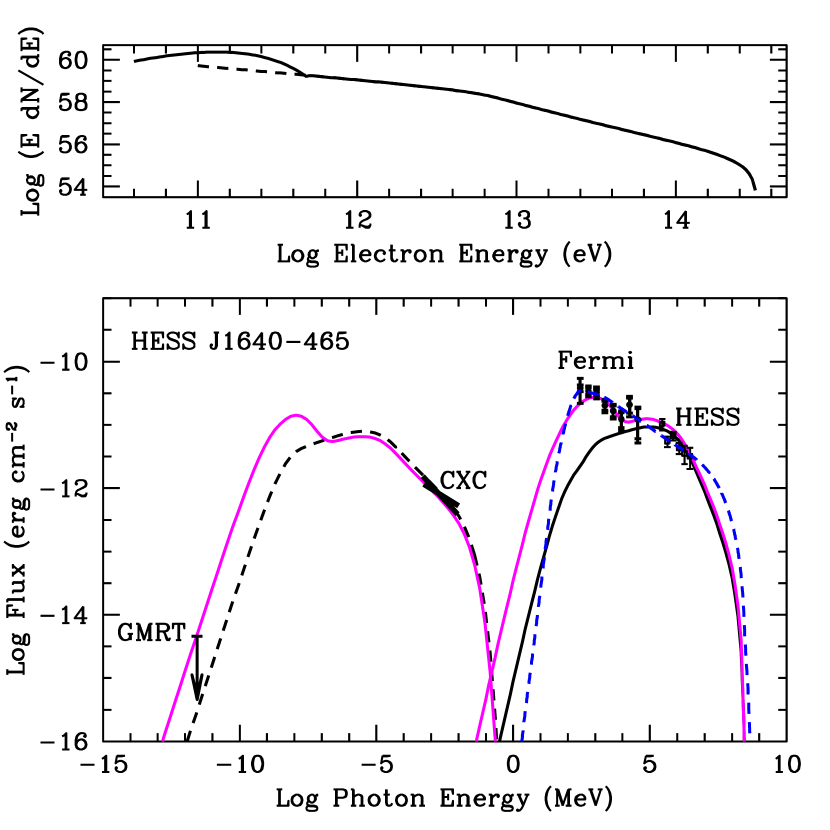
The broadband emission model results are shown in Figure 5 where we plot the Fermi and H.E.S.S spectra along with the radio upper limit from GMRT observations (Giacani et al. 2008) and spectral confidence bands derived from Chandra (Lemiere et al. 2009). The black curves represent the model prediction for the synchrotron (left) and inverse-Compton (right) emission that best describes the X-ray and TeV -ray spectra, similar to results from Lemiere et al. (2009); the parameters for the model, which were adjusted “by hand” to provide good agreement with the radio, X-ray, and TeV -ray data, as well as the inferred size of the PWN, are summarized in the caption. As seen in Figure 5, this model significantly underpredicts the observed Fermi-LAT emission.
As discussed above, our spectral fits can formally accommodate up to about of the observed flux in a pulsar-like component characterized by a power law with an exponential cutoff energy between 1 and 8 GeV. This corresponds to an energy flux (above 100 MeV) of . For the spin-down power suggested by its X-ray luminosity, the available energy flux from the pulsar that powers HESS J1640465 is . Thus, as much as 10% of its spin-down could conceivably be contributing directly to -rays in the LAT band. There are known radio pulsars within the field of 1FGL J1640.84634 as well. PSR J16374642, for example, is located within arcmin and has a total energy flux of given its estimated distance and measured spin-down. Thus, while our spectral fits do not require a pulsar-like component, it it quite feasible that one or more of these sources contributes as much as 20% of the observed flux. Inspection of Figure 5 makes it clear, however, that the remaining LAT emission still vastly exceeds the predicted flux from HESS J1640465.
We note that simple power-law injection models for Vela X, another evolved PWN, fail to reproduce the observed broadband spectrum (LaMassa, Slane, & de Jager 2009). The presence of an excess population of low-energy electrons has been suggested, and models for the inverse-Compton scattering of photons from this population predict an excess of -rays in the GeV range (de Jager, Slane, & LaMassa 2009). This excess has been confirmed with observations by both AGILE (Pellizzoni et al. 2010) and Fermi (Abdo et al. 2010b). Motivated by this result, we modified the evolved power law spectrum from our model for HESS J1640465 by truncating the lower end of the power law and adding a distinct low-energy component. Based on results from simulations of shock acceleration (Spitkovsky 2008), we chose a Maxwellian distribution for this population. Our resulting (ad hoc) particle spectrum is shown in the upper panel in Figure 5, and the resulting broadband emission is shown in the magenta curves in the lower panel. Here we have adjusted the normalization of the Maxwellian to reproduce the emission in the Fermi-LAT band, which is produced primarily by upscattered infrared (IR) photons from local dust. The energy density and mean temperature of the IR photon field was adjusted slightly to improve the agreement between the data and the model, but the values (listed in the caption) are within reasonable expectations (see, e.g., Strong et al. 2000). We find a mean value of for the electrons in the Maxwellian component, and roughly 5% of the total electron energy in the power law tail, consistent with results from particle-in-cell simulations.444A. Spitkovsky, private communication. The associated pair multiplicity relative to the integrated Goldreich-Julian injection rate is of order , similar to that inferred for the Crab Nebula as well as several other PWNe (see Bucciantini et al. 2010). Recent work by Fang & Zhang (2010) uses a similar input distribution to successfully model the emission for several PWNe including HESS J1640465. However, their results for HESS J1640465 underpredict the observed GeV emission from this source, apparently due to use of a slightly lower bulk Lorentz factor and a larger fraction of the total energy in the power law tail than we have used in this analysis.
We note that the Maxwellian shape for the low-energy electron population is not unique. Indeed even a very narrow Gaussian distribution can produce the GeV -ray emission without exceeding the radio upper limit for the synchrotron emission. For any of these models, the total energy in electrons requires a larger initial spin-down period than assumed for the simple power-law injection models – by a factor of roughly 3 for the adopted Maxwellian distribution. This is within the uncertainty in our assumed value based on scaling from the X-ray luminosity of the PWN. It is also important to note that while our proposed model is consistent with the observed properties of this system, there are potential degeneracies in the effects of different model parameters, meaning that the proposed scenario is not necessarily unique.
An alternative scenario for the -ray emission is that it arises from the SNR itself, and not the PWN. Nonthermal bremsstrahlung has been suggested as a mechanism for the production of -rays in SNRs (e.g. Bykov et al. 2000). This process can be dominant for electron-to-proton ratios of order 1. However, the value typical of local cosmic rays is closer to , and even smaller values appear favored in models for -ray emission from SNRs (e.g. Morlino et al. 2009, Zirakashvili & Aharonian 2010, Ellison et al. 2010), so that this process is typically not dominant. The dashed blue curve in Figure 5 represents a model for the emission from the collision of protons accelerated in the SNR with ambient material, leading to -rays from the production and subsequent decay of neutral pions. The -ray spectrum is calculated based on Kamae et al. (2006) using a scaling factor of 1.85 for helium and heavy nuclei (Mori 2009), and we have used a power law distribution of protons with to best reproduce the observed spectrum. Assuming a shock compression ratio of 4 and that 25% of the total supernova energy appears in the form of relativistic protons, an ambient density is required to produce the model shown in Figure 5. This is much higher than can be accommodated for the observed size of the SNR and the lack of observed thermal X-ray emission from the SNR. Such high densities are found in dense molecular clouds, suggesting that the -rays could be produced by particles that stream away to interact with high-density material outside the SNR. However, only the most energetic particles can escape the acceleration region, which is in conflict with the proton spectrum we require to match the data. Moreover, the observed TeV emission appears to originate from within the SNR boundaries, making such an escaping-particle scenario appear problematic. Based on this, along with the lack of a spectral cutoff that might suggest emission from a central pulsar, we conclude that the GeV -ray emission most likely arises from the PWN.
It is well-known that a distinct low-energy electron population resides in the Crab Nebula, although the origin is not well-understood. Atoyan (1999) has suggested that the spin-down timescale (see Equation 1) may itself be time-dependent, resulting in a large energy input in the earliest epoch of pulsar spin-down, when significant synchrotron and adiabatic losses would result in rapid cooling of the electrons. Studies of the broadband emission from 3C 58 indicate an injection spectrum that differs from a pure power law as well (Slane et al. 2008). As noted above, observations of Vela X appear to require an excess of low-energy electrons which may be a relic population or could have been produced through rapid synchrotron losses associated with the increased magnetic field strength during the reverse-shock crushing stage. More complete modeling of the broadband emission of HESS J1640465, accounting for the full dynamical evolution of the system, including the effects of the reverse shock on the PWN, is required to assess the overall energetics and underlying particle spectrum more completely, but is beyond the scope of the results we report here.
4. Conclusions
Broadband studies of HESS J1640465 have identified this source as a likely PWN, with X-ray observations providing images of an extended nebula as well as the putative pulsar powering the system. Modeling of the PWN evolution based on inferred parameters of the pulsar imply detectable emission in the GeV -ray band, and our investigations of the Fermi-LAT observations of this region reveal clear evidence of such emission, consistent with the source 1FGL J1640.84634. The flux and spectrum we derive are consistent with that of the previously-identified source 3EG J16394702, and the much-improved position makes it likely that the emission arises from HESS J1640465. The lack of a spectral cutoff rules out an association with emission directly from the pulsar that powers the nebula, and the flux is inconsistent with -rays from G338.30.0, in which HESS J1640465 resides.
We have investigated the radio, X-ray, and -ray emission from HESS J1640465 in the context of a simple one-zone model in which power is injected into a nebula at a time-dependent rate consistent with the current observed X-ray emission from the system. We find that models constrained by the observed size of the associated SNR, as well as limits on the size of the PWN, require an approximate age of 10 kyr and a current magnetic field strength of only G, consistent with expectations for the late-phase evolution of a PWN. The conditions in such an evolved PWN yield a considerably higher -ray flux, relative to the X-ray flux, than in younger systems where the higher magnetic field results in significant synchrotron radiation.
The observed Fermi-LAT emission from HESS J1640465 significantly exceeds that predicted by our broadband models. We propose that the excess emission is a signature of a distinct population of low-energy electrons similar to that inferred from studies of the Crab Nebula and Vela X, although the nature of this electron component is not well constrained. Deeper radio observations are needed to place stronger constraints on this population. Sensitive searches for pulsations from the central pulsar are of particular importance to constrain the spin-down properties of the system, which can only be very roughly constrained at present. There has been considerable success in identifying such pulsars with the Fermi-LAT, but the lack of an obvious pulsar-like spectrum in HESS J1640465 may argue for more likely success with deep radio timing searches.
References
- Abdo et al. (2009a) Abdo, A. A., et al. (Fermi LAT Collaboration) 2009a, ApJ, 706, 1331
- Abdo et al. (2009b) Abdo, A. A., et al. (Fermi LAT Collaboration) 2009b, ApJ, 706, L1
- Abdo et al. (2010) Abdo, A. A., et al. (Fermi LAT Collaboration) 2010a, ApJS, submitted.
- Abdo et al. (2010) Abdo, A. A., et al. (Fermi LAT Collaboration) 2010b, ApJ, 713, 146.
- Atoyan (1999) Atoyan, A. M., et al. 1999, A&A, 346 L49
- Aharonian et al. (2006) Aharonian, F. A. et al. (H.E.S.S. Collaboration) 2006, A&A, 636, 777
- Atwood et al. (2009) Atwood, W. B., et al. 2009, ApJ, 697, 1071
- Bucciantini et al. (2010) Bucciantini, N., Arons, J, & Amato, E. 2010, MNRAS, in press
- Bykov et al. (2000) Bykov, A. M. et al. 2000, ApJ, 538, 203
- Castro and Slane (2010) Castro, D. & Slane, P. 2010, ApJ, submitted (arXiv:1002.2738)
- Chevalier (1977) Chevalier, R. A. 1977, in Astrophysics and Space Science Library, Vol. 66, Supernovae, ed. D. N. Schramm, 53
- de Jager & Harding (1992) De Jager, O. C. & Harding, A. K. 1992, ApJ, 305, 161
- de Jager, Slane, & LaMassa (2009) De Jager, O. C., Slane P., & LaMassa, S. M. 2009, ApJ
- Ellison et al. (2010) Ellison, D. C. et al. 2010, ApJ, 712, 287
- Fang and Zhang (2010) Fang, J. & Zhang, L. 2010, A&A, in press (arXiv:1003.1656)
- Funk et al. (2007) Funk, S., et al. 2007, ApJ, 267, 517
- Gaensler & Slane (2006) Gaensler, B. M. & Slane, P. 2006, ARAA, 44, 17
- Gelfand, Slane, & Zhang (2009) Gelfand, J. D., Slane, P. O, & Zhang, W. 2009, ApJ, 703, 2051
- Giacani et al. (2008) Giacani, E. et al. 2008, AIPC, 1085, 234
- Hartman et al. (1999) Hartman, R.C. et al. 1999, ApJS, 123, 79
- Kamae et al. (2006) Kamae, T. et al. 2006, ApJ, 647, 692
- LaMassa, Slane, & de Jager (2009) LaMassa, S. M., Slane, P., & De Jager, O. C. 2009, ApJ
- Lemiere et al. (2009) Lemiere, A., Slane, P., Gaensler, B. M., & Murray, S. 2009, ApJ, 706, 1269
- Mattox et al. (1996) Mattox, J. R., et al. 1996, ApJ, 461, 396
- Mori (2009) Mori, M. 2009, Astropart. Phys., 31, 341
- Morlino et al (2009) Morlino, G., Amato, E., & Blasi, P. 2009, MNRAS, 392, 240
- Pellizzoni et al. (2010) Pellizzoni, A., et al. 2010, Sci, 327, 663
- Possenti et al. (2002) Possenti, A., Cerutti, R., Colpi, M., & Mereghetti, S. 2002, A&A, 387, 993
- Reynolds & Chevalier (1984) Reynolds, S. P., & Chevalier, R. A. 1984, ApJ, 278, 630
- Shaver & Goss (1970) Shaver, P. A. & Goss, W. M. 1970, AuJPA, 14, 133
- Slane et al. (2008) Slane, P., et al. 2008, ApJ, 676, L33
- Spitkovsky (2008) Spitkovsky, A. 2008, ApJ, 682, L5
- Strong et al. (2000) Strong, A. W., Moskalenko, I. V., & Reimer, O. 2000, ApJ, 537, 763
- Truelove & McKee (1999) Truelove, J. K. & McKee, C. F. 1999, ApJS, 120, 299
- Zirakashvili and Aharonian (2010) Zirakashvili, V. N. & Aharonian, F. A. 2010, ApJ, 708, 965