A Top-down Model for Cash CLO
Abstract
We propose a top-down model for cash CLO. This model can consistently price cash CLO tranches both within the same deal and across different deals. Meaningful risk measures for cash CLO tranches can also be defined and computed. This method is self-consistent, easy to implement and computationally efficient. It has the potential to bring much pricing transparency to the cash CLO markets; and it could also greatly improve the risk management of cash instruments.
1 Introduction
Throughout the credit crisis since 2007, cash structured finance instruments such as cash CDO, CLO, MBS and CMBS have suffered much larger losses and write-downs than the synthetic instruments such as synthetic CDO/CLOs. The cause of the disparity in losses is mainly due to the difference in their risk management practices. In the synthetic CDO/CLO market, the market participants are much more accustomed to hedging the market risks via credit indices, index tranches and single name CDS/LCDS contracts. The base correlation model is the market standard model for the synthetic CDO/CLOs, which have played a key role in the risk management of synthetic CDO/CLOs. Having a market standard model like base correlation has nurtured and encouraged proper and sophisticated risk management practice across both investors and market makers in the synthetic market. In comparison, the risk management in the cash CDO/CLO market is much less sophisticated, which is mainly due to the limited availability of hedging instruments as well as the lack of a standard risk-neutral model. The model development for cash instruments has lagged far behind comparing to the modeling capabilities of the synthetic CDO/CLOs. The modeling efforts of cash instruments have been mostly focused on the cashflow modeling, and there are few attempts to price cash CDO/CLOs under the proper risk-neutral framework. Risk management of cash instruments without a proper risk-neutral model is inevitably difficult.
In this paper, we present a simple and practical risk-neutral model for cash CLO (Collateralized loan obligation), which is one of the most important type of cash CDOs. The total outstanding notional amount of cash CLO assets has grown to over $400B in 2007 right before the credit crisis. The same methodology can also be applied to other types of cash CDOs. The proposed methodology brings the modeling capability of cash instruments much closer to the modeling capability of the synthetic instruments.
This paper is organized as follows, we first give a brief overview of the important differences between the cash and synthetic CLO markets in section 2, then we review the existing pricing method for cash CLOs and its limitations in section 3. In section 4, we introduce the top-down method for CLOs. In the rest of this paper, the unqualified term “CLO” always refers to the cash CLO, while the “synthetic CLO” is always fully qualified to avoid confusion.
2 Cash vs. Synthetic CLO
A cash CLO and a synthetic CLO share very little in common besides their names. A cash CLO deal is usually managed by a manager who can actively trade and hedge the underlying loan portfolio, while a synthetic CLO usually trades in single tranche format referencing a static portfolio. A cash CLO often has complex cashflow waterfall structure so that the cashflow of its tranches are highly path-dependent, while the cashflows of synthetic CLO tranche are very simple and not path-dependent. The cash CLO typically attracts institutional buy-and-hold investors whose investment decisions are mainly based on ratings and yields, while the synthetic CLO index (i.e.: the LCDX) and tranches are mostly traded by the correlation desks of hedge funds and banks who are required to mark their positions to the market.
The market dynamics are totally different between the cash and synthetic CLO. In the synthetic CLO market, the participants can easily take long or short positions in the credit indices (e.g. LCDX), index tranches and the underlying single name LCDS, therefore there are strong arbitrage relationships among them. It is easy to construct a profitable basis trade if any of the basis becomes very large. The basis between indices, tranches or single names in the synthetic market therefore tends to stay within a reasonable range. It is important for a synthetic CDO model to maintain the consistency between the tranches and its underlying portfolio because of this strong arbitrage relationship. The cashflows of synthetic CLO tranches are very simple and not path-dependent; therefore it is not only necessary but also feasible to model synthetic CLOs as derivatives of the underlying LCDS contracts. This approach is commonly called “bottom-up” because the model drills down to the individual constituents in the collateral portfolio. Base correlation is the most common synthetic CDO/CLOs model in practice, readers are referred to O’Kane and Livesey (2004) for a description of the base correlation model. By modeling the synthetic CDO/CLO tranches as derivatives of the underlying CDS/LCDS, the total protection value of the tranches automatically adds up to the total protection value of the underlying CDS/LCDS.
In contrast, the cash CLOs behave very differently. A cash CLO is very similar to a regular company as it has a manager, some assets (the loan collateral) that are funded with various classes of debt (tranches) and equity (tranche). Unlike the synthetic market, it is almost impossible to construct a basis trade for cash CLOs even if there exists large basis between the market value of CLO assets (underlying collateral loans) and CLO liabilities (including tranches, management fees and other expenses). There are several reasons for this: 1) cash CLO managers typically only report the underlying loan positions once a month, thus the exact loan positions are unknown between reports since the manager may trade the underlying loans at any time 2) the individual loans are often illiquid and rarely traded 3) taking short positions in underlying loans or cash CLO tranches is very difficult in the cash market. Therefore the basis trades for cash CLOs have rarely (if ever) been attempted in practice. As a result, there is no market force that brings the values of cash CLO assets and liabilities together quickly. The values of a cash CLO’s assets and liabilities can diverge significantly for an extended time even though they eventually have to converge111At the maturity of the CLO deal to the latest since all the loans will either mature or liquidate at maturity.. The cash CLO tranches and the underlying loans can behave like unrelated instruments in short term even though the cashflows of cash CLO tranches are derived from the cashflows of the underlying loans. It is not uncommon for the underlying loan prices and the cash CLO tranche prices to move in opposite direction during the same trading session.
The cash CLO market dynamics therefore impose certain practical restrictions on the hedging strategies of cash CLO tranches:
-
1.
It is impractical and almost useless to hedge cash CLO tranches by trading individual loans.
-
2.
It could be feasible and cost effective to macro hedge the overall market movements of the underlying loans using instruments such as TRS or LCDX index. The macro-hedges may not work well if the basis between CLO tranches and the underlying loan changes significantly, therefore one must have a view on the basis before putting on a macro hedge.
-
3.
Even though the synthetic LCDX tranches were originally created to hedge the cash CLO tranches, the historical price movements of cash CLO tranches and synthetic LCDX tranches have shown very little correlation due to the fundamental differences in market dynamics. Therefore, the LCDX tranches have been very poor hedging instruments for the cash CLO tranches despite its original intention.
These practical hedging restrictions are important considerations when building a cash CLO model.
3 Review of Cash CLO Pricing Method
Even though the cash CLO tranches trade in the upfront price format just like ordinary corporate bonds, a more structured quoting/pricing convention is required for cash CLO investors to compare relative values among different cash CLO tranches. The current market standard for quoting and pricing cash CLO tranches is based on a single pricing scenario where the overall underlying loan collateral is assumed to have a constant annualized default rate (CADR), constant annualized prepayment rate (CAPR), and a constant recovery rate (CRR) over the whole life of the CLO. The CADR of the single pricing scenario is usually very low, for example 3% CADR is often used. The CLO tranche cashflows from this single pricing scenario of CADR, CAPR and CRR are then discounted using the riskfree rate plus a discount margin (DM) spread to produce the tranche PVs. Different DMs are required for different tranches to re-produce their market prices from the single pricing scenario.
Intex222A product of Intex Solutions, http://www.intex.com is a standard software package used by most market participants to compute the cashflows from CLO tranches. Intex has modeled the majority of outstanding cash CLO deals in the market and it can compute the cashflows of (almost) any CLO tranches under any CADR, CAPR and CRR scenarios. The wide adoption of Intex tool is important for the transparency of the cash CLO market because it provides a consensus on the CLO tranche cashflow among market participants. Different market participants thus can reach the same conversion between the DM and CLO tranche prices as long as they all use Intex for the cashflow calculation. The implied DM from the market tranche prices can then be used by the investors to compare the relative values of different cash CLO tranches. We can view the DM as a similar measure as the credit spreads for corporate bonds: the higher the DM, the more likely the cashflow from the single low-CADR pricing scenario would not be paid due to the increase in loan default rates.
The cash CLO market makers often maintain a matrix of DMs based on recent market transactions of various ratings, vintages and deal types; and the DM matrix is used to price similar cash CLO tranches whose prices are not observable in the market. Due to the lack of liquidity, the DM matrix is only updated infrequently, often once a month. This DM method is widely used because of its simplicity, but it is really a quoting convention rather than a pricing model. The following is a list of limitations of the DM method:
-
1.
Some important cash CLO structural features, such as IC/OC triggers, are not priced in since they are not relevant under the single low-CADR pricing scenario. However in reality, these features provide valuable protection to the senior and mezzanine tranches under the high default rate environment, therefore they should affect CLO tranche pricing.
-
2.
There is no pricing consistency across different tranches of the same cash CLO deal since their cashflows are discounted by different DMs. There is no concept of correlation of loan defaults and value shift between different parts of the CLO capital structure.
-
3.
The collateral loan prices do not enter the cash CLO tranche pricing at all. Even though the values of cash CLO assets and liabilities do not necessarily move together as discussed in section 2, the underlying loan prices is a key piece of information for comparing the relative values between different cash CLO deals since it reflects the expected loan default rates.
-
4.
There is no meaningful risk measures from the DM method as the only risk factor of a cash CLO tranche is its DM by construction, which does not provide any useful guidance for risk management and hedging. Simple questions like: “how much a cash CLO tranche price would change if the underlying loan prices move by 1 point?” cannot be answered.
-
5.
The DM matrix is usually hand marked by the trading desk, who can also adjust the DM of individual deals in the book. There is very little control in place on how a DM can be marked due to the illiquid nature of the cash CLO market. Often the tranches from certain CLO types and vintages do not transact in the market for weeks (or even months). The DM marks and the resulting CLO tranche prices often lack consistency and transparency; and they are easy targets for mis-marks and manipulations.
A new modeling paradigm is therefore urgently needed for the cash CLO market. In this paper, we propose a top-down model for CLO that addresses all the limitations above.
4 A Top-down Cash CLO Model
It is more difficult to construct proper models for cash CLOs than for synthetic CLOs due to the opaqueness of the underlying collateral and the complex cashflow waterfall features. There have been prior attempts to price cash CLOs tranches by computing their cashflows from a Monte Carlo simulation of the default times and recovery rates of underlying loans. The default time and recovery simulation could be driven by a default time copula (e.g.: Gaussian Copula). This bottom-up approach achieved little success because of the uncertainties in the underlying loan positions and prices, as well as the prohibitive computational cost to obtain the tranche cashflows from a large number of simulated scenarios. Custom implementations of the cash CLO’s cashflow waterfalls are often required to achieve reasonable simulation speeds as the standard Intex tool may not be fast enough to support a large number of simulated scenarios. In our view, it is not only a costly, but also an almost useless exercise to build a bottom-up cash CLO model in practice. The main benefit of a bottom-up model is the ability to produce risks to individual underlying loans, but it is not feasible to hedge cash CLO tranches by trading individual underlying loans anyway (as discussed in section 2).
Recognizing the drawbacks of the current DM based method and the practical hedging restrictions in the cash CLO market, we hereby propose a simple but practical top-down model for cash CLO. Top-down models were originally developed for exotic synthetic instruments. In a top-down model, the collateral portfolio is modeled as a whole instead of drilling down to individual constituents. The benefit of a top-down approach is its simplicity as a result of not having to model the individual constituents of the underlying portfolio. The adoption of top-down models in synthetic CDO/CLOs has been limited so far because the prices of synthetic tranches do move with its underlying CDS/LCDS due to the strong arbitrage relationship. Ignoring the single name risk is considered a drawback for synthetic instruments since it is critical to hedge synthetic tranches by trading the underlying single name CDS/LCDS contracts.
However, a top-down approach is ideal for cash CLOs since there is no strong arbitrage relationship between the CLO assets and liabilities in the cash market, and the cash CLO tranche prices do not necessarily move consistently with individual underlying loans. Therefore, ignoring the individual single name information, being a vice in the synthetic CLOs modeling, becomes a virtue in the cash CLO modeling because it is closer to the market reality and it greatly simplifies the model setup. Note that a top-down model can produce risk measures to the overall average loan price in the cash CLO portfolio, thus it is possible to macro-hedge the overall loan price movements using a top-down model. It is just not possible to produce hedge ratios to the individual loans with a top-down approach, which is useless in practice anyway.
4.1 Calibrate to “Index” CLO
Fundamentally, the objective of a pricing model is to find the prices of less liquid instruments from the prices of liquid instruments. For example, when pricing a bespoke synthetic CDO using the base correlation model, we first extracts the correlation information from the liquid index tranches by calibrating a base correlation surface, which is then mapped to the bespoke portfolios to produce the bespoke tranche prices. The pricing consistency among different bespoke tranches are maintained because all of them are priced from the same set of liquid index tranches. This procedure allows us to compute risk sensitivities of bespoke tranches to the liquid index tranches; and we can hedge the illiquid bespoke tranches by trading the liquid index tranches.
Given the success of synthetic CDO/CLO models, it is a natural idea trying to apply the same pricing method to cash CLOs. However, a practical challenge is that there is no standard liquid index for cash CLOs. As discussed before, the LCDX tranches can’t be used to price cash CLOs because of the fundamental differences between the cash and synthetic markets. To get around this, we have to assume that there is a representative cash CLO deal whose market price is somewhat transparent, which can be used as an “index” to price other cash CLO deals. In practice, cash CLO market participants can choose a representative CLO that are reasonably liquid as the CLO “index”. Once we identified a cash CLO index and its tranche prices, we then can carry out the calibration and mapping procedure for cash CLOs in a similar manner as in the synthetic CLO models. Figure 1 showed the deal information and tranche prices of an actual cash CLO deal, whose price marks are provided by the Lehman CLO trading desk as of Aug. 12, 2008. We will use this CLO deal as the “index” for the following discussion. This “index” deal is subsequently referred as CLO-IDX.
| Class | Coupon Rate | Notional | OC Trigger(%) | IC Trigger(%) | S&P Rating | Prices (%) |
|---|---|---|---|---|---|---|
| A | Libor+69.5bp | 506,250,000 | 118.8 | 120.0 | AAA | 92.97 |
| B | Libor+110.0bp | 61,875,000 | AA | 82.16 | ||
| C | Libor+200.0bp | 43,125,000 | 111.2 | 112.5 | A | 78.83 |
| D | Libor+3.25% | 30,000,000 | 107.2 | 107.5 | BBB | 72.13 |
| E | Libor+5.00% | 33,750,000 | 104.4 | 100.1 | BB | 63.77 |
| SUBORD | - | 75,000,000 | - | - | NA | 44.89 |
The traditional DM method only uses a single pricing scenario of CADR, CAPR and CRR for all the tranches, which is an overly simplified assumption since the future default, prepay and recovery rates are by no means deterministic. It is much more realistic to assume that there are a set of possible market scenarios of (CADR, CAPR and CRR), and each scenario has certain risk-neutral probability of realization. Figure 2 is a set of representative scenarios that are provided by the Lehman CLO research based on the market condition as of mid 2008. The CAPR and CRR are chosen to be decreasing with the CADR based on historical observations. Even though the default, prepay and recovery rates can be time dependent, we kept them constant in this study for simplicity. It is sensible to add time varying default scenarios if default is likely to be front or back loaded. The distribution of these market scenarios can be calibrated to the market prices of the cash CLO tranches.
More formally, we use to represent the i-th (CADR, CAPR, CRR) scenario in Figure 2, and we use to represent the PV of the j-th CLO tranche under the scenario , which can be computed by simply discounting the cashflow from Intex using the risk free rates without any additional DM. We also use to represent the market price of the j-th CLO tranche as shown in Figure 1, then the calibration reduces to a problem of finding a discrete distribution of for the given set of scenarios so that for every CLO tranche :
| (1) |
We call the that solves (1) the market implied scenario distribution (MISD). This approach is similar in spirit to the Brigo, Pallavicini and Torresetti (2007) for the synthetic CDOs, the main difference here is that there is no constraints from the underlying collateral loan prices, which is a conscious choice because there is no strong arbitrage relationship between the cash CLO assets and liabilities. The tranche prices across the full capital structures have to be used in the MISD calibration otherwise the overall risk of the underlying portfolio cannot be determined. In this approach, the CLO tranche cashflows are computed by Intex using only the aggregated CADR, CAPR and CRR of the whole loan collateral portfolio, this is effectively a top-down approach since it does not drill down to the individual collateral loans.
| CADR (%) | CAPR (%) | CRR (%) | CADR (%) | CAPR (%) | CRR (%) |
| 0 | 15 | 84 | 16 | 0 | 36 |
| 1 | 14 | 81 | 17 | 0 | 33 |
| 2 | 13 | 78 | 18 | 0 | 30 |
| 3 | 12 | 75 | 19 | 0 | 27 |
| 4 | 11 | 72 | 20 | 0 | 24 |
| 5 | 10 | 69 | 22 | 0 | 18 |
| 6 | 9 | 66 | 24 | 0 | 12 |
| 7 | 8 | 63 | 26 | 0 | 6 |
| 8 | 7 | 60 | 28 | 0 | 0 |
| 9 | 6 | 57 | 30 | 0 | 0 |
| 10 | 5 | 54 | 35 | 0 | 0 |
| 11 | 4 | 51 | 40 | 0 | 0 |
| 12 | 3 | 48 | 45 | 0 | 0 |
| 13 | 2 | 45 | 50 | 0 | 0 |
| 14 | 1 | 42 | 60 | 0 | 0 |
| 15 | 0 | 39 | 90 | 0 | 0 |
Since the number of scenarios in Figure 2 is much greater than the number of tranches in Figure 1, there are infinitely many distributions that can reprice all the index CLO tranches. Therefore, certain objective function has to be exogenously chosen so that we can find a unique distribution using an optimization method. The maximum entropy method is well suited for such under-determined optimization problems in derivative pricing as it finds a distribution with the most uncertainty and the least bias. Readers are referred to Avellaneda et al. (2001) for an introduction to the maximum entropy optimization method.
| CADR | A | B | C | D | E | SUB | COL |
|---|---|---|---|---|---|---|---|
| 0 | 103.92 | 107.69 | 114.67 | 124.66 | 139.01 | 174.62 | 109.73 |
| 1 | 103.93 | 107.74 | 114.81 | 124.83 | 139.49 | 162.27 | 109.07 |
| 2 | 103.95 | 107.83 | 114.95 | 125.15 | 139.81 | 147.21 | 108.22 |
| 3 | 103.97 | 107.91 | 115.16 | 125.53 | 140.37 | 127.51 | 107.18 |
| 4 | 103.99 | 108.03 | 115.38 | 125.89 | 141.12 | 101.18 | 105.93 |
| 5 | 104.01 | 108.09 | 115.52 | 126.12 | 141.33 | 73.03 | 104.49 |
| 6 | 104.03 | 108.23 | 115.80 | 126.64 | 136.62 | 43.27 | 102.86 |
| 7 | 103.96 | 108.21 | 115.88 | 126.86 | 129.57 | 17.97 | 100.98 |
| 8 | 103.46 | 107.61 | 115.77 | 127.04 | 112.86 | 13.46 | 98.94 |
| 9 | 102.86 | 106.23 | 112.14 | 125.50 | 80.36 | 10.26 | 96.66 |
| 10 | 102.68 | 105.95 | 111.33 | 120.69 | 35.28 | 7.12 | 93.99 |
| 11 | 102.62 | 105.98 | 111.63 | 61.10 | 29.66 | 6.22 | 91.33 |
| 12 | 102.57 | 105.99 | 105.77 | 8.91 | 25.43 | 4.30 | 88.48 |
| 13 | 102.54 | 106.15 | 62.05 | 7.26 | 18.14 | 3.16 | 85.44 |
| 14 | 102.61 | 105.57 | 5.81 | 5.67 | 18.55 | 3.09 | 82.21 |
| 15 | 102.61 | 70.31 | 5.80 | 5.67 | 13.53 | 3.01 | 78.78 |
| 16 | 102.07 | 36.85 | 4.53 | 4.11 | 13.29 | 2.94 | 75.67 |
| 17 | 98.08 | 33.64 | 3.28 | 4.11 | 8.68 | 2.26 | 72.50 |
| 18 | 93.76 | 32.90 | 3.28 | 4.11 | 12.42 | 2.10 | 69.28 |
| 19 | 89.02 | 32.90 | 3.28 | 2.58 | 12.31 | 0.31 | 66.02 |
| 20 | 84.03 | 32.90 | 2.40 | 2.58 | 12.14 | 0.20 | 62.72 |
| 22 | 73.89 | 31.80 | 2.05 | 2.58 | 11.80 | 0.16 | 56.02 |
| 24 | 63.67 | 31.74 | 2.05 | 2.58 | 7.60 | 0.13 | 49.22 |
| 26 | 54.89 | 29.79 | 2.05 | 2.58 | 1.31 | 0.09 | 42.35 |
| 28 | 44.48 | 29.38 | 2.05 | 1.02 | 2.39 | 0.00 | 35.43 |
| 30 | 40.43 | 29.39 | 0.80 | 1.02 | 9.22 | 0.00 | 32.76 |
| 35 | 33.23 | 17.47 | 0.80 | 1.02 | 8.78 | 0.00 | 27.08 |
| 40 | 27.53 | 10.79 | 0.80 | 1.02 | 3.70 | 0.00 | 22.60 |
| 45 | 36.50 | 7.98 | 0.80 | 1.02 | 0.00 | 0.00 | 19.09 |
| 50 | 33.40 | 4.77 | 0.00 | 0.00 | 0.00 | 0.00 | 16.32 |
| 60 | 28.28 | 3.71 | 0.00 | 0.00 | 0.00 | 0.00 | 12.39 |
| 90 | 20.74 | 1.68 | 0.00 | 0.00 | 0.00 | 0.00 | 6.55 |
Market scenarios are only indexed by its CADR, the full scenario definition is listed in Figure 2.
CLO-IDX
LCDX10
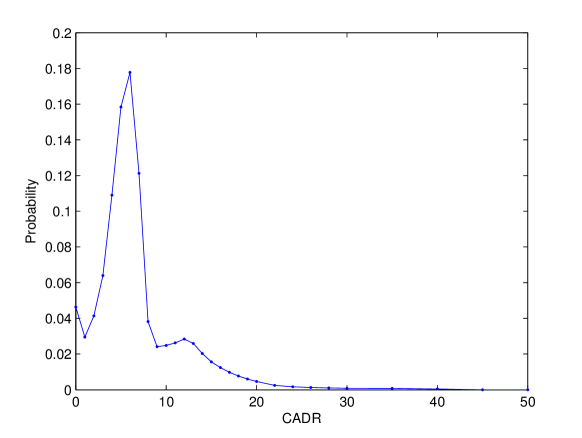
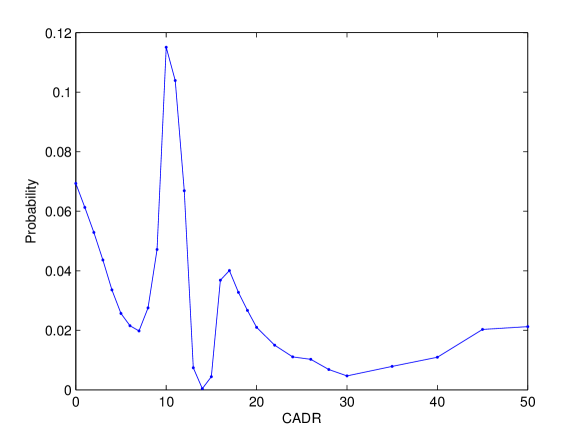
Figure 3 showed the CLO-IDX tranche prices computed by Intex for every scenario in Figure 2. Note that these tranche prices are computed without any additional DM above the risk free rate. Given the data in Figure 3, we can easily find the MISD that reproduces the market CLO tranche prices in Figure 1 via the maximum entropy method. The calibrated distribution is shown in the left side of Figure 4. The fitting quality of the MISD is excellent, the market tranche prices are matched almost exactly, which is not surprising because the number of tranches is much less than the number of market scenarios.
By finding the MISD, we have moved from the traditional pricing method of a single pricing scenario with different DMs for different tranches, to a more consistent pricing method of a single MISD and a single set of risk-free discount factors for all tranches. It seems to be a small step to replace multiple DMs with multiple market scenarios in the MISD, however this is a significant step forward since it is not only more realistic, but also addresses the first two limitations of the traditional DM method listed in section 3. Since the market scenarios in Figure 2 cover a wide range of CADR from 0% to 90%, every structural feature in a cash CLO deal is expected to be triggered under some of the scenarios; thus they are fully priced in by the MISD method. Also, it is obvious that all the tranches from the same CLO deal are priced consistently to each other because the same MISD and risk-free discount factors are used.
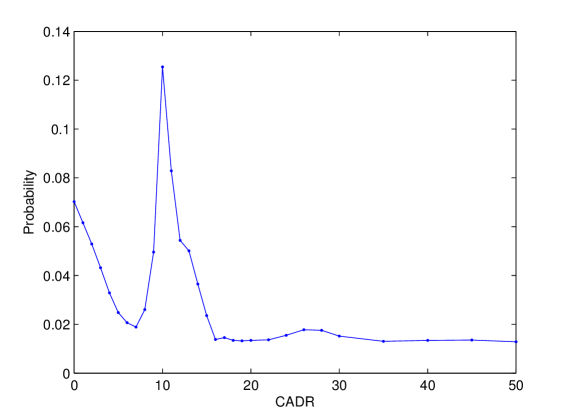
For comparison purposes, we also calibrated the MISD to the synthetic LCDX10 tranches, the results are shown on the right side of Figure 4. The tranche PVs of LCDX10 under each market scenario can be directly computed without using Intex since the LCDX tranche cashflow is a simple function of the aggregated portfolio loss. At first glance, the MISD from the CLO-IDX and the LCDX10 are quite different: the MISD from LCDX10 is roughly uni-modal while the MISD from CLO-IDX is obviously multi-modal. We have calibrated the MISD to many cash CLO deals and found that the multi-modality of MISD is a common feature among almost all cash CLOs in mid 2008, whereas it is not present in the MISD from synthetic CLOs such as LCDX10. The multi-modality of CLOs is caused by the strong market demand for the very safe AAA rated assets during the severe market stress of mid 2008. As shown in Figure 1, the AA tranche is priced more than 10 points cheaper than the AAA tranche, such a steep price drop from the AAA tranche to AA tranche is mostly caused by market technicals instead of fundamentals. If we bump the AA tranche price in Figure 1 up by 5 points and re-calibrate the MISD to the bumped CLO prices, the resulting MISD (Figure 5) becomes closer to the uni-modal MISD from the LCDX10. This exercise showed that the MISD method allows us to meaningfully compare and identify discrepancies between cash and synthetic CLO markets, it also demonstrated the huge differences in dynamics and technicalities between cash and synthetic CLO markets.
| CADR | 13.94% |
|---|---|
| CAPR | 5.77% |
| CRR | 49.94% |
| Average Collateral Loan Price | 84.42 |
From the calibrated MISD, we can easily compute expectations of various quantities, such as expected CADR, CAPR and CRR rates, as shown in Figure 6. Since the MISD are calibrated to cash CLO tranche prices, we call them the tranche implied CADR, CAPR and CRR. The tranche implied CRR is much lower than the historical loan recovery rates (usually above 70%), which is a sign of stress in the cash CLO tranche market.
Using the average underlying collateral loan price (last column of Figure 3) computed by Intex, we can also obtain the tranche implied average collateral loan price, which is the average collateral loan price that makes the total asset value equals the total liability value for the given cash CLO deal. Comparing the tranche implied average loan price against the average of actual market loan prices333 Since some of the underlying loans are illiquid, the average loan prices are actually computed only from loans with observable market prices gives us the basis between the cash CLO tranche market and the underlying loan market. This basis cannot be obtained by simply comparing the notional weighted average of the CLO tranche prices against the average price of the underlying loans since 1) this does not take into account the cash CLO manager’s fee and other expenses that are taken from the collateral loan cashflows 2) the total notional amount of the cash CLO tranches is usually not the same as the total notional amount of the underlying loans. The COL column in Figure 3 reported by Intex, on the other hand, is the PV of the total underlying collateral loan (inclusive of any fees and expenses) normalized by the outstanding notional of the loan collateral, therefore it is the right quantity for computing the tranche implied average loan prices.
In the case of CLO-IDX, the average market price of its underlying loans is around 89.51 and the tranche implied average collateral loan price is 84.42 as shown in Figure 6, i.e., there is a very large negative basis of -5 points, which implies that a investor would lose 5 points instantly if he creates a cash CLO out of a pool of loans. At the mid of 2008, almost all cash CLO deals showed large negative basis between the tranche implied loan price and the average market loan price. In a normal market environment, this basis should be positive otherwise there is no economic incentive to package individual loans to CLOs in the first place444Release of capital is another reason to create cash CLO from loans.. However, during market stress of mid 2008, the cash CLO tranches are severely depressed amid the wide-spread fear of complex structured finance products, therefore the cash CLO tranches traded at deep discounts comparing to the underlying loans.
It is another important advantage for the top-down MISD method to be able to compute the tranche implied quantities and compare them against those from the underlying loan market. This offers a meaningful relative value comparison between the cash CLO market and the underlying loan market. These tranche implied quantities cannot be computed from the traditional DM method, nor can they be obtained from any bottom-up models because bottom-up models enforces the value equality between assets and liabilities. Therefore, the top-down MISD approach is actually more useful and closer to market reality than the bottom-up approach for cash CLOs.
| Class | Coupon Rate | Notional | OC Trigger(%) | IC Trigger(%) | S&P Rating |
|---|---|---|---|---|---|
| A | Libor+25.0bp | 375,000,000 | 111.7 | 111.7 | AAA |
| B | Libor+37.0bp | 22,500,000 | AA | ||
| C | Libor+65.0bp | 17,500,000 | 108.9 | 108.9 | A |
| D | Libor+140.0bp | 30,000,000 | 103.5 | 103.5 | BBB |
| E | Libor+3.650% | 15,000,000 | 102.1 | - | BB |
| SUBORD | - | 40,000,000 | - | - | NA |
4.2 Map to “Bespoke” CLO
After calibrating the MISD to an “index” CLO, we now investigate how to price tranches of other CLO deals. Borrowing the terminology from synthetic CLO, we refer the cash CLO deal we want to price as the “bespoke” CLO. In this section, we use another actual CLO as a sample bespoke CLO, which we subsequently refer to as CLO-BSPK. The CLO-BSPK is of the same vintage and has similar structural features as the CLO-IDX, therefore it is quite sensible to price CLO-BSPK from CLO-IDX. Figure 7 shows some basic information on the CLO-BSPK deal, and Figure 8 shows the tranche prices of CLO-BSPK calculated by Intex under the market scenarios of Figure 2.
| CADR | A | B | C | D | E | SUB | COL |
|---|---|---|---|---|---|---|---|
| 0 | 101.30 | 102.48 | 104.50 | 110.08 | 127.30 | 185.91 | 106.74 |
| 1 | 101.31 | 102.50 | 104.54 | 110.20 | 127.55 | 167.50 | 105.97 |
| 2 | 101.31 | 102.53 | 104.60 | 110.32 | 127.87 | 145.65 | 105.03 |
| 3 | 101.32 | 102.56 | 104.67 | 110.48 | 128.21 | 120.74 | 103.92 |
| 4 | 101.32 | 102.58 | 104.70 | 110.53 | 128.32 | 100.83 | 102.64 |
| 5 | 101.33 | 102.62 | 104.79 | 110.69 | 122.26 | 71.86 | 101.19 |
| 6 | 101.08 | 102.12 | 103.90 | 108.98 | 112.89 | 44.05 | 99.57 |
| 7 | 100.98 | 101.99 | 103.60 | 108.20 | 111.50 | 17.45 | 97.78 |
| 8 | 100.92 | 101.95 | 103.50 | 107.90 | 86.04 | 11.69 | 95.80 |
| 9 | 100.90 | 101.94 | 103.49 | 96.37 | 39.64 | 9.07 | 93.66 |
| 10 | 100.88 | 101.96 | 103.54 | 61.12 | 38.19 | 6.03 | 91.34 |
| 11 | 100.86 | 101.98 | 102.66 | 23.67 | 37.34 | 3.57 | 88.85 |
| 12 | 100.88 | 102.02 | 63.94 | 5.27 | 33.25 | 2.31 | 86.18 |
| 13 | 100.86 | 92.13 | 6.31 | 4.39 | 32.66 | 2.29 | 83.34 |
| 14 | 100.88 | 36.86 | 5.27 | 3.98 | 16.62 | 2.26 | 80.33 |
| 15 | 97.40 | 27.70 | 4.25 | 2.88 | 16.37 | 2.24 | 77.14 |
| 16 | 93.60 | 27.42 | 3.30 | 2.88 | 16.15 | 2.22 | 74.20 |
| 17 | 89.72 | 27.42 | 3.30 | 2.88 | 15.84 | 2.20 | 71.21 |
| 18 | 86.13 | 27.42 | 2.38 | 2.88 | 9.10 | 1.46 | 68.17 |
| 19 | 82.26 | 27.42 | 2.38 | 1.80 | 9.33 | 0.62 | 65.08 |
| 20 | 78.11 | 27.28 | 2.38 | 1.80 | 13.74 | 0.00 | 61.94 |
| 22 | 69.84 | 26.39 | 1.49 | 1.80 | 15.52 | 0.00 | 55.56 |
| 24 | 61.31 | 26.39 | 1.49 | 1.80 | 15.30 | 0.00 | 49.06 |
| 26 | 52.80 | 25.34 | 1.49 | 0.70 | 15.07 | 0.00 | 42.46 |
| 28 | 44.06 | 25.34 | 1.49 | 0.70 | 14.84 | 0.00 | 35.79 |
| 30 | 40.70 | 24.28 | 1.49 | 0.70 | 14.60 | 0.00 | 33.03 |
| 35 | 35.03 | 22.17 | 0.58 | 0.70 | 0.00 | 0.00 | 27.09 |
| 40 | 29.53 | 10.57 | 0.58 | 0.70 | 0.00 | 0.00 | 22.28 |
| 45 | 24.79 | 9.08 | 0.58 | 0.00 | 0.00 | 0.00 | 18.46 |
| 50 | 21.15 | 4.87 | 0.58 | 0.00 | 0.00 | 0.00 | 15.44 |
| 60 | 15.71 | 3.93 | 0.00 | 0.00 | 0.00 | 0.00 | 11.15 |
| 90 | 8.48 | 2.19 | 0.00 | 0.00 | 0.00 | 0.00 | 5.38 |
Market scenarios are only indexed by its CADR, the full scenario definition is listed in Figure 2.
The key to price a “bespoke” CLO is to perturb the index MISD to incorporate the bespoke specific information. Using terminology from synthetic CLO, we need to find a mapping methodology between the index MISD and the bespoke MISD. The cross entropy method is an ideal method for such mapping operation between two distributions since it gives a distribution that is closest to the prior distribution (i.e., the calibrated index MISD) while satisfying additional linear constraints that accounts for important bespoke specific features. Readers are referred to Avellaneda et al. (2001) for an introduction to the cross entropy (also known as Kullback-Leibler relative entropy) method. Among all the features of the “bespoke” CLO, two of them are the most important:
-
1.
The average price of the underlying loan collateral: This is important because it adjusts for the loan quality difference between the index and bespoke CLO. It also allows us to compute tranche sensitivities to the average loan prices, which can be used for macro-hedging.
-
2.
The AAA-rated tranche: Since the AAA tranches are the most liquid, and all the AAA CLO tranches are priced very similarly to each other with minor adjustments for coupons and the underlying loan quality. The market participants can accurately determine the bespoke AAA tranche prices from similar AAA transactions on the market.
Both of these features can be easily added as linear constraints in the cross entropy optimization. To incorporate the underlying loan price, we need an assumption on the size of the basis between the tranche implied and market loan prices for the bespoke CLO. Here we assume that the basis is constant and we use to denote the basis between the tranche implied loan price and average market loan price for the index CLO and to denote the average market price of the underlying loans in the bespoke portfolio, then the linear constraint for the market loan price of the bespoke CLO becomes:
| (2) |
where is the MISD of the bespoke cash CLO we want to price; is the average collateral loan prices from Intex as shown in the last column of Figure 8, which already accounts for the average underlying loan features such as coupon rate, payment schedule and amortization etc. Similarly, the constraints for the AAA tranche can be expressed as:
| (3) |
where is the tranche PVs for the AAA tranche in Figure 8, and the is the expected bespoke AAA tranche price.
Other adjustments can also be included in the cross entropy mapping method. For example, CLO deals managed by a reputable manager often command a sizable premium comparing to those managed by a mediocre manager. This management quality factor can also be included as an adjustment to (2). In this example, we assume there is no difference in management quality between the CLO-BSPK and CLO-IDX.
| Class | S&P Rating | Model Price | Model Delta |
|---|---|---|---|
| CLO-BSPK A | AAA | 89.35 | 0.30 |
| CLO-BSPK B | AA | 78.24 | 1.52 |
| CLO-BSPK C | A | 70.78 | 2.38 |
| CLO-BSPK D | BBB | 55.90 | 3.55 |
| CLO-BSPK E | BB | 60.95 | 3.77 |
| CLO-BSPK SUBORD | - | 47.63 | 5.21 |
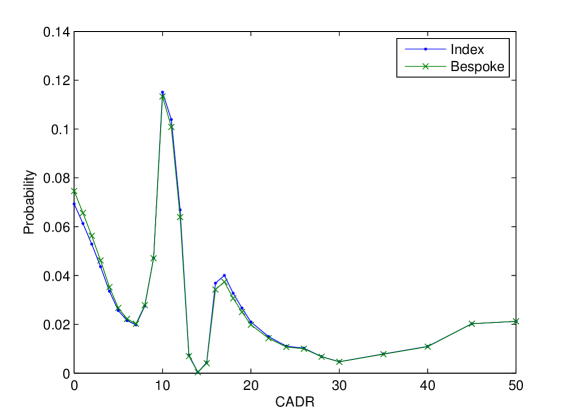
With these two linear constraints in (2) and (3), it is easy to find the MISD for the bespoke cash CLO via the cross entropy method. Figure 9 showed both the MISD of the index cash CLO and the mapped MISD of the bespoke CLO. The bespoke cash CLO tranche prices are easy to compute from the mapped MISD and the PV scenarios in Figure 8. Figure 10 showed the resulting bespoke cash CLO tranche prices.
It is interesting to note that the E tranche is priced higher than the D tranche for CLO-BSPK as shown in Figure 10. A careful examination of the tranche PVs in Figure 8 reveals the reason being that E tranche worths much more than the D tranche under most high CADR scenarios due to a structural features called CERT trigger in the CLO-BSPK deal, which diverts the cashflow to the E tranche instead of the more senior C and D tranches under certain high default rate scenarios. As shown in the cashflow table in Figure 3, a similar but less prominent CERT trigger also exists in the CLO-IDX deal. The purpose of the CERT trigger was to boost the rating of the E tranche. If we use the traditional DM method to price the CLO-BSPK, the E tranche would certainly be priced less than the D tranche since the DM method only uses the single pricing scenario of 3% CADR, under which the D and E tranches of CLO-BSPK behave very similarly to the D and E tranches of CLO-IDX since the CERT trigger is only active under high default rate scenarios. This example showed that the top-down MISD method automatically prices in the structural differences between the index and bespoke cash CLO tranches, thus being able to identify potential mis-prices in the traditional DM method.
The proposed calibration and mapping procedure is a one-period model without any term structure. Unlike synthetic CDO/CLOs which can trade at multiple maturities, each cash CLO only have a single pre-determined maturity, therefore a one-period model is adequate if the index and bespoke CLOs are from similar vintage and have similar reinvestment period.
4.3 Risk Measures
Under the traditional DM method, it is very difficult to quantify the risk of a cash CLO book since there are no meaningful risk measures. The most common view of the risk is the aggregated tranche notional for each rating bucket, which is a very crude estimate of the overall risk as there is no indication of the relative riskiness between different rating buckets. No concrete hedging strategy can be devised from the aggregated cash CLO notional amounts by the rating bucket.
With the cross-entropy mapping method between the MISD of the index and bespoke CLO, we can easily define and compute a set of consistent risk measures for the CLO tranches. For example, it is easy to compute the cash CLO tranche sensitivities to the underlying loan price movements via a simple bump-remap-reprice procedure. As shown in Figure 10, the tranche deltas computed this way are quite reasonable as the deltas are positive and decreasing with the tranche seniority. The aggregated tranche deltas can be used to predict the P&L change of the whole book for a given movement of the average underlying loan price. This is a very precise risk measure which can be used to macro-hedge the cash CLO book.
| Bespoke Tranche | AAA | AA | A | BBB | BB | NA |
|---|---|---|---|---|---|---|
| CLO-BSPK A | 0.89 | 0.24 | -0.20 | 0.01 | -0.01 | 0.00 |
| CLO-BSPK B | 0.11 | 0.43 | 0.31 | 0.00 | -0.01 | 0.00 |
| CLO-BSPK C | 0.25 | -0.49 | 1.07 | 0.27 | -0.08 | 0.01 |
| CLO-BSPK D | -0.02 | -0.01 | -0.02 | 0.50 | 0.54 | -0.06 |
| CLO-BSPK E | 0.04 | 0.12 | 0.12 | -0.08 | 0.72 | 0.15 |
| CLO-BSPK SUBORD | 0.03 | -0.05 | 0.14 | 0.04 | -0.04 | 1.08 |
Similarly, we can define and compute the sensitivities to the index cash CLO tranches via the bump-remap-reprice procedure, as shown in Figure 11. This sensitivity is commonly called tranche01 in the synthetic CLO terminology. The tranche01 risk of CLO-BSPK showed that the CLO-BSPK tranches are the most sensitive to the index tranches of the same rating with some spillover to the next junior tranche. The tranche01 risk is a measure of correlation risk, which is very useful in practice because we can break down the risk of a cash CLO trading book into corresponding tranches of the index CLO, thus allowing us to understand and manage the risk exposure to different parts of the capital structure. The tranche01 risk is a much better measure than the aggregated tranche notional by rating bucket. For example, Figure 11 showed that the BBB-rated D tranche of the CLO-BSPK behaves like a 50-50 mix of the D(rated BBB) and E(rated BB) tranches of the CLO-IDX; which is mainly due to the fact that the D tranche of CLO-BSPK has 3.5% less subordination than the D tranche of CLO-IDX even though they are both BBB rated. These structural differences between cash CLO deals are automatically captured by the tranche01 risk from the top-down MISD method, thus providing a much more coherent view of the correlation risk of a cash CLO book.
Other risk measures such as interest rate risk and theta risk can be similarly defined and computed from the top-down method.
5 Conclusion
The proposed top-down method is ideal for cash CLOs as it produces consistent prices and risks across cash CLO deals while being very simple, intuitive and computationally efficient. Drilling down to the individual collateral loans provides very little practical benefits because of the lack of liquidity in individual loans and the lack of strong arbitrage relationship between cash CLO assets and liabilities.
In practice, this top-down model allows a cash CLO trading desk to only mark the prices of a few representative cash CLO deals as the indices for different vintages and deal types, then the rest of the cash CLO tranches in the book can be automatically priced via the cross entropy mapping method. This allows the cash CLO tranches to be priced consistently using the same calibrate-and-mapping procedure as in synthetic CDO/CLOs, making it much more difficult to manipulate the price marks and book P&L.
All the structural features of a cash CLO are automatically taken into consideration by the proposed top-down method, which is a big improvement over the traditional DM based method. Although the consistency between the value of cash CLO assets and liability is not enforced during the calibration because of the lack of strong arbitrage relationship, the average loan price is a valuable piece of market information and it is used by the cross entropy mapping to adjust for the underlying loan quality difference between cash CLO deals. Therefore this top-down MISD method can be a very effective method in finding relative value trading opportunities between cash CLO tranches, especially when most market participants are still using the traditional DM method.
This top-down method also produces a full set of risk measures. It is feasible to attribute the P&L movement of a cash CLO trading book using the change of the average underlying loan prices and the index cash CLO tranche prices. Even though it is not feasible to hedge CLO tranches by trading individual loans, it is certainly possible to macro hedges the risk of overall loan market movement based on the cash CLO deltas from the top-down model. If the market develops and certain “index” cash CLO deals becomes easier to short (for example, via TRS), then it is also possible to hedge the correlation risk of a cash CLO book via the tranche01 risk from the model. Being able to meaningfully define risk measures and devise their hedging strategies for a cash CLO book is certainly another big improvement over the DM based method.
This method is also computationally efficient since there is only a limited number of scenarios (Figure 2) to run for each deal. The calibration, pricing and risk measures of cash CLO tranches can be computed very efficiently using the the standard Intex tool, and this is no need to build any custom cashflow waterfall engine. This top-down method is very easy to implement and operate in practice as most cash CLO market participants already use the Intex tool. Using this top-down method, different market participants will reach the same CLO tranche prices if they can agree on a standard set of market scenarios like those listed in Figure 2, and if they can establish a poll to determine the prices of a small set of representative “index” cash CLO tranches. Both of these two steps are well within reach therefore this method has the potential to bring much more pricing transparency to the cash CLO market.
References
- (1)
- Avellaneda et al. (2001) Avellaneda, M., R. Buff, C. Friedman, N. Grandchamp, N. Gr, L. Kruk and J. Newman. 2001. “Weighted Monte Carlo: A New Technique for Calibrating Asset-Pricing Models.” International Journal of Theoretical and Applied Finance 4:1–29.
- Brigo, Pallavicini and Torresetti (2007) Brigo, D., A. Pallavicini and R. Torresetti. 2007. “Calibration of CDO Tranches with the Dynamical Generalized-Poisson Loss Model.” defaultrisk.com .
- O’Kane and Livesey (2004) O’Kane, D. and M. Livesey. 2004. “Base Correlation Explained.” Lehman Brothers: Quantitative Credit Research Quarterly pp. 3–20.