11email: claire.martin-zaidi@obs.ujf-grenoble.fr 22institutetext: ISDC Data Centre for Astrophysics & Geneva Observatory, University of Geneva, chemin d’Ecogia 16, 1290 Versoix, Switzerland 33institutetext: School of Physics, University of Exeter, Stocker Road, Exeter EX4 4QL, United Kingdom 44institutetext: Institut d’Astrophysique Spatiale, Université Paris-Sud, 91405 Orsay Cedex, France
Where is the warm H2 ?
A search for H2 emission from disks around Herbig Ae/Be stars
Abstract
Context. Mid-infrared (mid-IR) emission lines of molecular hydrogen (H2) are useful probes to determine the mass of warm gas present in the surface layers of circumstellar disks. In the past years, numerous observations of Herbig Ae/Be stars (HAeBes) have been performed, but only two detections of H2 mid-IR emission toward HD 97048 and AB Aur have been reported.
Aims. We aim at tracing the warm gas in the circumstellar environment of five additional HAeBes with gas-rich environments and/or physical characteristics close to those of AB Aur and/or HD 97048, to discuss whether the detections toward these two objects are suggestive of peculiar conditions for the observed gas.
Methods. We search for the H2 S(1) emission line at 17.035 m using high-resolution mid-IR spectra obtained with VLT/VISIR, and complemented by CH molecule observations with VLT/UVES. We gather the H2 measurements from the literature to put the new results in context and search for a correlation with some disk properties.
Results. None of the five VISIR targets shows evidence for H2 emission at 17.035 m. From the 3 upper limits on the integrated line fluxes we constrain the amount of optically thin warm () gas to be less than in the disk surface layers. There are now 20 HAeBes observed with VISIR and TEXES instruments to search for warm H2, but only two detections (HD 97048 and AB Aur) were made so far. We find that the two stars with detected warm H2 show at the same time high 30/13 m flux ratios and large PAH line fluxes at 8.6 and 11.3m compared to the bulk of observed HAeBes and have emission CO lines detected at m. We detect the CH 4300.3 absorption line toward both HD 97048 and AB Aur with UVES. The CH to H2 abundance ratios that this would imply if it were to arise from the same component as well as the radial velocity of the CH lines both suggest that CH arises from a surrounding envelope, while the detected H2 would reside in the disk.
Conclusions. The two detections of the S(1) line in the disks of HD 97048 and AB Aur suggest either peculiar physical conditions or a particular stage of evolution. New instruments such as Herschel / PACS should bring significant new data for the constraints of thermodynamics in young disks by observing the gas and the dust simultaneously.
Key Words.:
stars: circumstellar matter – stars: formation – stars: pre-main sequence – ISM: molecules1 Introduction
Planets are supposed to form in circumstellar disks composed of gas and dust around stars in their pre-main sequence phase. At this evolutionary stage, the disk mass is essentially dominated by the gas (99%), especially molecular hydrogen (H2). Although H2 is the principal gaseous constituent in disks, it is very challenging to detect. Molecular hydrogen is an homonuclear molecule which means that its fundamental transitions are quadrupolar in nature. Hence their Einstein spontaneous emission coefficients are small and produce only weak lines. For circumstellar disks another challenge is that the weak H2 lines must be detected on top of the strong dust continuum emission. In the mid-infrared, high spectral resolution instruments like VISIR at the VLT are required to disentangle these weak lines from the continuum.
However, one should bear in mind a fundamental issue concerning the structure of a gas-rich optically thick disk. Molecular lines are produced in the hot upper surfaces of the disk where the molecular gas and accompanying dust are optically thin. Therefore, molecular line emission is not sensitive to and does not probe the mid-plane interior layers of the disk because it is optically thick. Because the amount of molecular gas in the optically thin surface layers is small, the expected H2 line fluxes are very weak. As an example of this, Carmona et al. (2008) calculated the expected H2 line fluxes from typical Herbig Ae disks assuming a two-layer Chiang & Goldreich (1997) disk model, , a gas-to-dust-ratio of 100, LTE emission and a distance of 140 pc. They found that the expected line H2 fluxes are much fainter than the detection limits of current instrumentation. Indeed, numerous non-detections of H2 mid-IR pure rotational lines in the circumstellar environment of young stars have been reported in the past few years (Bitner et al. 2008; Carmona et al. 2008; Martin-Zaïdi et al. 2008b, 2009a). Nevertheless, lines can reach a detectable level if the gas-to-dust to ratio is allowed to be higher than 100 and/or the in the surface layers of the disk.
| Star | Sp. | Av | vrad(a) | Disk | Evidence for | ||
|---|---|---|---|---|---|---|---|
| Type | (K) | (mag) | (km s-1) | (pc) | resolved | gas-rich | |
| environment | |||||||
| HD 142527 | F6 IIIe | 6300(1) | 1.49(1) | -3.5(2) | 140(3) | yes(4) | |
| HD 169142 | A8 Ve | 8130(5) | 0.37(6) | -3.0(7) | 145(5) | yes(8) | yes(9) |
| HD 150193A | A1 Ve | 9300(1) | 1.61(1) | -6.0(10) | 150(1) | yes(11) | |
| HD 163296 | A1 Ve | 9300(1) | 0.25(1) | -4.0(2) | 122(1) | yes(12) | yes(13) |
| HD 100546 | B9 Vne | 10470(1) | 0.25(1) | +17(13) | 103(1) | yes(14) | yes(13) |
-
(a) radial velocity of the star in the heliocentric rest frame.
-
References: (1) van den Ancker et al. (1998); (2) SIMBAD database; (3) de Zeeuw et al. (1999); (4) Fukagawa et al. (2006); (5) Acke et al. (2005); (6) Malfait et al. (1998); (7) Dunkin et al. (1997); (8)Kuhn et al. (2001); (9) Panić et al. (2008); (10) Reipurth et al. (1996); (11) Fukagawa et al. (2003); (12) Grady et al. (2000); (13) Lecavelier des Etangs et al. (2003); (14) Augereau et al. (2001).
| Star | Airmass | Optical | Standard | Airmass | Optical | Asteroid | Airmass | Optical | |
|---|---|---|---|---|---|---|---|---|---|
| (s) | Seeing | Star | Seeing | Seeing | |||||
| (”) | (”) | (”) | |||||||
| HD 142527 | 3600 | 1.10-1.28 | 0.71-1.08 | HD 211416 | 1.23-1.25 | 0.79-1.02 | HEBE | 1.19-1.20 | 0.97-1.06 |
| HD 169142 | 3600 | 1.17-1.50 | 0.71-1.01 | HD 211416 | 1.23-1.25 | 0.79-1.02 | HEBE | 1.19-1.20 | 0.97-1.06 |
| HD 150193A | 3600 | 1.31-1.88 | 0.85-1.40 | HD 211416 | 1.24-1.25 | 0.81-0.99 | PSYCHE | 1.13-1.16 | 0.75-0.83 |
| HD 163296 | 3600 | 1.60-2.70 | 0.79-1.19 | HD 211416 | 1.24-1.25 | 0.81-0.99 | IRIS | 1.00-1.01 | 0.99-1.28 |
| HD 100546 | 3600 | 1.44-1.52 | 0.73-1.09 | HD 89388 | 1.31-1.32 | 0.61-0.73 | HEBE | 1.19-1.20 | 0.97-1.06 |
-
The airmass and seeing intervals are given from the beginning to the end of the observations.
Molecular hydrogen mid-IR lines have been detected in two Herbig Ae/Be stars, namely HD 97048 and AB Aur, respectively observed with VLT/VISIR (Martin-Zaïdi et al. 2007) and TEXES (Bitner et al. 2007). These detections imply particular physical conditions for the gas and dust, such as , as mentioned above. These conditions may be created by gas heated by X-rays or UV photons in the surface layers of the disks. We note that these two detections indicate that the gas has not completely dissipated in the inner part of these disks in a lifetime of about 3 Myrs (ages of the stars), while photoevaporation of the gas is expected to clear up this inner region within roughly the same time (3 Myrs; e.g. Takeuchi et al. 2005; Alexander 2008). Indeed, Martin-Zaïdi et al. (2009a) have shown that the emitting H2 around HD 97048 was more likely distributed in an extended region within the inner disk, between 5 AU and 35 AU of the disk, and Bitner et al. (2007) concluded from their observation of the disk of AB Aur that the H2 emission arised around 18 AU from the central star.
We present new observations with the VISIR high-resolution spectroscopic mode, to search for the mid-IR H2 emission line at 17.035 m, the most intense pure rotational line observable from the ground, in a sample of well studied Herbig Ae/Be stars known to harbor extended gas-rich circumstellar disks. The main goal of these observations is to enlarge the global sample of HAeBes observed at 17.035 m, and to better constrain the particular physical conditions observed in the disks of HD 97048 and AB Aur. In order to better understand the detections of H2 in the disks of HD 97048 and AB Aur, we also analyze VLT/UVES spectra of these two stars to observe spectral lines of the CH and CH+ molecules which are linked to the formation and excitation of H2. In Sects. 3 and 4 we present the analysis of the VISIR spectra of the five HAeBes of our sample and relate it to the context of the global search for molecular hydrogen at mid-IR wavelengths. We perfom a statistical analysis of the whole sample of HAeBes where H2 emission has been searched for in the mid-IR, and explore the possible link between the H2 and the dusty disk properties. Finally, we discuss the possible origin of the mid-IR H2 emission in the disks of HD 97048 and AB Aur.
2 Observation and data reduction

2.1 VISIR observations
We selected a sample of five Herbig Ae/Be stars with spatially resolved disks (Table 1). They were selected using the following criteria: (i) proximity to the Sun (150pc), with well known distances; (ii) resolved disk and/or firm evidence of gas-rich circumstellar environment, and/or properties close to that of HD 97048 and/or AB Aur, for which the 17.035 m line has already been detected; (iii) well known Herbig Ae/Be stars with a rich set of existing observations, particularly including gas-lines spectroscopy observations (Far-UV H2 lines, CO lines…; e.g. Thi et al. 2001; Martin-Zaïdi et al. 2008a; van der Plas et al. 2009) and PAHs (Polycyclic Aromatic Hydrocarbons) features (e.g. Habart et al. 2004; Acke & van den Ancker 2006). The fundamental parameters of each target are presented in Table 1.
The target stars were observed on 2009 June 14 and 15, with the high spectral resolution long-slit mode of the VISIR (ESO VLT Imager and Spectrometer for the mid-InfraRed Lagage et al. 2004) instrument at the VLT. We focussed on the observations of the S(1) pure rotational line of H2 at 17.035 m because it is the most intense line observable from the ground, and because it is the only line ever detected with VISIR in disks of Herbig Ae/Be stars (Martin-Zaïdi et al. 2007). The central wavelength of the observations was thus set to be 17.035 m. We used the 0.75” slit, providing a spectral resolution of about 14 000. The observation conditions are summarized in Table 2. In order to correct the spectra from the Earth’s atmospheric absorption and to obtain the absolute flux calibration, asteroids and standard stars were observed at nearly the same airmass and seeing conditions as the objects, just before and after observing the science targets. For this purpose, we also used the modeled spectra of the standard stars (Cohen et al. 1999), and those of the asteroids (for HEBE and IRIS see Mueller & Lagerros 1998, 2002, and for PSYCHE, Mueller 2009, priv. comm.). For details on the observations and data reduction techniques see Martin-Zaïdi et al. (2007) and Martin-Zaïdi et al. (2008b).
| Star | Integrated flux(b) | Intensity(b) | upper limits(b) | H2 mass upper limits(b,c) | ||||||
|---|---|---|---|---|---|---|---|---|---|---|
| HD | (m) | (ergs s-1 cm-2) | (ergs s-1 cm-2 sr-1) | (cm-2) | () | |||||
| 150K | 300K | 1000K | 150 K | 300 K | 1000 K | |||||
| 142527 | 17.0351 | 1.010-14 | 2.510-3 | 9.41022 | 6.11021 | 1.41021 | 1.910-1 | 1.210-2 | 3.310-3 | |
| 169142 | 17.0343 | 1.810-14 | 4.210-3 | 1.61023 | 1.01022 | 2.41021 | 3.510-1 | 2.110-2 | 6.110-3 | |
| 150193A | 17.0349 | 2.110-14 | 5.010-3 | 1.91023 | 1.21022 | 2.81021 | 4.510-1 | 2.710-2 | 7.710-3 | |
| 163296 | 17.0345 | 2.810-14 | 6.710-3 | 2.51023 | 1.61022 | 3.81021 | 3.910-1 | 2.410-2 | 6.910-3 | |
| 100546 | 17.0363 | 1.410-13 | 3.310-2 | 1.21024 | 7.91022 | 1.91022 | 1.4 | 8.410-2 | 2.410-2 | |
-
(a) expected position of the line in the observed spectra by correcting the radial velocity of the star for the epoch of observation.
-
(b) 3 upper confidence limits.
-
(c) masses of H2 are calculated assuming the distances quoted in Table 1.
2.2 UVES observations
To better understand the detections of H2 towards HD 97048 and AB Aur, we observed spectral lines of the CH and CH+ molecules in the optical range at high spectral resolution using UVES (ESO program numbers 075.C-0637 and 078.C-0774). The blue arm of UVES (3700Å - 5000Å) gives acces to the electronic transitions of the CH and CH+ molecules that are good tracers of the H2 formation and excitation (Federman 1982; Mattila 1986; Somerville & Smith 1989). The formation of CH is predicted to be controlled by gas-phase reactions with H2. CH is thus a good tracer of H2 and their abundances are generally strongly correlated. The formation of the CH+ molecule through the chemical reaction C+ + H2 needs a temperature of about 4500 K to occur. Thus, the CH+ molecule is a probe of hot and excited media, which could be interpreted as material close to the star, and this would allow us to better constrain the excitation of H2.
The spectra were reduced using the UVES pipeline v3.2.0 (Ballester et al. 2000) based on the ESO Common Library Pipeline, and were corrected from the Earth’s rotation in order to shift them in the heliocentric rest frame. To analyze the absorption lines in the observed spectra we used the Owens package (for details, see Lemoine et al. 2002; Martin-Zaïdi et al. 2008a), which allows us to derive the characteristics of the gaseous components, i.e. column density N, radial velocity vrad and broadening parameter .
3 Results
3.1 VISIR sample analysis
We observed five well studied Herbig Ae/Be stars with the high resolution spectroscopic mode of VISIR to search for the H2 pure rotational S(1) line. None of the observed sources show evidence for H2 emission at 17.035 m (Fig. 1). In HD 169142, the expected centroid for the H2 line corresponds to an emission feature in the spectrum. However, this feature has a full-width-at-half maximum (FWHM) smaller than a spectral resolution element ( 21 km s-1), and an amplitude of about 1 that makes it insignificant in terms of detection (for details on the calculation of the standard deviation , see Martin-Zaïdi et al. 2008b). We did not consider it further as a detection. As described previously, we insist that mid-IR H2 lines only probe warm gas located in the surface layers of the disks because of the large opacity in the interior layers due to the dust. The surface layers of the disks, from which solid-state emission features also arise, surrounding our target stars therefore do not contain sufficient warm gas to enable it to be detected in emission at mid-IR wavelengths.
Then, we derived 3 upper limits on the integrated line fluxes and upper limits for the total column densities and masses of H2 as a function of the temperature for all the spectra by integrating over a Gaussian of FWHM corresponding to the VISIR spectral resolution, and an amplitude of 3, centered on the expected wavelength for the S(1) line (see Table 3 and Fig. 2).
For this purpose, we used the method detailed in Martin-Zaïdi et al. (2008b, 2009a), by assuming that the line is optically thin at local thermodynamic equilibrium (LTE) and that the radiation is isotropic (for details on the formulae, see also van Dishoeck 1992; Takahashi 2001).

From the 3 upper limits to the emission line flux, we calculated upper limits on the column density and mass of H2 for each star. We found that the column densities should be lower than 1024 cm−2 at 150 K, and lower than 1022 cm−2 at 1000 K. The corresponding upper limits to the masses of warm gas in the surface layers of the inner disk were estimated to be in the range from 610-3 to 1.4 (1 10-3 ), assuming LTE excitation, and depending on the adopted temperature (see Table 3 and Fig. 2).
3.2 H2 detection statistics
In the past three years, numerous observations have been performed to observe the pure rotational mid-IR emission lines of molecular hydrogen in the circumstellar environments of HAeBes. VISIR observations of 15 HAeBes have been conducted (Carmona et al. 2008; Martin-Zaïdi et al. 2007, 2008b, and this work) and only one source out of the 15, namely HD 97048, presents a clear evidence for H2 emission at 17.035 m. In addition, in their sample of five HAeBes observed with TEXES at 17.035 m, Bitner et al. (2008) have reported only one detection of the S(1) H2 line in the disk of AB Aur. This leads to a detection statistics of the S(1) line from the ground of 10% only in disks about Herbig Ae/Be stars. However, this statistic suffers from the fact that the 3 limits in our sample are inhomogeneous. Indeed, due to the different detection limits of each instrument (and exposure time for each target), the 3 upper limits on the line flux from VISIR observations cannot be directly compared to those obtained with TEXES. However, our sample is quite representative of the variety of HAeBes observable from the ground, including stars with spectral type from F6 to B2, with very young, massives or transitional disks. Therefore, the 10% statistics can be regarded as a lower limit on the number of H2 detections with current ground-based mid-IR instrumentation. This is consistent with the models by Carmona et al. (2008), who show that mid-IR H2 lines cannot be detected with the existing instruments for disks under LTE conditions. Those authors estimated that sensitivities down to 10-16 ergs s-1 cm-2 must be reached to detect the S(1) line, while VISIR typically reaches 10-14 ergs s-1 cm-2.
The numerous non-detections of the S(1) line in circumstellar environments of HAeBes could imply that the physical conditions of the warm gas in most disks are consistent with those assumed in such a model, i.e. gas and dust well-mixed, a gas-to-dust ratio of about 100, and .
4 Discussion
4.1 H2 and disk properties
The challenge now is to explain the two detections of the S(1) line in the disks of HD 97048 and AB Aur. If the HD 97048 and AB Aur disks trace a particular evolutionary stage, one may expect some connection between the mass of warm H2 and the disk properties.
The slope of the spectra corresponding to the ratio of the and indexes, i.e. continuum fluxes at 30 and 13 m respectively, has been used by Brown et al. (2007) to identify the population of cold disks. In addition, young flared disks tend to show rising spectra in the mid-IR with a much higher / ratio than the more evolved, settled systems with self-shadowed disks with much flatter mid-IR spectra (Dominik et al. 2003). The / ratio diagnostic is therefore not unique, but allows us to identify a population with properties that depart from those of most young stars with disks. Indeed, in their sample of T Tauri stars, Brown et al. (2007) have shown that the majority of their sample had an emission that increased by a factor of 2.31.4 between 13 and 30 m, while the cold, possibly transitional, disks rose by factors of .
Here we measured the slope of the spectra of our targets, obtained with the IRS spectrograph installed onboard the Spitzer Space Telescope, by computing which is the mean flux value (in Jy) in the range 13 m 0.5 m, and the mean flux value (in Jy) between 29 m and 31 m (Table 4, for details see Olofsson et al. 2009). The data reduction was performed with the “c2d legacy team pipeline” (Lahuis et al. 2006) with the S18.7.0 pre-reduced (BCD) data.
| Star | / | H2 mass and upper | |
|---|---|---|---|
| limits at T=600 K () | |||
| (This work) | |||
| HD 142527 | 4.86 | 4.110-3 | |
| HD 169142 | 7.12 | 7.510-3 | |
| HD 150193A | 1.44 | 9.610-3 | |
| HD 163296 | 1.54 | 8.510-3 | |
| HD 100546 | 3.32 | 2.910-2 | |
| (Martin-Zaïdi et al. 2008b) | |||
| HD 98922 | 0.70 | 7.110-2 | |
| HD 250550 | 2.67 | 1.210-1 | |
| HD 259431 | 2.78 | 3.110-2 | |
| HD 45677 | (a) | ||
| (Carmona et al. 2008) | |||
| UX Ori | (a) | ||
| HD 100453 | 5.41 | 3.810-3 | |
| HD 101412 | 0.92 | 7.310-3 | |
| HD 104237 | 1.28 | 3.510-3 | |
| HD 142666 | 1.55 | 4.710-3 | |
| (Bitner et al. 2008) | |||
| 49 Cet | 2.31 | 6.610-4 | |
| MWC 758 | 4.00 | 5.310-3 | |
| V892 Tau | 3.72 | 1.910-2 | |
| VV Ser | 0.76 | 1.510-2 | |
| (Martin-Zaïdi et al. 2009a) | |||
| HD 97048 (b) | 6.22 | (1.60.1)10-2 | |
| (Bitner et al. 2007) | |||
| AB Aur (b) | 4.21 | (1.60.47)10-3 |
-
(a) Spitzer data not available.
-
(b) masses of H2 (not upper limits) because the S(1) has been detected.
-
We used distances and integrated fluxes values from the papers referenced in the table.

Figure 3 shows the upper limits of H2 mass measured from the S(1) line flux versus the slope of the spectra ( ratio). For comparison with our targets, we plotted all the stars observed at 17.035 m by VISIR and by TEXES, including HD 97048 and AB Aur (Martin-Zaïdi et al. 2007, 2008b, 2009a; Carmona et al. 2008; Bitner et al. 2008). For this task, we considered only the upper limits on the mass of H2 at 600 K for each target, because the temperature of the observed H2 is around 600 K for AB Aur (Bitner et al. 2007) and lower than 600 K for HD 97048 (Martin-Zaïdi et al. 2009a).
Most of our sample stars have an emission that increases by a median factor of 2.21.5 between 13 and 30 m, which is fully consistent with the results of Brown et al. (2007). However, four stars in our sample, namely HD 169142, HD 100453, HD 142527, and HD 97048, have significantly higher ratios. We stress that AB Aur is marginally higher than the bulk. In addition, the four spectra are also characterized by the absence of 10 m amorphous silicate features. This is consistent with the fact that the strong wings of the amorphous silicate feature at 10 m increase the continuum flux around 13m and thus decrease the ratio. The ratio of these four stars correspond to the region of the plot where Brown et al. (2007) have identified the transitional cold disks in their sample, which also do not present the 10 m amorphous silicate feature in their spectra. However, HD 97048 is supposed to be a young star harboring a massive gas-rich flared disk (Lagage et al. 2006; Doucet et al. 2007), as compared to the other three stars that are known to have more evolved and less massive disks than HD 97048 (e.g. Grady et al. 2007). Its position in our Fig. 3 raises numerous questions about its status. Below, we explore different ways to understand the origin of the detected H2 and the status of HD 97048 (and marginally AB Aur).
4.2 Is the H2 related to PAHs ?
As we did for the ratio, we searched for the possible correlation between the presence and line flux of PAHs features and the upper limits on H2 mid-IR lines. For this task we compared the line flux of the PAHs feature at 8.6m and 11.3m (called 11m complex due to the possible blend with features of amorphous and crystalline silicate; e.g. Acke & van den Ancker 2004) found in the literature (Table 5), with the H2 upper mass limits (Table 4). With regard to the ratio, AB Aur and HD 97048 seem to depart from the bulk, and appear in the top of the plots where the PAHs line fluxes are high (Fig. 4 and Fig. 5).


| star | PAHs 8.6 (W/m2) | Comp 11 (W/m2) | ref | ||
|---|---|---|---|---|---|
| HD 142527 | 9.9010-15 | 2.0910-14 | 1 | ||
| HD 169142 | 2.5510-14 | 8.1810-15 | 1 | ||
| HD 150193A | 3.6410-15 | 8.2910-15 | 1 | ||
| HD 163296 | 5.5710-15 | 1.4910-14 | 1 | ||
| HD 100546 | 5.6110-14 | 3.8910-13 | 1 | ||
| HD 98922 | y | 1.410-14 | 2, 3 | ||
| HD 250550 | n | n | 4 | ||
| HD 259431 | – | – | – | ||
| HD 45677 | – | – | – | ||
| UX Ori | 1.5710-15 | 7.2010-16 | 1 | ||
| HD 100453 | 1.6510-14 | 7.8310-15 | 1 | ||
| HD 101412 | y | 1.510-15 | 2, 3 | ||
| HD 104237 | 2.6710-15 | 1.5610-15 | 1 | ||
| HD 142666 | 5.3710-15 | 5.4210-15 | 1 | ||
| 49 Cet | – | – | – | ||
| MWC 758 | – | – | – | ||
| V892 Tau | – | – | – | ||
| VV Ser | 1.6710-15 | 2.0410-15 | 1 | ||
| HD 97048 | 4.5210-14 | 3.9710-14 | 1 | ||
| AB Aur | 3.6810-14 | 4.6110-14 | 1 |
In the upper disk surface layers, photoelectric heating is very efficient on small grains such as PAHs, and can play a significant role in the gas heating process (Kamp & Dullemond 2004; Jonkheid et al. 2007). The PAHs emission depends on the geometry of the disk, i.e. the emission is proportional to the amount of PAHs that is directly illuminated by the UV light from the star. Thus the PAHs emission depends both on PAHs abundance and on geometry, and it is unclear which of these two effects is responsible for the higher PAH emission strength in AB Aur and HD 97048 compared to other Herbig stars in the sample. Irrespective of its origin, the strong emission of PAHs appears related to H2 emission. Is there a link between their excitation and heating mecanisms ? This question must be studied further.
4.3 Could the H2 emission arise from the envelope?
Both HD 97048 and AB Aur are known to possess extended envelopes with a significant contribution in the various observations of gas and dust (e.g. Hartmann et al. 1993; Grady et al. 1999). Could the observed H2 mid-IR emission be due to the gaseous component of the envelopes of these stars?
This scenario can certainly excluded because, firstly, the H2 S(1) lines observed in the spectra of HD 97048 and AB Aur are not spatially resolved, which constrains the emitting region to be very close to the central stars. Given the weakness of the detected H2 emission, at least for AB Aur, it is also unlikely that had any extended emission is present. This would have been detected. Secondly, electronic transitions of H2 have been detected in absorption with the FUSE (Far Ultraviolet Spectroscopic Explorer) satellite towards AB Aur, likely arising from the extended envelope surrounding the star (Roberge et al. 2001; Martin-Zaïdi et al. 2008a). The column density of the level of H2 measured in the FUSE spectrum is 105 times lower than that derived from the mid-IR observations, implying that we clearly do not observe the same regions around the star.
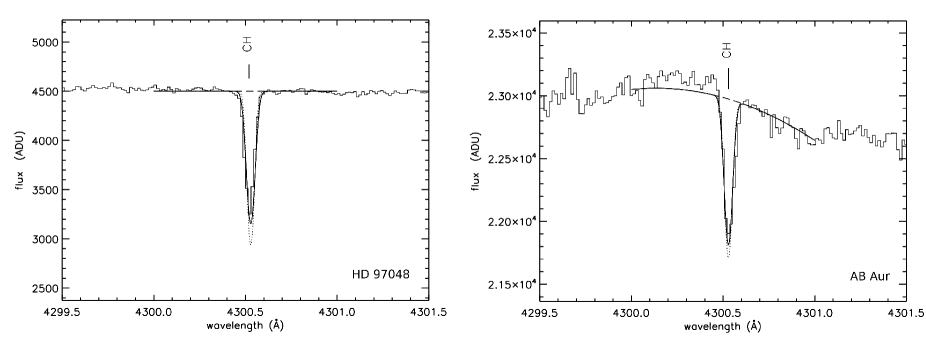
The source HD 97048 has never been observed with FUSE, which precludes any other analysis of the H2 lines than that of VISIR observations. We thus analyzed the spectra of HD 97048 and AB Aur obtained with VLT/UVES. For the two stars we detected absorption lines of the CH and CH+ molecules (see Fig. 6), as well as absorption lines of Ca I, Ca II and K I. Due to the high inclination angles of the disks with respect to the lines of sight, the observed gas cannot be in the disks, but likely arises from the surrounding envelope. We measured the radial velocities of these lines in the UVES spectra of the two stars (Table 6). All these lines in the UVES spectra have the same radial velocity, implying that we probed a single gaseous component along each line of sight. This is confirmed by the measured -values of CH and CH+ lines that are in the range expected for pure thermal broadening, as generally seen in diffuse ISM clouds where typical -values are about 1.5 up to 3 km s-1 (e.g. Gry et al. 2002), and which would be much higher if several gaseous components were present along the line of sight. In addition, the radial velocities of the S(1) lines observed for HD 97048 and AB Aur, with VISIR and TEXES respectively (Martin-Zaïdi et al. 2007; Bitner et al. 2007) differ by about 10 km s-1 from those measured for the gas in the UVES spectra. This is an additional clue that we probed different regions of the environment of the stars in the mid-IR and visible ranges, and that the H2 emission in the mid-IR does not come from the envelope, but from the disk.
Finally, it is important to note here that in their sample of Herbig Ae/Be stars observed both with FUSE and UVES, Martin-Zaïdi et al. (2009b, c) showed that when H2 and CH are both observed, their column densities are correlated in proportions consistent with those observed in the diffuse interstellar medium (N(CH)/N(H2)10-7, e.g. Welty et al. 2006; Sheffer et al. 2008). It is important to note that for these stars, including AB Aur, the FUSE H2 data implied an interstellar origin for the gas or a remnant of the parent molecular cloud and/or circumstellar envelope (Martin-Zaïdi et al. 2008a). Here, the total column densities of H2 derived from the mid-IR observations give a N(CH)/N(H2) ratio higher by a factor 102 to 103 than the interstellar ratio, again suggesting a different location, the H2 detected in the mid-IR being in the disk, CH being in the envelope. Cold molecular hydrogen is very likely present in the envelope as probed by FUSE, but does not possess the physical properties required to emit at mid-IR wavelengths.
| Star | log N(CH) | log N(CH+) | vrad | |
|---|---|---|---|---|
| (cm-2) | (cm-2) | (km s-1) | (km s-1) | |
| HD 97048 | 13.10.4 | 12.20.3 | 14.50.2 | 1.50.4 |
| AB Aur | 12.31.4 | 13.10.1 | 15.00.1 | 1.80.3 |
-
The radial velocities are in the heliocentric rest frame.
4.4 Comparison with CO observations
An important tracer of gas in the inner disks of T Tauri and Herbig Ae/Be stars are the fundamental CO ro-vibrational emission bands (e.g., v=1) present at 4.7m. CO emission at 4.7 m traces warm and hot gas at temperatures ranging from hundreds to a few thousands Kelvin (Najita et al. 2003). For Herbig Ae stars, CO has been detected in almost all sources with optically thick disks (i.e. E(K-L) 1 Brittain et al. 2007), typically exhibiting rotational temperatures between 1000-1500 K and in a few cases hotter than 2000 K (Blake & Boogert 2004; Brittain et al. 2007). In Herbig Ae stars, the CO emission properties and excitation mechanism appear to depend on the disk geometry deduced from the SED shape (Meeus et al. 2001; Dullemond & Dominik 2004). The dominant excitation mechanism appears to be LTE for self-shadowed disks, and fluorescence for flaring disks (van der Plas et al. 2010, in prep). High-excitation CO emission lines (up to v=5-4) have been observed only in flared disks (van der Plas et al. 2010, in prep).
In the context of H2 mid-IR emission detections, we find that in all the Herbig Ae/Be stars where H2 mid-IR emission has been detected their disks are flared, and CO emission at 4.7m has been detected too. Note however that the opposite is not true, as this and other studies show, not all the sources with CO m emission display H2 mid-IR emission. Bitner et al. (2008) show that when H2 mid-IR is detected, the gas temperatures are significantly higher than the equilibrium temperatures expected for the emitting regions, thus suggesting that the gas temperature is higher than the dust and that processes such as UV-X-rays or accretion heating may be important (a conclusion in agreement with the conclusions of Carmona et al. 2008, when explaining non-detections of H2 emission).
If we extend the idea of an additional source of heating to collisions (Bitner et al. 2008; Carmona et al. 2008) to analyze the CO and H2 mid-IR detections together (note that mid-IR H2 traces warm gas and CO 4.7 m hotter gas), we may expect that the sources with detected H2 mid-IR emission would have CO emission at temperatures higher than the equilibrium temperature for the respective emitting regions. In other words, we will expect for sources with H2 mid-IR emission to observe CO lines at high excitation transitions. This argumentation works at least for HD 97048, where CO emission up to v=5-4 has been detected (van der Plas et al. 2009). Indeed, van der Plas et al. (2009) modeled the 12CO emission at 4.7m around HD 97048, observed with the VLT/CRIRES, with a homogeneous Keplerian disk. Their modeling of CO emission yields an inner radius of 11 AU. Those authors concluded a depletion of CO in the inner region of the disk, probably due to photodissociation. Our previous estimate of the location of the H2 mid-IR emission (5 AU to 35 AU) is compatible with the CO inner radius, but CO also traces gas in the disk at much larger radii (up to 100 AU). However, this line of reasoning cannot explain the case of HD 100546, a star where van der Plas et al. (2010, in prep) detected CO emission up to v=5-4, but we do not see H2 mid-IR emission with VISIR. But then, there is a large gap (r14 AU) in the dust disk of HD 100546, with very little material inside (Bouwman et al. 2003; Benisty et al. 2010). This is likely different from HD 97048 and AB Aur.
In addition, Brittain et al. (2003) conducted observations toward AB Aur at 4.7m of 12CO (v=1-0) emission using the NASA Infrared Telescope Facility (IRTF) and the Keck Observatory. The excitation diagram of CO (assuming LTE gas) gives a temperature of 70 K for the cool gas corresponding to the low-J levels, and an excitation temperature of 1540 K for the hot gas (high-J levels). This diagram is interpreted by those authors as hot CO emission coming from the inner rim of the disk (1 AU from the star), while the cool emission originates in the outer flared part of the disk ( 8 AU from the star). The excitation temperature and radial velocity found for the cold CO are fully consistent with those found by Martin-Zaïdi et al. (2008a) for the cold H2 observed in absorption by FUSE, as well as for the CH observed with UVES. On the other hand, Bitner et al. (2007) showed that the H2 emission at 17m in the disk of AB Aur arised around 18 AU from the central star, with an excitation temperature of about 670 K. Their derived gas temperature and distance from the central star fall between the hot and cold components seen in the CO observations (Brittain et al. 2003), suggesting that the H2 and CO IR-emission does not come from the same region of the disk.
It is hard to drive definitive conclusions based on very few detections. Further searches of high-excitation CO emission using high-spectral resolution in sources with H2 mid-IR detections (most notably AB Aur) and further searches of H2 mid-IR emission in sources with high-excitation CO will be required to test the idea whether H2 mid-IR emission and high-excitation CO emission are correlated. For instance, the main conclusion that we can arrive at is that Herbig Ae stars appear to be in general a uniform group concerning CO m emission and H2 emission in the sense that CO is detected in optically thick disks and that H2 mid-IR emission is very weak (i.e. not detected), except for those sources with flaring disks where an additional mechanism heats the H2 to a detectable level. The use of full disks models (coupling gas and dust; Woitke et al. 2010) could help us to understand the possible correlation between CO and H2, but this is beyond the scope of this paper.
5 Conclusion
We reported here on a search for the H2 S(1) emission line at 17.035 m in the circumstellar environments of five well known HAeBes with the high resolution spectroscopic mode of VISIR. No source shows evidence for H2 emission at 17.035 m. From the 3 upper limits on the integrated line fluxes, we derived limits on column densities and masses of warm gas as a function of the temperature. The present work brings to 18 the number of non-detections of the H2 S(1) line in a global sample of 20 Herbig Ae/Be stars observed with VISIR and TEXES (Martin-Zaïdi et al. 2007; Bitner et al. 2007; Carmona et al. 2008; Martin-Zaïdi et al. 2008b; Bitner et al. 2008).
The detections of H2 emission at 17.035 m by Bitner et al. (2007) and Martin-Zaïdi et al. (2007) show that at least a few circumstellar disks have sufficiently high H2 mid-infrared emission to be observed from the ground. The most likely explanation for this is that the optically thin surface layers of the disk has and that the gas-to-dust ratio is higher than the canonical ratio of 100 (Carmona et al. 2008; Martin-Zaïdi et al. 2007). Indeed, in the surface layers of the disk, low densities or dust settling and coagulation may conduct to a spatial decoupling between the gas and the dust. Photoelectric heating can thus play a significant role in the gas heating process and the physical conditions may rapidly differ from the LTE ones, i.e., (Kamp & Dullemond 2004; Jonkheid et al. 2007). On the other hand, UV and X-ray heating can be responsible for the excitation of the observed gas and can heat the gas to temperatures significantly hotter than the dust (Nomura & Millar 2005; Glassgold et al. 2007; Ercolano et al. 2008). In any case, one would need to observe the lower H2 -levels (i.e. and ) to definitively constrain the kinetic temperature of the gas, and better understand the excitation mechanisms responsible of the mid-IR emission.
As a second step, we also performed a statistical analysis of the whole sample of Herbig Ae/Be stars observed at 17.035 m with VISIR as well as with TEXES. This analysis allowed us to identify a population of stars, including HD 97048 and marginally AB Aur, with properties that depart from the bulk of our sample. This raises numerous questions about the origin of the detected gas and the status of HD 97048 and AB Aur. From our UVES observations we clearly demonstrated that the observed mid-IR H2 emission does not come from the envelope, but from the disk.
Are HD 97048 and AB Aur peculiar stars (and why)? Due to the similarities of these two stars (, age, mass, disk size…), one would expect that the physical conditions of their circumstellar gas are typical of a particular (short) stage of evolution of the disks. However, to confirm this assumption, we would need to observe other similar HAeBes. Unfortunately, no other nearby Herbig Ae/Be star observable with the existing instruments presents the same observational properties. A global diagnostic of the gaseous content of the disks is thus now required. To better constrain the physical and chemical properties of the gas, multi-wavelengths observations and a deep modeling would be very useful. In this context, the Herschel satellite will be very helpful because it will allow us to constrain the thermodynamics in young disks by observing the gas and the dust simultaneously.
Acknowledgements.
This work is based on observations obtained at ESO/VLT (Paranal) with VISIR, program number 083.C-0910, and with UVES program numbers 075.C-0637 and 078.C-0774. We warmly thank G. van der Plas for fruitful discussions about CO observations. C.M-Z. warmly thanks A. Smette (ESO) for discussions about VISIR observations. We thank ANR for financial support through contract ANR-07-BLAN-0221 (Dusty Disks). A.C acknowledge support from a Swiss National Science Foundation grant (PP002–110504). C.M-Z. was supported by a CNES fellowship.References
- Acke & van den Ancker (2004) Acke, B. & van den Ancker, M. E. 2004, A&A, 426, 151
- Acke & van den Ancker (2006) Acke, B. & van den Ancker, M. E. 2006, A&A, 457, 171
- Acke et al. (2005) Acke, B., van den Ancker, M. E., & Dullemond, C. P. 2005, A&A, 436, 209
- Alexander (2008) Alexander, R. 2008, New Astronomy Review, 52, 60
- Augereau et al. (2001) Augereau, J. C., Lagrange, A. M., Mouillet, D., & Ménard, F. 2001, A&A, 365, 78
- Ballester et al. (2000) Ballester, P., Modigliani, A., Boitquin, O., et al. 2000, The Messenger, 101, 31
- Benisty et al. (2010) Benisty, M., Tatulli, E., Ménard, F., & Swain, M. R. 2010, A&A, 511, A75+
- Bitner et al. (2007) Bitner, M. A., Richter, M. J., Lacy, J. H., et al. 2007, ApJL, 661, L69
- Bitner et al. (2008) Bitner, M. A., Richter, M. J., Lacy, J. H., et al. 2008, ApJ, 688, 1326
- Blake & Boogert (2004) Blake, G. A. & Boogert, A. C. A. 2004, ApJL, 606, L73
- Bouwman et al. (2003) Bouwman, J., de Koter, A., Dominik, C., & Waters, L. B. F. M. 2003, A&A, 401, 577
- Brittain et al. (2003) Brittain, S. D., Rettig, T. W., Simon, T., et al. 2003, ApJ, 588, 535
- Brittain et al. (2007) Brittain, S. D., Simon, T., Najita, J. R., & Rettig, T. W. 2007, ApJ, 659, 685
- Brown et al. (2007) Brown, J. M., Blake, G. A., Dullemond, C. P., et al. 2007, ApJL, 664, L107
- Carmona et al. (2008) Carmona, A., van den Ancker, M. E., Henning, T., et al. 2008, A&A, 477, 839
- Chiang & Goldreich (1997) Chiang, E. I. & Goldreich, P. 1997, ApJ, 490, 368
- Cohen et al. (1999) Cohen, M., Walker, R. G., & Witteborn, F. C. 1999, LPI Contributions, 969, 5
- de Zeeuw et al. (1999) de Zeeuw, P. T., Hoogerwerf, R., de Bruijne, J. H. J., Brown, A. G. A., & Blaauw, A. 1999, AJ, 117, 354
- Dominik et al. (2003) Dominik, C., Dullemond, C. P., Waters, L. B. F. M., & Walch, S. 2003, A&A, 398, 607
- Doucet et al. (2007) Doucet, C., Habart, E., Pantin, E., et al. 2007, A&A, 470, 625
- Dullemond & Dominik (2004) Dullemond, C. P. & Dominik, C. 2004, A&A, 417, 159
- Dunkin et al. (1997) Dunkin, S. K., Barlow, M. J., & Ryan, S. G. 1997, MNRAS, 286, 604
- Ercolano et al. (2008) Ercolano, B., Drake, J. J., Raymond, J. C., & Clarke, C. C. 2008, ApJ, 688, 398
- Federman (1982) Federman, S. R. 1982, ApJ, 257, 125
- Fukagawa et al. (2003) Fukagawa, M., Tamura, M., Itoh, Y., Hayashi, S. S., & Oasa, Y. 2003, ApJL, 590, L49
- Fukagawa et al. (2006) Fukagawa, M., Tamura, M., Itoh, Y., et al. 2006, ApJL, 636, L153
- Geers et al. (2006) Geers, V. C., Augereau, J., Pontoppidan, K. M., et al. 2006, A&A, 459, 545
- Geers et al. (2007) Geers, V. C., van Dishoeck, E. F., Visser, R., et al. 2007, A&A, 476, 279
- Glassgold et al. (2007) Glassgold, A. E., Najita, J. R., & Igea, J. 2007, ApJ, 656, 515
- Grady et al. (2000) Grady, C. A., Devine, D., Woodgate, B., et al. 2000, ApJ, 544, 895
- Grady et al. (2007) Grady, C. A., Schneider, G., Hamaguchi, K., et al. 2007, ApJ, 665, 1391
- Grady et al. (1999) Grady, C. A., Woodgate, B., Bruhweiler, F. C., et al. 1999, ApJL, 523, L151
- Gry et al. (2002) Gry, C., Boulanger, F., Nehmé, C., et al. 2002, A&A, 391, 675
- Habart et al. (2004) Habart, E., Natta, A., & Krügel, E. 2004, A&A, 427, 179
- Hartmann et al. (1993) Hartmann, L., Kenyon, S. J., & Calvet, N. 1993, ApJ, 407, 219
- Jonkheid et al. (2007) Jonkheid, B., Dullemond, C. P., Hogerheijde, M. R., & van Dishoeck, E. F. 2007, A&A, 463, 203
- Kamp & Dullemond (2004) Kamp, I. & Dullemond, C. P. 2004, ApJ, 615, 991
- Kuhn et al. (2001) Kuhn, J. R., Potter, D., & Parise, B. 2001, ApJL, 553, L189
- Lagage et al. (2006) Lagage, P.-O., Doucet, C., Pantin, E., et al. 2006, Science, 314, 621
- Lagage et al. (2004) Lagage, P. O., Pel, J. W., Authier, M., et al. 2004, The Messenger, 117, 12
- Lahuis et al. (2006) Lahuis, F., Kessler-Silacci, J. E., Evans, N. J., I., et al. 2006, c2d Spectroscopy Explanatory Supplement, Tech. rep., Pasadena: Spitzer Science Center
- Lecavelier des Etangs et al. (2003) Lecavelier des Etangs, A., Deleuil, M., Vidal-Madjar, A., et al. 2003, A&A, 407, 935
- Lemoine et al. (2002) Lemoine, M., Vidal-Madjar, A., Hébrard, G., et al. 2002, ApJS, 140, 67
- Malfait et al. (1998) Malfait, K., Bogaert, E., & Waelkens, C. 1998, A&A, 331, 211
- Martin-Zaïdi et al. (2008a) Martin-Zaïdi, C., Deleuil, M., Le Bourlot, J., et al. 2008a, A&A, 484, 225
- Martin-Zaïdi et al. (2009a) Martin-Zaïdi, C., Habart, E., Augereau, J.-C., et al. 2009a, ApJ, 695, 1302
- Martin-Zaïdi et al. (2007) Martin-Zaïdi, C., Lagage, P.-O., Pantin, E., & Habart, E. 2007, ApJL, 666, L117
- Martin-Zaïdi et al. (2009b) Martin-Zaïdi, C., Le Bourlot, J., Roueff, E., Hily-Blant, P., & Gry, C. 2009b, in SF2A-2009: Proceedings of the Annual meeting of the French Society of Astronomy and Astrophysics, held 29 June - 4 July 2009 in Besançon, France. Eds.: M. Heydari-Malayeri, C. Reylé and R. Samadi, p.295, ed. M. Heydari-Malayeri, C. Reyl’E, & R. Samadi, 295–+
- Martin-Zaïdi et al. (2009c) Martin-Zaïdi, C., Le Bourlot, J., Roueff, E., Hily-Blant, P., & Gry, C. 2009c, A&A
- Martin-Zaïdi et al. (2008b) Martin-Zaïdi, C., van Dishoeck, E. F., Augereau, J., Lagage, P., & Pantin, E. 2008b, A&A, 489, 601
- Mattila (1986) Mattila, K. 1986, A&A, 160, 157
- Meeus et al. (2001) Meeus, G., Waters, L. B. F. M., Bouwman, J., et al. 2001, A&A, 365, 476
- Mueller & Lagerros (1998) Mueller, T. G. & Lagerros, J. S. V. 1998, A&A, 338, 340
- Mueller & Lagerros (2002) Mueller, T. G. & Lagerros, J. S. V. 2002, A&A, 381, 324
- Najita et al. (2003) Najita, J., Carr, J. S., & Mathieu, R. D. 2003, ApJ, 589, 931
- Nomura & Millar (2005) Nomura, H. & Millar, T. J. 2005, A&A, 438, 923
- Olofsson et al. (2009) Olofsson, J., Augereau, J., van Dishoeck, E. F., et al. 2009, A&A, 507, 327
- Panić et al. (2008) Panić, O., Hogerheijde, M. R., Wilner, D., & Qi, C. 2008, A&A, 491, 219
- Reipurth et al. (1996) Reipurth, B., Pedrosa, A., & Lago, M. T. V. T. 1996, A&AS, 120, 229
- Roberge et al. (2001) Roberge, A., Lecavelier des Etangs, A., Grady, C. A., et al. 2001, ApJL, 551, L97
- Sheffer et al. (2008) Sheffer, Y., Rogers, M., Federman, S. R., et al. 2008, ApJ, 687, 1075
- Somerville & Smith (1989) Somerville, W. B. & Smith, C. A. 1989, MNRAS, 238, 559
- Takahashi (2001) Takahashi, J. 2001, ApJ, 561, 254
- Takeuchi et al. (2005) Takeuchi, T., Clarke, C. J., & Lin, D. N. C. 2005, ApJ, 627, 286
- Thi et al. (2001) Thi, W. F., van Dishoeck, E. F., Blake, G. A., et al. 2001, ApJ, 561, 1074
- van den Ancker et al. (1998) van den Ancker, M., de Winter, D., & Tjin A Djie, H. 1998, A&A, 330, 145
- van der Plas et al. (2009) van der Plas, G., van den Ancker, M. E., Acke, B., et al. 2009, A&A, 500, 1137
- van Dishoeck (1992) van Dishoeck. 1992, in Infrared Astronomy with ISO, ed. Encrenaz, Th., and Kessler, M.F. (Nova Science Publisher), 283
- Welty et al. (2006) Welty, D. E., Federman, S. R., Gredel, R., Thorburn, J. A., & Lambert, D. L. 2006, ApJS, 165, 138
- Woitke et al. (2010) Woitke, P., Pinte, C., Tilling, I., et al. 2010, ArXiv e-prints