L1448 IRS2E: A CANDIDATE FIRST HYDROSTATIC CORE
Abstract
Intermediate between the prestellar and Class 0 protostellar phases, the first core is a quasi-equilibrium hydrostatic object with a short lifetime and an extremely low luminosity. Recent MHD simulations suggest that the first core can even drive a molecular outflow before the formation of the second core (i.e., protostar). Using the Submillimeter Array and the Spitzer Space Telescope, we present high angular resolution observations towards the embedded dense core IRS2E in L1448. We find that source L1448 IRS2E is not visible in the sensitive infrared images (at wavelengths from 3.6 to 70 m), and has weak (sub-) millimeter dust continuum emission. Consequently, this source has an extremely low bolometric luminosity ( 0.1 ). Infrared and (sub-) millimeter observations clearly show an outflow emanating from this source; L1448 IRS2E represents thus far the lowest luminosity source known to be driving a molecular outflow. Comparisons with prestellar cores and Class 0 protostars suggest that L1448 IRS2E is more evolved than prestellar cores but less evolved than Class 0 protostars, i.e., at a stage intermediate between prestellar cores and Class 0 protostars. All these results are consistent with the theoretical predictions of the radiative/magneto hydrodynamical simulations, making L1448 IRS2E the most promising candidate of the first hydrostatic core revealed so far.
1 INTRODUCTION
Stars form by the gravitational collapse of dense cores in molecular clouds. A comprehensive understanding of the formation and evolution of dense cores is thus a necessary prerequisite to the understanding of the origin of stellar masses, multiple systems, and outflows. Over the past decade, observational studies of (low-mass) dense cores have made significant progress (see, e.g., Reipurth et al. 2007 for recent reviews). Representing the earliest phase of star formation, both prestellar and protostellar cores have been extensively observed and studied using large (sub) millimeter telescopes (e.g., JCMT and IRAM-30m) and infrared telescopes (e.g., Spitzer Space Telescope). In practice, however, it is still difficult to distinguish the two types of cores because of the lack of readily observable differences between them. This is illustrated by the fact that several “prestellar” cores, like L1014, were found to harbor very low-luminosity protostars in sensitive observations (see Young et al. 2004). Consequently, despite all of the observational advances in the past decade, we still do not have a good understanding of the evolutionary process that turns a prestellar core into a protostar.
On the theoretical side, the collapse and evolution from prestellar cores to Class 0 protostars have been long studied since the pioneering work of Larson (1969). Theoretical calculations and simulations in fact predict two successive collapse phases, before and after the dissociation of molecular hydrogen, resulting in two different hydrostatic objects (see, e.g., Larson 1969; Masunaga et al. 1998, 2000; André et al. 2008). The collapsing prestellar core is initially optically thin to the thermal emission from dust grains, and the compressional heating rate by the collapse is much smaller than the cooling rate by the thermal radiation. The collapse is therefore isothermal at the very beginning. This condition is broken when the compressional heating rate surpasses the radiative cooling rate, and the central temperature increases gradually above 10 K. The collapse is then decelerated and forms a shock at the surface of a quasi-adiabatic hydrostatic object, the so-called “first hydrostatic core” or “first core”, which consists mainly of hydrogen molecules. The inward motion at this phase is called the “first collapse”. When the central temperature reaches about 2000 K, hydrogen molecules begin to dissociate into atoms, which acts as an efficient coolant of the gas. When released gravitational energy is consumed by the dissociation, the gas pressure cannot increase rapidly enough to support the first core against its self-gravity, the “second collapse” begins. After the dissociation is completed, the “second core”, a truly hydrostatic protostellar object, forms in the center. Most, if not all, Class 0 protostars observed so far actually belong to the population of the “second cores” (Ph. André, private communication).
Intermediate between the prestellar and Class 0 protostellar phases, the first core is a transient object accreting from the surrounding dense envelope; the lifetime of the first core is calculated to be only 103 to 104 years (Boss & Yorke 1995; Masunaga et al. 1998; Machida et al. 2008). Based on radiative hydrodynamical (RHD) simulations, Boss & Yorke (1995) and Masunaga et al. (1998) modelled the spectral energy distribution (SED) of the first core, and found that it should have an extremely low bolometric luminosity ( 0.1 ), and have no detectable infrared emission at wavelengths shorter than 30 m with current telescopes. Furthermore, recent magneto-hydrodynamical (MHD) simulations have found that the first core can even drive a molecular outflow before the formation of the second core (i.e., protostar) (Tomisaka 2002; Banerjee & Pudritz 2006; Machida et al. 2008). Therefore, the observational detection of the first core would not only confirm the predictions of RHD models but also set strong constraints on MHD models of protostellar outflows. Unfortunately, due to its short lifetime and extremely low luminosity, no first core has been observationally found as yet.
In this paper, we present Submillimeter Array111The Submillimeter Array is a joint project between the Smithsonian Astrophysical Observatory and the Academia Sinica Institute of Astronomy and Astrophysics and is funded by the Smithsonian Institution and the Academia Sinica. (SMA; Ho et al. 2004) and Spitzer Space Telescope () observations towards an embedded dense core in the L1448 region ( = 240 20 pc; Hirota et al. 2008). As a bridge between the isolated star-forming cores and the large-scale clusters, L1448 is an excellent region for studying star formation on the intermediate scale and has been observed extensively in the past two decades (see, e.g., Bally et al. 2008 and reference therein). L1448 IRS2, in the western part of the L1448 filament, was classified as a Class 0 protostar by O’Linger et al. (1999). Located 50′′ to the east of IRS2, another dense core was revealed in the SCUBA submm images in O’Linger et al. (1999), and was formally cataloged as SCUBA core No. 31 in Hatchell et al. (2005) and SMM J032543+30450 in Kirk et al. (2006). This core was found to have a mean kinetic gas temperature of K, and the observed width of NH3 (1, 1) is 0.16 km s-1 (Rosolowsky et al. 2008). We refer to this dense core as L1448 IRS2E in this work.
2 OBSERVATIONS AND DATA REDUCTION
2.1 SMA Observations
L1448 IRS2E was observed with the SMA on 2009 December 25th in the compact configuration (seven antennas were used in the array). The digital correlator was set up to cover the frequency ranges 216.9220.9 GHz and 228.8232.8 GHz in the lower and upper sidebands, respectively. The three isotopic CO (2–1) lines and several other lines, e.g., N2D+ (3–2) and SiO (5–4), were observed simultaneously in this setup. The 1.3 mm dust continuum emission was also recorded with a total bandwidth of 7.5 GHz ( 3.8 GHz USB and 3.7 GHz LSB). System temperatures ranged from 100 to 150 K (depending on elevation), with a typical value of 120 K. Quasar 3c273 was used for bandpass calibration, and quasars 3c84 and 0359+509 for gain calibration. 3c273 was also used for absolute flux calibration, from which we estimate a flux accuracy of 20%, by comparison of the final quasar fluxes with the SMA calibration database. The data were calibrated using the IDL MIR package and imaged using the Miriad toolbox (Sault et al. 1995). The SMA synthesized beam size and theoretical noise levels at 1.3 mm dust continuum and in the 12CO (2–1) line, with robust uv weighting 1.0, are 3.9′′ 2.6′′, 0.48 mJy beam-1, and 53 mJy beam-1 (channel width 1.0 km s-1), respectively.
2.2 Observations
The infrared data for L1448 were obtained from the Science Center (SSC) archive. The L1448 dark cloud, which is part of the Perseus molecular cloud, was observed in 2004 as part of the Legacy Program “From Molecular Cores to Planet Forming Disks” (c2d; Evans et al. 2003), by both the Infrared Array Camera (IRAC) and the Multiband Imaging Photometer for (MIPS). The infrared data were reduced by the c2d team and are publicly available from the SSC science archive. The IRAC and MIPS results of Perseus have been published by Jørgensen et al. (2006) and Rebull et al. (2007), respectively. The details of the observations and data reductions can be found in Dunham et al. (2008).
3 RESULTS
3.1 Infrared, Submillimeter, and Millimeter Continuum Emission
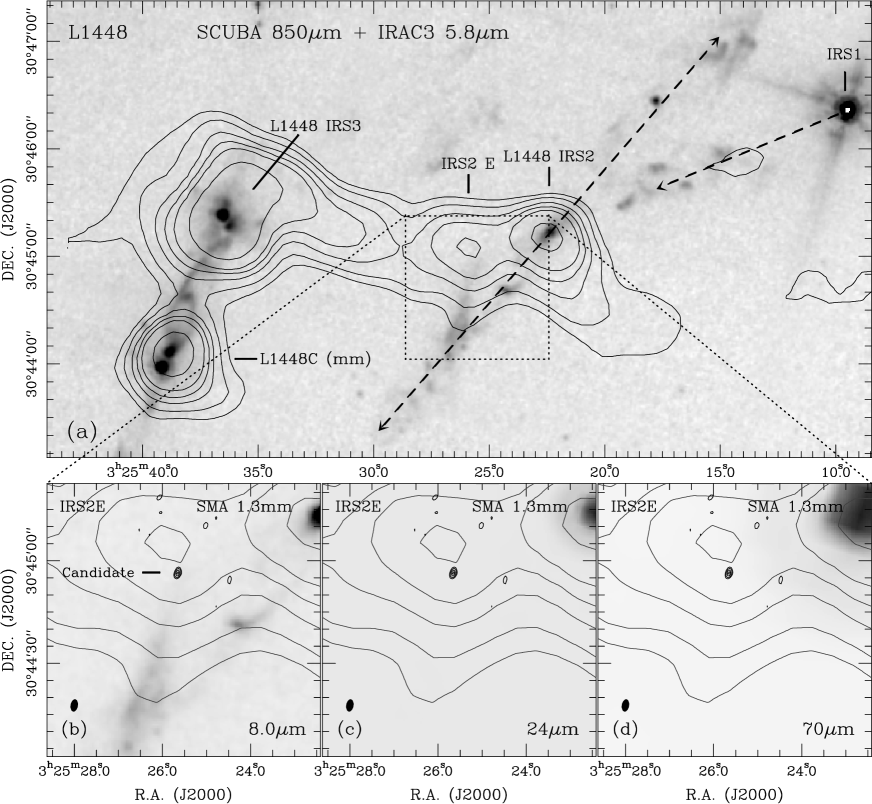
Figure 1 shows the SCUBA 850 m dust continuum contours of the L1448 complex (from Kirk et al. 2006; publicly available on the COMPLETE web site222http://cfa.harvard.edu/COMPLETE), plotted on the images. The SCUBA contours show the arc-shaped filamentary structure of L1448, in which the three well-known Class 0 protostars (i.e., L1448C, IRS3, and IRS2) are labelled. Located 50′′ to the east of source IRS2, the dense core, referred to as IRS2E, is seen in the SCUBA image. This core is also spatially coincident with a molecular cloud core revealed by IRAM-30m N2H+ (1–0) observations (Chen et al. 2010, in preparation), and has a line-of-sight velocity (LSR velocity 4.1 km s-1; Rosolowsky et al. 2008) similar to the other Class 0 protostars, indicating it is physically associated with the L1448 filament. However, no compact infrared emission was detected from L1448 IRS2E in any of the bands (from 3.6 to 70 m; see Figs. 1a-1d), suggesting that this source is extremely cold. We note that the data of L1448 were obtained with the c2d legacy program, a large infrared survey toward five nearby large molecular clouds (Chamaeleon II, Lupus, Ophiuchus, Perseus, and Serpens). In the c2d observations, all the known Class 0 protostars in these five clouds were detected (Evans et al. 2009 and references therein), which proves that these images have enough sensitivity to detect the youngest protostars. This indicates that the non-detection of L1448 IRS2E in the images is not due to insufficient imaging sensitivity but is observationally significant.
In the SMA 1.3 mm dust continuum images, a weak continuum source ( 6 level; R.A. = 03:25:25.66, Dec. = 30:44:56.7, J2000) is found within the IRS2E core (see Figs. 1b-1d). This source is evident in images made from visibility data of either sideband, as well as in both halves of the track, suggesting that it is not an artifact in the data. Interestingly, the IRAC images (at all four bands) show a diffuse jet-like feature to the south of IRS2E, with this SMA dust continuum source located at the apex (see Figs. 1a-1b). From Gaussian fitting in the cleaned-restored images, we derive a flux density of 6 2 mJy for this dust continuum source. Assuming that the 1.3 mm dust continuum emission is optically thin, the total gas mass () of IRS2E is calculated with the same method described in Launhardt & Henning (1997). In the calculations, we adopt a dust opacity of , which is a typical value for cold and dense cores with an average number density of cm-3 (Ossenkopf & Henning 1994), and a dust temperature of 11 K, which is similar to the kinetic gas temperature of L1448 IRS2E. The total gas mass of this source, estimated from the SMA dust continuum observations, is 0.04 0.01 .
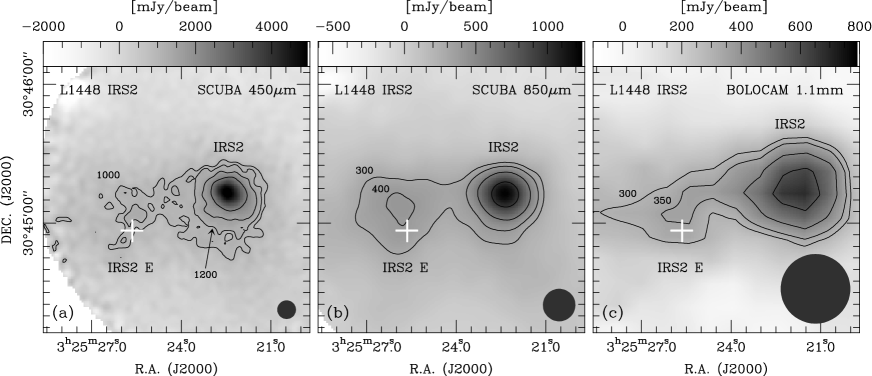
To further estimate the submm and mm fluxes, in Figure 2 we show the SCUBA 450 m, 850 m, and Bolocam 1.1 mm images of L1448 IRS2, taken from the JCMT science archive333Because the 850 m fluxes in Kirk et al. (2006; 2007) are somewhat uncertain (due to issues with the calibration), we prefer using the original SCUBA images of L1448 IRS2 (from the JCMT science archive) to estimate the submm fluxes of L1448 IRS2E. and Enoch et al. (2006), respectively. As shown in Fig. 2, the submm continuum emission from source IRS2E shows a roughly centrally-peaked condensation separated from the IRS2 core, while the 1.1 mm continuum emission from IRS2E is weak and elongated, and no core was identified at this position by Enoch et al. (2006). The fluxes within one beam around the SMA continuum source are estimated to be 1200 mJy at 450 m, 400 mJy at 850 m, and 300 mJy at 1.1 mm, respectively (see Fig. 2 and Table 1). However, it must be noted that the peak positions of the IRS2E core in the SCUBA 450 m, 850 m, and SMA 1.3 mm images are different from each other ( 10′′ offset). It appears that the single-dish data reveal the entire (extended) low-mass dense core, while the SMA data shows a faint compact source which is embedded in this core, but not at its center. Deeper (sub-) mm dust continuum observations are needed to investigate the position and density structure of this core.
3.2 CO (2–1) Emission
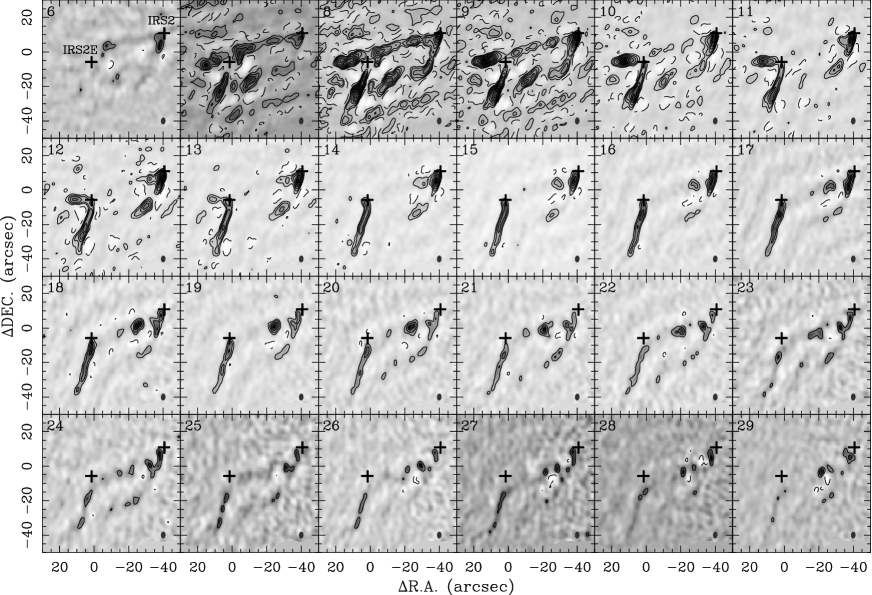
Figure 3 shows the velocity channel maps of the SMA 12CO (2–1) emission of L1448 IRS2E. For comparison, the SMA 12CO (2–1) emission from L1448 IRS2 is also plotted here (the SMA data of IRS2 were taken from Arce et al. 2010, in preparation). For IRS2E, CO emission is detected to the south of the SMA continuum peak at velocities from = 7 to 30 km s-1, with the cloud systemic velocity being 4.1 km s-1. This redshifted CO emission exhibits an elongated and narrow structure. No blueshifted CO emission was detected around IRS2E in the SMA observations, even though the SMA primary beam of 55′′ (at 230 GHz) covers the area where we would expect to see the blueshifted lobe if it were there. Hatchell et al. (2007) observed the L1448 region in the CO (3–2) line using the JCMT, and similar to our findings, they detected no blueshifted emission around L1448 IRS2E.
As shown in Fig. 3, several elongated CO lobes are seen around IRS2E in the velocity channels from 7 to 13 km s-1, which come from the redshifted outflow driven by L1448 IRS2. The Class 0 protostar IRS2 was first proposed to be a binary system by Wolf-Chase et al. (2000) based on the NRAO-12 m CO (1–0) observations that mapped two distinct outflows from IRS2. Volgenau et al. (2002) claimed the detection of a binary system in IRS2 using BIMA, but no results (e.g., spatial separation and image) are reported as yet. Other studies (e.g., Tobin et al. 2007) have referenced Volgenau et al. (2002) and Volgenau (2004) as stating that IRS2 is part of a binary system with a companion with about 10 ′′ to the northwest. We would have expected to detect this presumed companion in our SMA images, which have a synthesized beam of 3′′ (see Figure 4), but we do not see evidence in our SMA dust continuum maps. Moreover, we do not find any evidence of this presumed companion in the IRAC and MIPS images, nor it is detected in the 450 m SCUBA map (with a 8′′ beam, see Fig. 2). We therefore consider IRS2 as a single source here. In fact, the structures of the outflow from IRS2 can be explained without the need to invoke the unseen binary companion (see Figures 3 and 4). Most of the structures seen at redshifted velocities appear to delineate the walls of the 50 deg-wide outflow cavities, while the elongated redshifted emission along the outflow axis most probably traces the dense collimated part of the outflow, as seen in other sources (e.g., Santiago-García et al. 2009) and predicted by so-called ‘unified’ outflow model (e.g., Shang et al. 2007) (see Fig. 4). More details about the IRS2 outflow will be presented in another paper (Arce et al., in preparation).
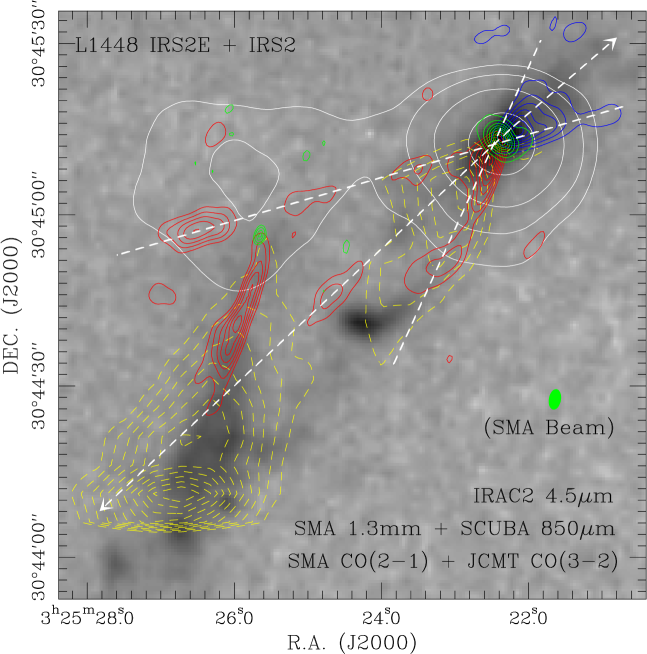
Figure 4 shows the velocity-integrated intensity map of the SMA 12CO (2–1) emission of L1448 IRS2E and IRS2. To the south of IRS2E, the collimated redshifted CO lobe ( 40′′ or 9600 AU in length) is spatially coincident with the infrared jet detected in the IRAC images and the CO (3–2) red emission detected at the JCMT. The orientation and morphology of this CO lobe suggest that it is neither part of the cavity wall of the IRS2 extended outflow nor part of the molecular jet from IRS2. These results indicate that L1448 IRS2E, a cold core with no detectable infrared emission, is driving a molecular outflow. Nevertheless, further observations, e.g., short-spacing data, are needed to recover the missing flux of extended structure, and to improve the quality of the outflow maps.
Assuming that the 12CO (2–1) line emission is optically thin, the outflow mass of L1448 IRS2E is derived with the standard manner (e.g., Cabrit & Bertout 1990). In the calculations, we assume LTE conditions and an excitation temperature of 20 K (the values in the range of 1050 K modify the calculations by less than a factor of 2). The derived outflow mass of IRS2E is about 2 10-3 . For other properties relying on a knowledge of the outflow velocity (i.e., age , momentum , energy , force , and mechanical luminosity ), we adopt a value of 25 km s-1, where we assume that the outflowing gas is moving at the maximum observed velocity. We obtain 1800 yr (assuming a lobe size of 9600 AU), 0.05 km s-1, 1.2 1043 ergs, 2.5 10-5 km s-1 yr-1, and 0.05 , without correcting for the unknown inclination of the outflow with respect to the plane of the sky. The outflow mass-loss rate out, estimated directly from the mass and age , is 1.0 10-6 yr-1. We note that all these outflow parameters refer only to the compact outflows detected in the SMA maps and thus represent lower limits.
4 DISCUSSION
4.1 Spectral Energy Distribution
Table 1 lists the (sub-) mm fluxes of L1448 IRS2E, estimated from the SCUBA, Bolocam, and SMA images. Since there is no local emission peak at the position of the SMA compact source in the SCUBA/Bolocam images (see Fig. 2), the estimated fluxes per beam around IRS2E in these images represent conservative upper limits to the fluxes from the embedded source. The 3 upper limits in the images are also listed in Table 1. Based on these data points, we constructed the spectral energy distribution (SED) of IRS2E (plot not shown here). To estimate the luminosity of IRS2E, we first interpolated and then integrated the SED (all the upper limits were used), always assuming spherical symmetry. Interpolation between the flux densities was done by a 2 single-temperature grey-body fit to all points at 70 m, using the same method as described in Chen et al. (2008). A simple logarithmic interpolation was performed between all points at 70 m. The estimated bolometric luminosity of L1448 IRS2E is less than 0.1 .
Although only an upper limit to the bolometric luminosity could be derived, we can still use it to further constrain the evolutionary stage of L1448 IRS2E. If we assume a steady mass-accretion rate given by = 0.975/ (Shu 1977), where is the effective sound speed, for a gas temperature of 10 K the accretion rate is 2 10-6 yr-1. The accretion luminosity is calculated as = /, where is the stellar mass and is the stellar radius. The bolometric luminosity being 0.1 implies a protostellar mass of 0.01 , assuming a radius of 2 . The age of a 0.01 ‘protostar’ under the assumption of a constant mass-accretion rate of 2 10-6 yr-1 is then calculated to be 5000 yr, which is consistent with the outflow age estimated above ( 1800 yr).
The estimated low luminosity and age suggest that L1448 IRS2E is a very young object, in which star formation has just started. Nevertheless, it must be noted that uncertainties remain in our estimates due to the limited observations available. More information, such as Herschel Space Observatory imaging at 75300 m, is needed to constrain the SED of L1448 IRS2E in order to address more precisely its evolutionary status.
4.2 Comparisons to Prestellar, Class 0, and VeLLO Objects
Comparison to Prestellar Cores: Prestellar cores are dense (H 104–106 cm-3) cores which are self-gravitating and evolve toward higher degrees of central condensation, but no central hydrostatic protostellar object exists yet within the core (André et al. 2000; 2008). Although the properties of L1448 IRS2E are still poorly known, its observed narrow width of the NH3 line ( 0.16 km s-1; Rosolowsky et al. 2008), as well as the fact that no point-like source is detected in the images, resemble the properties of prestellar cores (see André et al. 2008). However, as suggested by the SMA CO (2–1) observations, L1448 IRS2E appears to drive a molecular outflow, which implies ongoing accretion onto a central condensation and has never seen before in prestellar cores. Furthermore, the estimated ratio of [C18O(10)] (Hatchell et al. 2005) to [N2H+(10)] (Kirk et al. 2007) in the IRS2E core is 0.26, similar to that of ‘evolved’ prestellar cores, like L1544 (see Tafalla 2005), which suggests that the IRS2E core is chemically evolved and probably already passed the last stage of the prestellar phase.
Comparison to Class 0 Objects: Class 0 objects are the youngest accreting protostars with an age of a few 104 yr. These objects are in an early evolutionary stage, right after point mass formation, when most of the mass of the system is still in the surrounding dense core/envelope (André et al. 2000). They represent the truly hydrostatic protostellar objects (i.e., the second core) formed in dense cores. So far at least 50 Class 0 protostars have been identified (André et al. 2000; Froebrich 2005). Most of them are detectable in the images (at least in the MIPS bands), and are associated with strong submm and mm dust continuum emission (in both single-dish and interferometric maps). Although the collimated outflow from IRS2E possesses the typical properties of an outflow from a Class 0 protostar (see Arce et al. 2007), an obvious difference between L1448 IRS2E and known Class 0 protostars (e.g., L1448C, IRS3, and IRS2) is that IRS2E is not visible in the sensitive images, has weak dust continuum emission, and consequently has an extremely low bolometric luminosity ( 0.1 ). The estimated age of L1448 IRS2E (a few 103 yr) is also much less than those of the Class 0 protostars, suggesting that IRS2E is younger (less-evolved) than Class 0 protostars.
Furthermore, we compare L1448 IRS2E to another source in the Perseus molecular cloud: SVS 13B (see Chen et al. 2009 and references therein). Like L1448 IRS2E, SVS 13B has no point-like infrared emission at wavelengths from 3.6 to 70 m in the images (also c2d data). However, it must be noted that SVS 13B is located 15′′ to the south of the bright Class I object SVS 13A, and thus the detection limits in the images around SVS 13B are about three times worse than those in the L1448 images (because the imaging backgrounds around SVS 13B were raised by the bright source SVS 13A). Interestingly, SVS 13B is also driving a collimated outflow seen in the high angular resolution SiO and CO images (Bachiller et al. 1998; 2000). In contrast to L1448 IRS2E, SVS 13B has much stronger dust continuum emission at submm and mm wavelengths, and correspondingly has much higher gas mass ( 1 ) and bolometric luminosity ( 1 ). In addition, the kinematic properties of SVS 13B, e.g., fast rotation and subsonic turbulence (see Chen et al. 2009), are similar to those of Class 0 protostars (e.g., Chen et al. 2007). Therefore, SVS 13B is very likely more evolved than L1448 IRS2E and has already formed an extremely young Class 0 protostar.
Comparison to Known VeLLOs: The extremely low luminosity of L1448 IRS2E is similar to what is seen in the so-called very low luminosity objects (VeLLOs), an interesting subset of embedded, low-luminosity protostars (see Dunham et al. 2008 and references therein). However, non-detection at both 24 and 70 m bands distinguishes L1448 IRS2E from all VeLLOs revealed thus far (Dunham et al. 2008). Direct observations, together with radiative transfer modelling, have shown that young (sub-) stellar objects have already formed in these VeLLOs. In contrast, there is yet no clear evidence for the presence of a protostar in L1448 IRS2E, even though the sensitivities of the images of L1448 IRS2E are comparable to those used to detect the known VeLLOs (see Dunham et al. 2008 and references therein).
The evolutionary status and eventual final state of VeLLOs are still unclear. Some of them, e.g., IRAM 04191+1522 (see Dunham et al. 2006), represent typical Class 0 low-mass protostars, while others, e.g. L1014-IRS (see Bourke et al. 2005), could represent precursors of sub-stellar objects (i.e., proto-brown dwarfs). In the case of L1448 IRS2E, it is more likely that we are catching the very first moments of low-mass star formation because L1448 IRS2E already has about 0.04 of gas estimated from the SMA dust continuum observations, and more gas in the outer envelope/core can continue accreting onto it. If we assume a steady accretion rate and a core-to-star efficiency of 15–30% (Evans et al. 2009), then it is very probable that a low-mass star ( 0.1 ) will eventually form in the L1448 IRS2E core.
4.3 A Candidate First Hydrostatic Core
The observational detection of the first hydrostatic core is of prime importance for understanding the early evolution of star-forming dense cores and the origin of outflows. Encouraged by these facts, searches for the first core have been undertaken over the past decade. Based on the HCO+/H13CO+ observations, Onishi et al. (1999) suggested that L1521F could be a first core candidate, but observations soon found that L1521F harbors a low luminosity protostar (Bourke et al. 2006). More recent studies suggest that the evolutionary stage of L1521F is similar to or younger than the Class 0 phase, and may be consistent with the early second collapse phase (Shinnaga et al. 2009; Terebey et al. 2009). Another promising object was Cha-MMS1, suggested by Belloche et al. (2006) from the measurement of the deuterium fractionation. However, a mid-infrared source was detected by MIPS observations, indicating a compact hydrostatic object had already formed in Cha-MMS (see Belloche et al. 2006 for more details).
Based on the SMA and observations, we find that source L1448 IRS2E has the following characteristics: (1) it is not visible in the sensitive infrared images (from 3.6 to 70 m); (2) has very weak (sub-) mm dust continuum emission, and consequently has an extremely low bolometric luminosity ( 0.1 ); and (3) appears to drive a molecular outflow. Comparisons with prestellar cores and Class 0 protostars suggest that L1448 IRS2E is more evolved than prestellar cores but less evolved than Class 0 protostars, i.e., at a stage intermediate between prestellar cores and Class 0 protostars. These results are consistent with the theoretical predictions in the RHD/MHD models for the first hydrostatic core (see Section I)444In the MHD model of Machida et al. (2008), the outflow driven by the first core has a slow speed of 3 km s-1. However, in their models the first core only has a mass of 0.01 at the end of the calculations. Since the first core will grow in mass by at least 1–2 orders of magnitude in the subsequent gas accretion phase, the relatively high outflow velocity of L1448 IRS2E ( 25 km s-1; about 8 times larger than that in the model) could be explained by the relatively larger (gas) mass of the L1448 IRS2E core ( 0.04 ), i.e., a deeper gravitational potential and a faster escape speed., making L1448 IRS2E the most promising first hydrostatic core candidate thus far.
However, it must be noted that the nature of source L1448 IRS2E is not definitive. More observations are needed to constrain its SED and to refine its outflow maps. Detections of other objects like L1448 IRS2E will be important for understanding the process of dynamical collapse and the origin of outflows. Sensitive surveys at wavelengths from far-infrared (e.g., ) to (sub-) mm continuum (e.g., SCUBA) are needed to search for more first core candidates in nearby clouds. We also speculate that some of the objects in the current sample of prestellar cores may already harbor first cores, which drive molecular outflows hidden within the extended cloud emission and are therefore not revealed in low resolution single-dish observations. A systematic high-resolution interferometric CO survey toward these cores is needed to search for potential outflow activity.
5 SUMMARY
We present SMA and observations of the low-mass, embedded dense core L1448 IRS2E. This core has no point-like infrared emission in the images, and shows weak emission in the SMA 1.3 mm dust continuum map ( 6 mJy). Consequently, it has an extremely low bolometric luminosity (less than 0.1 ). Interestingly, the SMA CO (2–1) images suggest that L1448 IRS2E is driving a collimated CO outflow (up to 25 km s-1), which is further supported by the IRAC images with regards to the morphology of the outflow. L1448 IRS2E represents so far the lowest luminosity source with a detectable molecular outflow. A comparison with prestellar cores and Class 0 protostars suggests that L1448 IRS2E is in an evolutionary stage between that of a prestellar core and a Class 0 protostar. Our results are consistent with the predictions of the theoretical models for the first hydrostatic core, making L1448 IRS2E thus far the most promising first hydrostatic core candidate. Further observations, such as Herschel Space Observatory imaging at 75300 m and short-spacing CO observations, are needed to study its properties and to address more precisely its evolutionary status. If the properties of L1448 IRS2E are validated by further observations, this would be the first confirmed detection of the first core stage of star formation.
References
- Andre et al. (2008) André, P., Basu, S., & Inutsuka, S.-I. 2008, in Structure Formation in Astrophysics, ed. G. Chabrier (Cambridge: Cambridge University Press), in press (arXiv: 0801.4210)
- André et al. (2000) André, P., Ward-Thompson, D., & Barsony, M. 2000, in Protostars and Planets IV, ed. V. Mannings, A. P. Boss, & S. S. Russell (Tucson: Univ. Arizona Press), 59
- Arce et al. (2007) Arce, H. G., Shepherd, D., & Gueth, F., et al. 2007, in Protostars and Planets V, ed. B. Reipurth, D. Jewitt, & K. Keil (Tucson: Univ. Arizona Press), 245
- Bachiller et al. (2000) Bachiller, R., Gueth, F., Guilloteau, S., Tafalla, M., & Dutrey, A. 2000, A&A, 362, L33
- Bachiller et al. (1998) Bachiller, R., Guilloteau, S., Gueth, F., et al. 1998, A&A, 339, L49
- Bally et al. (2008) Bally, J., Walawender, J., Johnstone, D., Kirk, H., & Goodman, A. 2008, in Handbook of Star Forming Regions, Volume I: The Northern Sky, ASP Monograph Publications, Vol. 4. ed, Reipurth, B., 308
- (7) Banerjee, R., & Pudritz, R. E. 2006, ApJ, 641, 949
- Belloche et al. (2006) Belloche, A., Parise, B., van der Tak, F. F. S. et al. 2006, A&A, 454, L51
- Boss & Yorke (1995) Boss, A. P., & Yorke, H. W. 1995, ApJ, 439, L55
- Bourke et al. (2005) Bourke, T. L, Crapsi, A., Myers, P. C. et al. 2005, ApJ, 633, L129
- Bourke et al. (2006) Bourke, T. L, Myers, P. C., Evans II, N. J. et al. 2006, ApJ, 649, L37
- Cabrit & Bertout (1990) Cabrit, S., & Bertout, C. 1990, ApJ, 348, 530
- Chen et al. (2008) Chen, X. P., Launhardt, R., & Bourke, T. L., Henning, Th., & Barnes, P. J. 2008, ApJ, 683, 862
- Chen et al. (2007) Chen, X. P., Launhardt R. & Henning, Th. 2007, ApJ, 669, 1058
- Chen et al. (2009) Chen, X. P., Launhardt R. & Henning, Th. 2009, ApJ, 691, 1729
- Davis et al. (2008) Davis, C. J., Scholz, P., Lucas, P., Smith, M. D., & Adamson, A. 2008, MNRAS, 387, 954
- Dunham et al. (2008) Dunham, M. M., Crapsi, A., Evans II, N. J. et al. 2008, ApJS, 179, 249
- Dunham et al. (2006) Dunham, M. M., Evans II, N. J., Bourke, T. L. et al. 2006, ApJ, 651, 945
- Enoch et al. (2006) Enoch, M. L., Young, K. E., & Glenn, J. et al. 2006, ApJ, 638, 293
- Evans et al. (2003) Evans II, N. J., et al. 2003, PASP, 115, 965
- Evans et al. (2009) Evans II, N. J., et al. 2009, ApJS, 181, 321
- Hatchell et al. (2007) Hatchell, J., Fuller, G. A., & Richer, J. S. 2007, A&A, 472, 187
- Hatchell et al. (2005) Hatchell, J., Richer, J. S., & Fuller, G. A. et al. 2005, A&A, 440, 151
- Hirota et al. (2008) Hirota, T., Bushimata, T., & Choi, Y. K., et al. 2008, PASJ, 60, 37
- Ho et al. (2004) Ho, P. T. P., Moran, J. M., & Lo, K. Y. 2004, ApJ, 616, L1
- Jorgensen et al. (2006) Jørgensen, J. K., Harvey, P. M., & Evans II, N. J. et al. 2006, ApJ, 645, 1246
- Kirk et al. (2006) Kirk, H., Johnstone, D., & Di Francesco, J. 2006, ApJ, 646, 1009
- Kirk et al. (2007) Kirk, H., Johnstone, D., & Tafala, M. 2007, ApJ, 668, 1042
- Larson (1969) Larson, R. B. 1969, MNRAS, 145, 271
- Launhardt & Henning (1997) Launhardt, R., & Henning, Th. 1997, A&A, 326, 329
- Machida et al. (2008) Machida, M., Inutsuka, S.-I., & Matsumoto, T. 2008, ApJ, 676, 1088
- Masunaga & Inutsuka (2000) Masunaga, H., & Inutsuka, S.-I. 2000, ApJ, 531, 350
- Masunaga et al. (1998) Masunaga, H., Miyama, S. M., & Inutsuka, S.-I. 1998, ApJ, 495, 346
- O’Linger et al. (2006) O’Linger, J., Wolf-Chase, G., Barsony, M., & Ward-Thompson, D. 1999, ApJ, 515, 696
- Onishi et al. (1999) Onishi, T., Mizuno, A., & Fukui, Y. 1999, PASJ, 51, 257
- Ossenkopf & Henning (1994) Ossenkopf, V., & Henning, Th. 1994, A&A, 291, 943
- Rebull et al. (2007) Rebull, L. M., Stapelfeldt, K. R., Evans II, N. J. et al. 2007, ApJS, 171, 447
- Reipurth et al. (2007) Reipurth, B., Jewitt, D., & Keil, K. 2007, ed., Protostars and Planets V (Univ. Arizona Press)
- Rosolowsky et al. (2008) Rosolowsky, E. W., Pineda, J. E., Foster, J. B. et al. 2008, ApJS, 175, 509
- Santiago-García et al. (2009) Santiago-García, J., Tafalla, M., Johnstone, D., & Bachiller, R. 2009, A&A, 495, 169
- Sault et al. (1995) Sault, R. J., Teuben, P. J., & Wright, M. C. H. 1995, in ASP Conf. Ser. 77, Astronomical Data Analysis Software and Systems IV, ed. R. A. Shaw, H. E. Payne, & J. J. E. Hayes (San Francisco: ASP), 433
- Shang et al. (2007) Shang, H., Li, Z.-Y., & Hirano, N. 2007, in Protostars and Planets V, ed. B. Reipurth, D. Jewitt, & K. Keil (Tucson: Univ. Arizona Press), 261
- Shinnaga et al. (2009) Shinnaga, H., Phillips, T. G., Furuya, R. S., & Kitamura, Y. 2009, ApJ, 706, L226
- Shu (1977) Shu, F. H. 1977, ApJ, 214, 488
- Tafalla (2005) Tafalla, M. 2005, in Astrochemistry: Recent Success and Current Challenges, IAU Symposium 231, ed. D. C. Lis, G. A. Blake, & E. Herbst, 17
- Terebey et al. (2009) Terebey, S., Fich, M., & Noriega-Crespo, A., et al. 2009, ApJ, 696, 1918
- Tobin (2007) Tobin, J. J., Looney, L. W., Mundy, L. G., Kwon, W., & Hamidouche, M. 2007, ApJ, 659, 1404
- Tomisaka (2002) Tomisaka, K. 2002, ApJ, 575, 306
- Volgenau (2004) Volgenau, N. 2004, PhD thesis
- Volgenau et al. (2002) Volgenau, N., et al. 2002, BAAS, 34, 1216
- Wolf-Chase et al. (2000) Wolf-Chase, G. A., Barsony, M., & O’Linger, J. 2000, AJ, 120, 1467
- Young et al. (2004) Young, C. H., Jørgensen, J. K., & Shirley, Y. L., et al. 2004, ApJS, 154, 396
| Aperture | ||
|---|---|---|
| (m) | (mJy) | (arcsec) |
| 3.6 | 0.021a | 1.2 |
| 4.5 | 0.027a | 1.2 |
| 5.8 | 0.16a | 1.2 |
| 8.0 | 0.72a | 1.2 |
| 24 | 18a | 2.5 |
| 70 | 120a | 20 |
| 160 | 2700a | 20 |
| 450 | 1200b | 10 |
| 850 | 400b | 14 |
| 1100 | 300b | 30 |
| 1300 | 6c | 3 |