XMM-Newton Observation of the Northwest Radio Relic Region in Abell 3667
Abstract
Abell 3667 is the archetype of a merging cluster with radio relics. The NW radio relic is the brightest cluster relic or halo known, and is believed to be due to a strong merger shock. We have observed the NW relic for ksec of net XMM time. We observe a global decline of temperature across the relic from 6 to 1 keV, similar to the Suzaku results. Our new observations reveal a sharp change of both temperature and surface brightness near the position of the relic. The increased X-ray emission on the relic can be equivalently well described by either a thermal or nonthermal spectral model. The parameters of the thermal model are consistent with a Mach number shock and a shock speed of 1200 km s-1. The energy content of the relativistic particles in the radio relic can be explained if they are (re)-accelerated by the shock with an efficiency of 0.2%.. Comparing the limit on the inverse Compton X-ray emission with the measured radio synchrotron emission, we set a lower limit to the magnetic field in the relic of 3 . If the emission from the relic is non-thermal, this lower limit is in fact the required magnetic field.
Subject headings:
galaxies: clusters: general — galaxies: clusters: individual (Abell 3667) — intergalactic medium — radio continuum: general — shock waves — X-rays: galaxies: clusters1. Introduction
Many clusters of galaxies appear to be forming at the present time through massive cluster mergers. Major cluster mergers are the most energetic events which have occurred since the Big Bang, involving total energies of ergs. Merger shocks driven into the intracluster gas are the primary heating mechanism of the gas in massive clusters. Chandra and XMM-Newton X-ray observations have provided beautiful images and spectra of merger hydrodynamical effects, including cold fronts and merger bow shocks (e.g., Markevitch et al. 2000, 2002). However, the number of clusters with well-observed merger shocks is limited.
Enigmatic extended cluster radio sources with very steep spectra and no clear optical counterparts have been known for over 30 years (Willson 1970, for a review see Feretti 2008). These sources occur in a small fraction of rich galaxy clusters. They have such steep radio spectra that they can be detected only at lower frequencies (5 GHz). Fairly symmetric sources which are projected on the cluster center are often referred to as “radio halos” (e.g., the Coma cluster; Deiss et al. 1997), while similar elongated sources usually located on the cluster periphery are called “relics.” The extremely steep radio spectra flatten somewhat at low frequencies, which suggest that the relativistic electrons have undergone significant losses due to synchrotron and inverse Compton (IC) emission.
In every case, such diffuse cluster radio sources have been found in irregular clusters which are apparently undergoing mergers. This suggests that the radio emitting electrons are accelerated or re-accelerated by shocks or turbulence associated with these cluster mergers. One possible theoretical picture is that the radio halos are accelerated by turbulence following the passage of merger shocks, while the relics are the direct result of merger shock acceleration (e.g., Feretti 2008).
The same relativistic electrons which produce the radio synchrotron radiation will produce hard X-ray (HXR) emission by inverse Compton scattering of Cosmic Microwave Background (CMB) photons. However, the detection of this emission has been difficult and remains controversial (e.g., compare Fusco-Femiano et al. 2004; Rossetti & Molendi 2004).
In many ways, Abell 3667 is the ideal site to study mergers and radio relics. It is a very bright X-ray cluster at a low redshift (). The ROSAT and ASCA observations showed that it is a spectacular merger with shock heated gas (Markevitch et al. 1999). The galaxy spatial and redshift distributions are also strongly bimodal (Owers et al. 2009). A3667 was one of the first clusters in which a merger cold front was found with Chandra (Vikhlinin et al. 2001b, a), and the term was coined based on the A3667 observations. The very sharp density and temperature gradients in this cold front have provided very strong limits on the role of transport processes (like heat conduction) in clusters. Subsequent Chandra and XMM/Newton observations (Mazzotta et al. 2002; Briel et al. 2004) have provided spectacularly detailed images and information on the dynamics of the merger. However, most of the Chandra and XMM observations study the interior regions of the cluster, not the outer regions near the radio relics.
Abell 3667 contains a pair of curved cluster radio relics (Röttgering et al. 1997). Their location on either side of the cluster center at 1.8Mpc distance () and sharp, inwardly curved outer edges are exactly what is expected for merger shocks and shock particle acceleration. Models which reproduce the optical and inner X-ray properties of A3667 predict shocks at or near these locations (Roettiger et al. 1999; Ricker & Sarazin 2001). The radio spectra steepen with distance from the outer edge (Röttgering et al. 1997) as expected if the electrons are accelerated there, and the higher energy electrons lose energy due to synchrotron and IC emission as they are advected away from the shock.
The northwest radio relic in Abell 3667 is the brightest (highest flux) cluster radio relic or halo source which is known, with a flux at 20 cm of 3.7 Jy (Johnston-Hollitt 2004). It is also one of the largest relics, with a total extent of 33′ or 2.1 Mpc. Since the electrons which produce the IC HXR emission are basically the same ones which emit radio synchrotron, for a given magnetic field the HXR flux should be nearly proportional to the radio flux. Thus, Abell 3667 might be expected to be the brightest nonthermal (NT) cluster hard X-ray source. Since this relic is at a large projected radius from the cluster center, if anything the magnetic field should be lower than in other objects, implying an even larger HXR flux.
We have a long Suzaku observation of the NW radio relic region of Abell 3667 with Suzaku (Nakazawa et al. 2009), as well as two observations of more central regions of the cluster. While hard X-ray emission is seen coming from the cluster center with HXD intrument (Nakazawa et al. 2009), it could be thermal emission, while there is no clear Suzaku detection of inverse Compton hard X-ray emission from the NW radio relic, given the systematic uncertainties in the non-X-ray background and thermal emission from the cluster. Our Suzaku observation also provides a CCD X-ray image of a portion of the radio relic region with the X-ray Imaging Spectrometer (XIS). However, this covers only a part of the region of the radio relic and possible merger shock.
Here, we present the results of a new XMM-Newton observation of Abell 3667 which is centered on the NW radio relic. We assume a concordance cosmology with km s-1 Mpc-1, , and . At the redshift of Abell 3667 of , the angular diameter distance is Mpc, and 1′ corresponds to 61.8 kpc. For a mean cluster temperature of 7.2 keV, the virial radius should be Mpc (MFS+98). Unless otherwise specified, we provide confidence intervals at the 68% level.
2. Observation and Data Analysis
There have been seven previous XMM-Newton observations of Abell 3667. Six of these were discussed in Briel et al. (2004), where these observations were merged to make a mosaic of the center of the cluster. There was a subsequent observation (OBSID 0206850101) of the center of the cluster, which we analyzed and added to the mosaic for completeness. All these observations, however, cover only the central part of the cluster. In order to study the characteristics of the X-ray emission at the location of radio relic, we proposed for an additional XMM-Newton observation, with the pointing direction selected to ensure a robust background subtraction can be performed by leaving enough area beyond the location of relic. The observational ID of this pointing is 0553180101, and it was performed during XMM-Newton orbit 1620. In this paper, we will concentrate on the results obtained only from this observation. The total scheduled time of observation was 55 ksec. We used XMMSAS (Watson et al. 2001) version 7.3 for the standard data reduction. After producing the event files, we have applied a strict light curve cleaning in order to ensure that we retained only the periods with the lowest and the most stable background. The resulting net exposures after the cleaning are 37, 47 and 44 ksec for the pn, MOS1, and MOS2 detectors, respectively. The medium filter has been used for all instruments, for consistency with the previous observations of the cluster. Extended full frame mode has been used for the pn to reduce the effect of out-of-time events. In producing the mosaic, we have checked whether any of the ccds exhibit unusually high background, identifying none.
3. X-ray Image Analysis
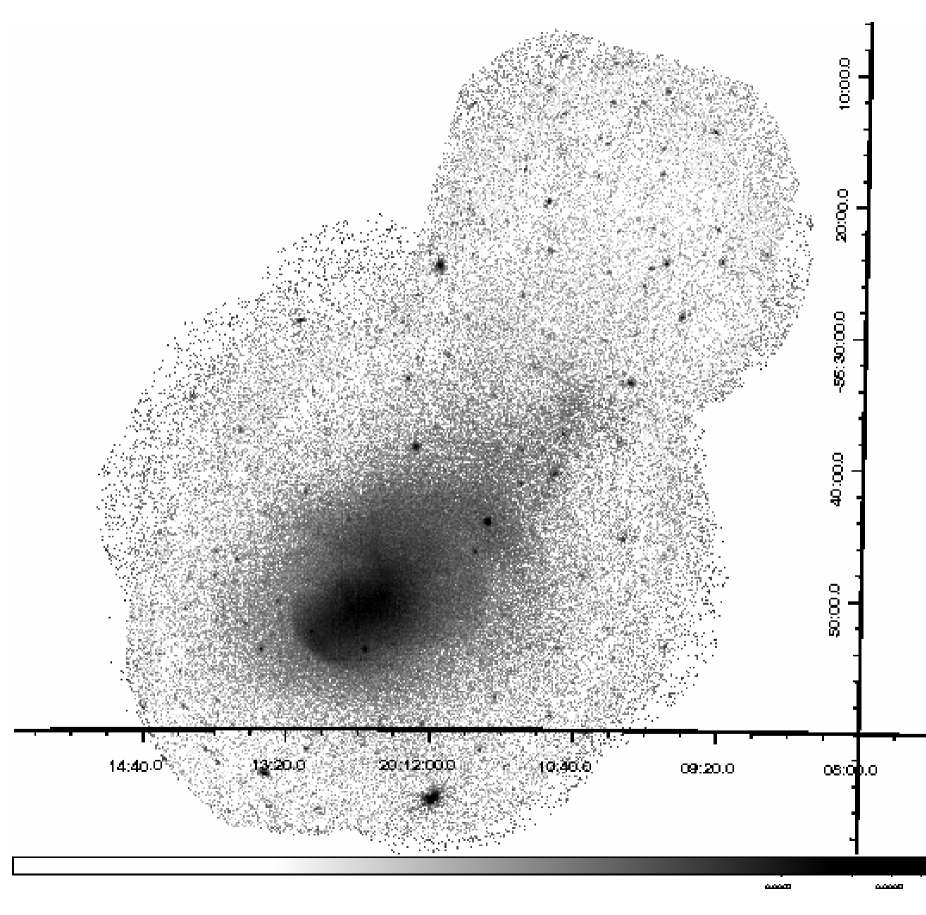
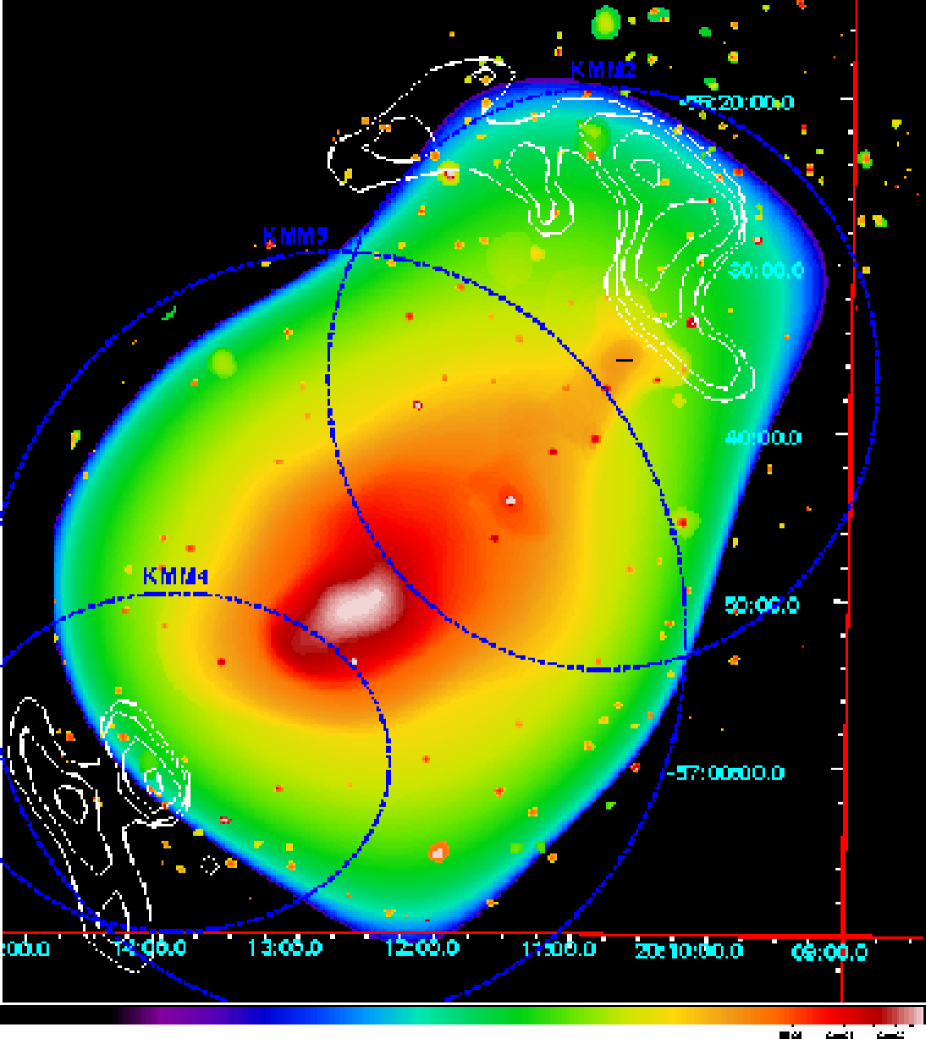
We used the quadruple background subtraction technique of Finoguenov et al. (2007) to produce the mosaic image of A3667. Due to high level of cluster emission, several iterations have been performed in order to locate and mask out the bright parts of the cluster. We used both pn and MOS data in producing the mosaic image. Figure 1 shows the mosaic image made with the new observation and the previous data from XMM in the 0.5–2 keV band. It has been corrected for background, exposure, vignetting, and out-of-time events, and excluded the 1.4–1.6 keV energy band due to the strong background Al line. Comparison to previous XMM X-ray images (Briel et al. 2004; Nakazawa et al. 2009) shows the significant gain in spatial coverage achieved with the new observation. The image in Figure 2 shows a corresponding wavelet reconstruction using the method of Vikhlinin et al. (1998) and applying the image reconstruction technique of Finoguenov et al. (2009) to remove the wings of point sources.
To study the spatial correlation of the X-ray emission to the radio relic, we used the SUMMS radio data. SUMSS is a deep radio survey of the entire sky south of declination degrees, made using the Molonglo Observatory Synthesis Telescope, operating at 843 MHz and recording right-circular polarization (Bock et al. 1999). The beam size of these radio images is 45″. We used the data which are a part of SUMSS release 0.2. To characterize the radio relics, we apply the wavelet reconstruction of radio image, remove point-like features and display the contours at the 1, 3, 9 and 20 mJy/beam levels in Figure 2. The wavelet reconstruction of the XMM image of Abell 3667 shows an interesting coincidence between the extent of the significant X-ray emission in the 0.5–2 keV detected on the wavelet scales upto and the outer edge of the radio relic. The detection stops from the end of the data, compared to on the opposite edge of the cluster. As discussed in § 1, this is the expected location of the cluster merger shock, if the relic was produced by shock acceleration or re-acceleration of relativistic electrons.
Our previous Suzaku XIS image of this region did not show this edge (Nakazawa et al. 2009), which we believe to be a result of contamination by point sources which were not individually resolved due to the large Suzaku XIS point spread function (PSF). Many of these point sources are seen in Figures 1 & 2. In addition there is a steep gradient in the cluster emission to the southeast, associated with the major subcluster, which is smeared by the large Suzaku XIS PSF and covers the relic. To test the effects of these features and the Suzaku XIS PSF on the Suzaku image, and the consistency of the Suzaku and XMM data, we blurred the XMM image using a Gaussian with a sigma of 1′, which is a crude approximation to the Suzaku XIS PSF. We found that this blurred image matched the actual Suzaku XIS image fairly well, and the surface brightness discontinuity observed with XMM at its full resolution is no longer apparent in the smeared image.
A more detailed examination of the XMM image shows in addition to the X-ray peak associated with the main cluster, another peak, with coordinates of the X-ray center are RA , Decl. (J2000). The available results of the spectroscopic survey of the cluster (Johnston-Hollitt et al. 2008; Owers et al. 2009) allows us to identify this peak with the major subcluster in A2667, KMM2, found by (Owers et al. 2009), which plays a key role in the dynamics of the system. In fact the relics are not symmetric with respect to any of the galaxy component but the region between KMM2 and KMM5, indicating that within the forward shock hypothesis of their origin, it is the recent passage of KMM2 through KMM5 that is responsible for their appearence.
![[Uncaptioned image]](/html/1004.2331/assets/x3.png)
The zones masked out from both the surface brightness and spectral analysis. We removed all significant point sources, as well as the bulk of the cluster emission and the emission from the two northwest galaxy groups. The dashed box shows the region for surface brightness extraction presented in Fig.3. The black contours show the wavelet reconstruction of the SUMMS 843 MHz radio image in the region of radio relics. The contours are drawn at the 1, 3, 9 and 20 mJy/beam levels.
In order to avoid biased results caused by the possibly different temperature gas associated with this subcluster, we excluded the region from further analysis of both the cluster and relic emission, together with all the point and compact extended sources detected in the image. We used the wavelet images on spatial scales of 4, 8, 16, 32, and 64 arcsec to mask out such regions. Figure 3 shows all of the regions masked out from the surface brightness and spectral analysis.
In Figure 3, we show the X-ray surface brightness radial profile around the radio relic. We used the 1.6-4.0 keV band to extract the profile and use only pn data. The low-energy cut off has been selected to avoid any possible influence of the strong low-energy emission seen towards A3667 (Briel et al. 2004), which is likely of Galactic origin. The upper energy is selected to maximize the signal-to-noise, as at higher energies the background dominates. The background in the selected energy band is dominated by particle background which is not vignetted, and thus is roughly constant in surface brightness. We see a sharp drop in the surface brightness profile at the position of the outer edge of the relic, indicating that there is an association of this X-ray edge with the radio relic. A small peak in the radio surface brightness at distance from the relic is accosiated with two radio point sources. We associate a corresponding low-significance enhancement in X-rays is two sources below the detection threshold.
![[Uncaptioned image]](/html/1004.2331/assets/x4.png)
The surface brightness profile of A3667 in the 1.6-4.0 keV band extracted along the direction from the cluster center (negative distance to the relic) to the northwest. The radial units are arcminutes. The location of the outer edge of the relic is at 0. Point sources were excised. The dashed line shows the surface brightness profile of radio emission, extracted in the same fashion from the 843 MHz SUMMS data. One sees a sharp drop in the surface brightness at the position of the relic and a much flatter behaviour both at small and at large X-axis values.
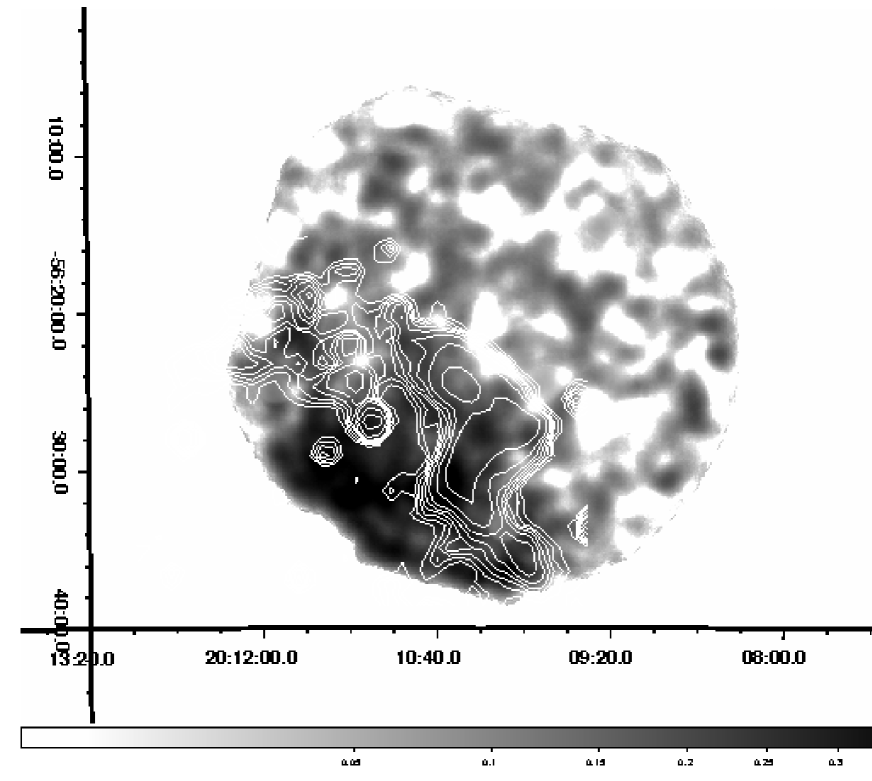
In Figure 3, we show the combined pn+MOS XMM-Newton image in the 1.6-4 keV band for the region immediately around the radio relic. There is a clear association of the surface brightness discontinuity with the location of the outer edge of radio relic. This image was not corrected for vignetting to show that the result is not affected by the details of background subtraction (vignetting correction in combination with undersubtraction of the background can lead to enhancements at the edge of the detector). The image is smoothed with a 32″ Gaussian after the removal of point sources. The X-ray image appears to follow the radio relic in some detail. In particular, the X-ray surface brightness discontinuity traces the outer, sharp edge of the radio relic, including the indentation at the west end of the relic. To quantify the trends seen in Figure 3, we proceed with the spectral analysis.
| Norm.aaNormalization of the APEC thermal spectrum, which is given by , where is the redshift, is the angular diameter distance, is the electron density, is the ionized hydrogen density, and is the volume of the region. | Area | (2–5 keV) | |||||
|---|---|---|---|---|---|---|---|
| Zone ID | (keV) | () | (arcmin2) | ( ergs/s/cm2/arcmin2) | Comment | ||
| 1 | 0.90 | 297 | 60.4 | background - main | |||
| 2 | 0.90 | 111 | 23.3 | relic back-1 | |||
| 3 | 0.82 | 75 | 21.8 | relic back-2 | |||
| 4 | 1.06 | 149 | 102.1 | relic front | |||
| 5 | 1.33 | 54 | 28.0 | relic back-3 | |||
| 6 | 0.96 | 131 | 80.8 | cluster near relic | |||
| 7 | 0.89 | 91 | 63.2 | cluster near relic | |||
| 8 | 1.10 | 100 | 82.4 | cluster near relic | |||
| 9 | 1.19 | 49 | 56.9 | zone in front of relic | |||
| 10 | 1.03 | 441 | 765.2 | zone in front of relic | |||
| 11 | 1.06 | 137 | 259.2 | zone in front of relic | |||
| 12 | 1.05 | 290 | 503.6 | eastern relic | |||
| 13 | 0.91 | 245 | 476.6 | zone west of relic | |||
| 14 | 0.92 | 136 | 340.3 | background side | |||
| 15 | 1.38 | 49 | 75.7 | zone behind the relic |
| Zone ID | Norm.aaThe normalization of the power-law is the photon flux at 1 keV in units of photons cm-2 s-1 keV-1. | comment | |||
|---|---|---|---|---|---|
| 2 | 0.91 | 111 | relic back-1 | ||
| 3 | 0.79 | 75 | relic back-2 | ||
| 4 | 1.09 | 149 | relic front | ||
| 5 | 1.28 | 54 | relic back-3 |
4. Spectral Analysis
In order to investigate the origin of the break in the surface brightness, we extracted the X-ray spectra from several regions around the radio relic. The regions were designed to encompass the zone directly in front of the relic, much of the relic itself, as well as other regions tracing the possible azimuthal variations, and cluster radial temperature profile. These spectral extraction regions are shown in Figure 4. We used the spectral range of 0.4-14 keV in the spectral analysis. We started by fitting the most distant zone (from the cluster center) covered by XMM observation. The energies above 7 keV where clearly dominated by the residual particle background, which we fit with a background (not convolved with the effective area of the telescope) power law model. The residual emission was found to consists of a keV thermal emission we associate with the Galactic foreground emisson and a significant 1 keV component, consistent with the Suzaku XIS results, which we therefore associate with the A3667 cluster emission. The outmost zone is also the largest zone and the constraints on the background components are the best there, so we fixed the slope of the particle background and the temperature of the soft emission to the values found there, while the normalization of both these components was left free to vary. We found this background/foreground model to be a satisfactory fit, and the reported additional thermal and non-thermal components we associate with the cluster are clearly in excess of it. Since no spatial variation in the particle background spectral shape has been reported [except for the case of bright MOS chips (Kunz & Snowden 2008), which we associated with electronic noise and not with particle background itself], we are certain that the reported results correspond to a detection of a change in the intrinsic properties of the cluster emission.
![[Uncaptioned image]](/html/1004.2331/assets/x6.png)
The spectral extraction regions for the NW radio relic. The numbers correspond to the Zone IDs in Tables 1 & 2.
The results for the spectral fits for the cluster emission components are given in Tables 1 & 2. The first table gives the result of purely thermal spectral fits using APEC plasma code (Smith et al. 2001), while the fits in Table 2 include nonthermal power-law components.
We first consider the purely thermal fits to the spectra. The results are summarized in Table 1, where the columns give the Zone ID from Figure 4, the temperature , the normalization of the APEC thermal model, the reduced chi-square , the number of degrees of freedom in the fit , the projected solid angle of the region excluding the area masked to avoid point sources, the average X-ray surface brightness of the region in the 1.6-4.0 keV band, and a comment on the reason for choosing this region. The element abundance has been set to 0.2 solar (typical for cluster outskirts), as no strong lines have been seen in the emission to constrain it.
![[Uncaptioned image]](/html/1004.2331/assets/x7.png)
The reconstructed surface brightness in the 2–5 keV band using the results of the spectral fits, and directly fitting for the spectral shape of the background without assuming a flat spatial distribution. The grey scale shows the flux level in units of ergs s-1 cm-2 arcmin-2. We note that an enhancement in surface brightness is located on the relic, as seen by the difference in regions on either side of the relic. The larger circle shown is centered on the cluster center. The smaller circle is centered on the main subcluster.
As one moves inward in radius towards the relic, there is initially a slow rise in the temperature, from 1 to 2 keV, followed by an abrupt increase in the temperature from keV in front of the relic to keV on the relic. Figure 4 shows the average X-ray surface brightnesses of each of the regions plotted along with contours showing the radio relic. We confirm the dent-like structure of the X-ray emission, seen in Fig.3. Figures 3 & 4 both show that there is also a jump in the X-ray surface brightness inward of the outer edge of the radio relic. The value of the jump is higher in Figure 4, compared to Figure 3, which we attribute to the presence of the dent in the X-ray emission, which was separated though the selection of spectral extraction zones, but not in the extraction of the surface brightness profile.
The combination of the jump in the temperature and the jump in the surface brightness (which is determined mainly by the gas density) are consistent with a location of the shock at or near the front of the relic. The parameters of the shock are discussed in the next section. In any case, whatever its origin, the hardening of the spectrum at the front of the relic is significant at better than the 95% confidence level.
Alternatively, the jump in the X-ray surface brightness and spectral hardening might also be attributed to the non-thermal emission associated with the relic. To address this possibility, we also fit the spectra in the regions corresponding to the projected position of the NW radio relic with a non-thermal power-law spectrum. The results of these fits are summarized in Table 2, where the columns give the Zone ID from Figure 4, the power-law photon spectral index , the normalization of the power-law which is the flux at 1 keV, the reduced chi-square , the number of degrees of freedom in the fit , and the same comment on the location of the region as given in Table 1. Note that the photon spectral index values are generally lower than might have been expected from the steep radio spectrum of the radio relic. The average radio spectral index between 85 MHz and 2.3 GHz for the whole relic is (Röttgering et al. 1997), which corresponds to . However, the fits in Table 2 are for pure power-law emission. Almost certainly, there is also some thermal emission from the intracluster gas, which may affect the fitted spectral index of the power-law. The limited statistics in the observed X-ray spectra of these regions do not allow for more complicated thermal plus power-law models. Also, for reasonable values of the magnetic field, the X-ray emission in the relatively soft XMM band would come from lower energy relativistic electrons than produce most of the observed radio emission. The curvature in the observed radio spectrum indicates that the electron energy spectrum flattens at lower energies. A steep radio spectrum at high frequencies is expected as a consequence of the radiative losses by the relativistic electrons.
Unfortunately, as a result of the limited statistics in the spectra of these faint regions in the outer parts of this cluster, it isn’t possible at this time to determine whether thermal or non-thermal models provide a better fit to the data. If one considers zone 4 as an example, the thermal model gave a very slightly better fit, with a reduced chi-square of , as compared to the power-law model which had . The -test indicates that both models are acceptable. The difference becomes even less significant if one combines the fits to zones 2–5.
5. Discussion
With the new XMM data on the regions around the northwest radio relic in Abell 3667, we have found a discontinuity in the X-ray surface brightness at the outer edge of the radio relic. This increase in the X-ray surface brightness inside of the relic compared to outside also corresponds to an abrupt hardening in the X-ray spectrum. If the X-ray emission from the relic is thermal emission from intracluster gas, then this feature corresponds to a jump in the density, temperature, pressure, and specific entropy of the gas. The most likely origin of such a jump would be a merger shock in the cluster.
One can estimate the shock Mach number from the compression behind the shock. From the X-ray surface brightness on either side of the surface brightness discontinuity, we estimate that the pre-shock and post-shock electron densities are cm-3 and cm-3, respectively. This gives a shock compression of , where the subscripts 1 and 2 refer to pre-shock and post-shock gas. For a shock, the shock jump conditions give
| (1) |
This gives a shock Mach number of . The effects of projection, the finite width of the regions used to determine the surface brightness, the XMM PSF, and the likely curvature of the shock front mean that this is probably an underestimate.
One can also estimate the Mach number from the temperature jump at the shock front. Using the values for zones 10 and 4 for the pre-shock and post-shock gas, we have a temperature jump of . For a shock, the jump conditions give
| (2) |
Using the observed temperature jump and propagating the errors gives . Because of the larger errors in the temperature, the uncertainty in this value is large.
If one takes the weighted mean of the Mach number from the shock compression and shock temperature front, one finds . Using this value, the shock compression is . The pre-shock sound speed is km s-1 which gives a shock speed of km s-1. Merger shocks of similar and slightly higher strength has been detected in the bullet cluster and A520 (Markevitch et al. 2002; 2005). However, the location of the shocks in these clusters is in the core region, while in A3667 the location of the shock is in the low-density region. Perhaps, the only other cluster where the shock has been found in the low-density region is A754 (Krivonos et al. 2003; Henry et al. 2004).
Given the very low gas densities in this region roughly 2.2 Mpc from the center of the cluster, and the high shock speed, it is possible that the post-shock gas has not had time to come into electron-ion equipartition by Coulomb collisions, or into collisional ionization equilibrium. If the electrons are not strongly heated by the shock, the time scale for the electron and ion temperatures to come into equipartition is approximately (Fox & Loeb 1997; Wong & Sarazin 2009)
| (3) |
where is the electron temperature, is the proton density, and is the Coulomb logarithm. Because the possible merger shock is weak (has a low Mach number), the electrons will be heated significantly by adiabatic compression, even if there is no shock electron heating. For the adapted value for the shock compression, adiabatic heating gives , while the full shock heating including adiabatic compression gives . If the adapted post-shock density and the post-shock electron temperature assuming only adiabatic heating are used in equation (3), the approximate time to reach equipartition is yr. The speed of the post-shock material relative to the shock is km s-1. Thus, the thickness of the region with a lowered electron temperature would be Mpc, corresponding to an angular scale of arcmin. Here, where is the angle between the central shock normal and the plane of the sky. This is comparable to the width of our spectral zone 4. So, this would argue that nonequipartition could be quite important. On the other hand, the apparent post-shock temperature is actually a bit higher than expected assuming full shock heating and the shock compression derived from the jump in X-ray surface brightness. This may indicate that the electrons are heated effectively at the shock.
At the observed post-shock temperature, one would expect the gas to achieve ionization equilibrium after a time sec (e.g., Fujita et al. 2008). For the post-shock electron density, this would give yr, which is even longer than the timescale to reach equipartition. However, the effects of nonequilibrium ionization may be difficult to discern without much better spectra than we currently have.
One argument favoring a thermal shock model for the jump in brightness and hardness of the X-rays at the outer edge of the relic is that a similar jump is seen in nearby regions where the radio emission from the relic is not bright. For example, the zones which are closest to the apparent shock position but in regions with weak radio emission are zone 2 for the shocked and zone 13 for the preshock. The density jump between these two zones corresponds to a Mach number of . The temperature jump is basically identical to that measured on the radio relic, so the estimate of Mach number from the temperature jump would not change. Thus, the jump in X-ray properties is similar in regions with bright or faint radio emission, which is consistent with thermal emission from a shock, but perhaps not with IC emission from the relic.
Could this merger shock be accelerating or re-accelerating the relativistic electrons in the NW radio relic? We start by estimating the energy dissipated in the shock. As a simple estimate of this, we take the change in the kinetic energy flux across the shock. This is given by
| (4) |
where is the pre-shock mass density in the gas. Using our derived values for the shock properties gives . The width of the relic from northeast to southwest is roughly 263 or 1.63 Mpc. Taking the area of the shock perpendicular to the flow as a circle with this diameter gives a perpendicular area of 2.09 Mpc2. With this size, the total rate of conversion of shock kinetic energy is
| (5) |
We now compare the rate dissipation in the shock to the energy required to power the radio source. Given the steep radio spectrum of the relic, it appears that the relativistic electrons are losing energy due to radiation. We first consider the losses due to radio synchrotron emission. Assuming the relic is in steady-state, with the shock accelerating new relativistic electrons and these particles losing energy by radiation, the total rate of energy deposition in the electrons is given by the radio luminosity. Unfortunately, there are few recent radio observations of the relic, and some of the existing older values disagree, suggesting that some flux in some observations may be missing due to the large extent and low surface brightness of the relic, or that some of the fluxes include other sources. The flux at 1.4 GHz is 3.7 Jy (Johnston-Hollitt 2004), and the overall spectral index from 85.5 MHz to 2.4 GHz is (Röttgering et al. 1997). The spectral index appears to steepen to from 1.4 GHz to 2.4 GHz, and to flatten below 1.4 GHz. Thus, we approximate the radio spectrum as
| (6) |
Then, the total radio luminosity of the relic is erg s-1. The IC luminosity of the relic is given by , so the total nonthermal luminosity is erg s-1. If this energy is provided by the shock acceleration of electrons, then the efficiency of shock acceleration is
| (7) |
Below, we show that the magnetic field is the relic is at least G, so that the correction factor in equation (7) is between one and 2.5. Note that this acceleration efficiency is about one order of magnitude smaller than the values of a few percent usually inferred from the radio emission by Galactic supernova remnants (e.g., Rosswog & Brüggen 2007). This might be due to the relatively low Mach number of this shock compared to these in supernova remnants. Alternatively, it may be that part of the X-ray discontinuity at outer edge of the radio relic is due to IC emission, and the shock is actually weaker than our estimate.
First order Fermi acceleration gives relativistic electrons with a power-law spectrum , where the power-law index is and is the shock compression. The spectral index for radio emission near the shock should be , while the integrated radio spectrum of the relic and spectrum of hard X-ray inverse Compton emission should be one power steeper. Using the value of the compression determined above, this would give at the shock, and for the integrated spectrum of the radio relic. The observed radio spectra are flatter, with a value of near the outer edge of the relic, and for the integrated spectrum, depending on the observed frequency (Röttgering et al. 1997; Johnston-Hollitt 2004). This might indicate that we have underestimated the shock compression, or that the simplest shock acceleration model for the relic does not apply.
The fact that the radio spectrum steepens with projected distance from the outer edge of the relic (Röttgering et al. 1997) , and that the relic fades away to the southwest rather than ending abruptly (Röttgering et al. 1997; Johnston-Hollitt 2004) might be explained if the relativistic electrons are accelerated at the shock, and then undergo radiative losses as they are advected away from the shock. If the radio spectrum steepens at a frequency , the radiative age for electrons which produce the break is (van der Laan & Perola 1969)
| (8) | |||||
The speed of the post-shock material relative to the shock is km s-1. Thus, the relativistic electrons will have moved a distance away from the shock, where
| (9) | |||||
The corresponding angular distance is
| (10) | |||||
where is the angle between the central shock normal and the plane of the sky. This is roughly consistent with the observed thickness of the layer at the front outer edge of the radio relic where the spectrum between 20 and 13 cm is observed to steepen dramatically (Röttgering et al. 1997). On the other hand, the full width of the relic is about 8′ from NW to SE at 1.4 GHz. Since this corresponds to several electron radiation loss lengths, this may indicate that there is re-acceleration of particles within the relic, perhaps by turbulence produced by the passage of the merger shock. Alternatively, far from the NW edge of the relic, we may be seeing radio emission from relativistic electrons which have been recently accelerated and which are located at the front or back edge of a convex shock region .
This argument neglected the diffusion of the relativistic electrons. If Bohm diffusion applies, the diffusion coefficient is (Berezinsky et al. 1997),
| (11) |
The electrons which produce the radio emission at 20 cm have GeV, which leads to cm2 s-1. During the radiative loss time , these electrons would diffuse a distance of Mpc, which is smaller than the advection distance. We also note that the sharp outer edge of the radio relic suggests that diffusion is not very important on the scale of the size of the relic.
Alternatively, the increase in the X-ray brightness and hardening of the spectrum at the outer edge of the relic might be the result of inverse Compton emission, rather than thermal emission from the shocked gas. As note in § 4, the signal-to-noise of the X-ray spectra do not allow these two models to be distinguished. If the jump in X-ray emission and hardness is due to inverse Compton emission, one would still need to explain why the relic is located where it is. That is, how are the relativistic electrons in the relic generated? It might be that the particles are due to first order Fermi re(acceleration) from a merger shock; in this case, there would still need to be a shock at the front of the relic, but the X-ray emission in this region might be predominantly nonthermal. It is also possible that the electrons are accelerated by some other mechanism.
Taking the nonthermal fits as an upper limit on the true flux of inverse Compton emission coming from the relic in regions 4 and 5, we can derive a lower limit on the average magnetic field strength as shown by Harris & Romanishin (1974). Considering monochromatic fluxes , at frequencies , , for a power-law distribution of electrons, the expression for the magnetic field is
| (12) | |||||
The value of the proportionality constant can be found from the ratio of the synchrotron flux (Longair 1994, eqn. 18.49) to the IC flux (Rybicki & Lightman 1979, eqn. 7.31). For region 4 we use the photon index found for region 5, since this is more consistent with the spectral index of the radio relic. The lower photon index found in region 4 may be the result of coincident thermal emission, and therefore our estimate of would be low. Assuming the X-ray flux in these regions is nonthermal with a photon index in the range , we find magnetic field strengths in the range . Since it is unknown what fraction of the emission is thermal, may in fact be larger. Therefore we estimate a lower limit for the magnetic field at the location of the radio relic of G. This limit is just consistent with Faraday rotation measure estimates from the the observation of background radio galaxies in the zone close to the relic (Johnston-Hollitt 2004).
6. Conclusions
We have made a new X-ray observation of the northwest radio relic region in the Abell 3667 cluster in order to gain insight on both thermal and non-thermal phenomena that should be associated with it. We detect a jump in both the surface brightness and the hardness of the X-ray emission at the outer edge of the relic. The X-ray spectra of these regions is consistent with the extra emission on the relic being either thermal emission from a merger shock or inverse Compton emission from relativistic electrons in the radio relic. There are some arguments that favor the shock model, which implies a shock with a Mach number of and a shock speed of 1200 km s-1. The energy content of the relativistic particles in the radio relic can be explained if they are (re)-accelerated by the shock with an efficiency of 0.2%. The merger shock model and shock acceleration of the relativistic electrons can explain, at least roughly, the radio surface brightness and spectral distributions in the relic.
Alternatively, the jump in the brightness and hardness of the X-rays at the outer edge of the relic might be due to inverse Compton emission from the relic. Assigning all the emission from the relic to the IC component, we derive a lower limit on the magnetic field in the relic of 3 G.
These observations have yielded the first robust characterization of the X-ray properties near the northwest radio relic and possible merger shock in Abell 3667. Unfortunately, the data are not sufficiently deep to determine if the relative roles the thermal shock emission and nonthermal IC emission. Recently, we were approved for a very long observation of this regions as an XMM-Newton Large Program. These data should allow us to determine the efficiency of particle acceleration and the relative roles of thermal and nonthermal processes in this merger shock.
References
- Berezinsky et al. (1997) Berezinsky, V. S., Blasi, P., & Ptuskin, V. S. 1997, ApJ, 487, 529
- Bock et al. (1999) Bock, D. C.-J., Large, M. I., & Sadler, E. M. 1999, AJ, 117, 1578
- Briel et al. (2004) Briel, U. G., Finoguenov, A., & Henry, J. P. 2004, A&A, 426, 1
- Deiss et al. (1997) Deiss, B. M., Reich, W., Lesch, H., & Wielebinski, R. 1997, A&A, 321, 55
- Feretti (2008) Feretti, L. 2008, Memorie della Societa Astronomica Italiana, 79, 176
- Finoguenov et al. (2007) Finoguenov, A. et al., 2007, ApJS, 172, 182
- Finoguenov et al. (2009) Finoguenov, A. et al., 2009, ApJ, 704, 564
- Fox & Loeb (1997) Fox, D. C., & Loeb, A. 1997, ApJ, 491, 459
- Fujita et al. (2008) Fujita, Y., et al. 2008, PASJ, 60, 1133
- Fusco-Femiano et al. (2004) Fusco-Femiano, R., Orlandini, M., Brunetti, G., Feretti, L., Giovannini, G., Grandi, P., & Setti, G. 2004, ApJ, 602, L73
- Harris & Romanishin (1974) Harris, D. E., & Romanishin, W. 1974, ApJ, 188, 209
- Henry et al. (2004) Henry, J. P., Finoguenov, A., & Briel, U. G. 2004, ApJ, 615, 181
- Johnston-Hollitt (2004) Johnston-Hollitt, M. 2004, in The Riddle of Cooling Flows in Galaxies and Clusters of Galaxies, ed. T. Reiprich, J. Kempner, & N. Soker, 51
- Johnston-Hollitt et al. (2008) Johnston-Hollitt, M., Hunstead, R. W., & Corbett, E. 2008, A&A, 479, 1
- Krivonos et al. (2003) Krivonos, R. A., Vikhlinin, A. A., Markevitch, M. L., & Pavlinsky, M. N. 2003, Astronomy Letters, 29, 425
- Longair (1994) Longair, M. S. 1994, Cambridge: Cambridge University Press, 1994, 2nd ed.
- Markevitch et al. (2002) Markevitch, M., et al. 2002, ApJ, 567, L27
- Markevitch et al. (2000) Markevitch, M., et al. 2000, ApJ, 541, 542
- Markevitch et al. (1999) Markevitch, M., Sarazin, C. L., & Vikhlinin, A. 1999, ApJ, 521, 526
- Markevitch et al. (2005) Markevitch, M., Govoni, F., Brunetti, G., & Jerius, D. 2005, ApJ, 627, 733
- Mazzotta et al. (2002) Mazzotta, P., Fusco-Femiano, R., & Vikhlinin, A. 2002, ApJ, 569, L31
- Nakazawa et al. (2009) Nakazawa, K., et al. 2009, PASJ, 61, 339
- Owers et al. (2009) Owers, M. S., Couch, W. J., & Nulsen, P. E. J. 2009, ApJ, 693, 901
- Ricker & Sarazin (2001) Ricker, P. M., & Sarazin, C. L. 2001, ApJ, 561, 621
- Roettiger et al. (1999) Roettiger, K., Burns, J. O., & Stone, J. M. 1999, ApJ, 518, 603
- Rossetti & Molendi (2004) Rossetti, M., & Molendi, S. 2004, A&A, 414, L41
- Rosswog & Brüggen (2007) Rosswog, S., & Brüggen, M 2007, Introduction to High Energy Astrophysics, (Cambridge: Cambridge Univ. Press), 153
- Röttgering et al. (1997) Röttgering, H. J. A., Wieringa, M. H., Hunstead, R. W., & Ekers, R. D. 1997, MNRAS, 290, 577
- Rybicki & Lightman (1979) Rybicki, G. B., & Lightman, A. P. 1979, New York: Wiley-Interscience, 1979
- Smith et al. (2001) Smith, R. K., Brickhouse, N. S., Liedahl, D. A., & Raymond, J. C. 2001, ApJL, 556, L91
- van der Laan & Perola (1969) van der Laan, H., & Perola, G. C. 1969, A&A, 3, 468
- Vikhlinin et al. (2001a) Vikhlinin, A., Markevitch, M., & Murray, S. S. 2001a, ApJ, 551, 160
- Vikhlinin et al. (2001b) —. 2001b, ApJ, 549, L47
- Vikhlinin et al. (1998) Vikhlinin, A., McNamara, B. R., Forman, W., Jones, C., Quintana, H., & Hornstrup, A. 1998, ApJ, 502, 558
- Watson et al. (2001) Watson, M. G., et al. 2001, A&A, 365, L51
- Willson (1970) Willson, M. A. G. 1970, MNRAS, 151, 1
- Wong & Sarazin (2009) Wong, K.-W., & Sarazin, C. L. 2009, ApJ, 707, 1141