Author(s) in page-headRunning Head
and
gamma-rays: bursts – cosmology: galaxy – methods: statistical
Origins of Short Gamma-Ray Bursts Deduced from Offsets to Their Host Galaxies Revisited
Abstract
The spatial distribution of short Gamma-ray bursts (GRBs) in their host galaxies provide us an opportunity to investigate their origins. Based on the currently observed distribution of short GRBs relative to their host galaxies, we obtain the fraction of the component that traces the mergers of binary compact objects and the one that traces star formation rate (such as massive stars) in early- and late-type host galaxies. We find that the fraction of massive star component is with error of level from the analysis of projected offset distribution. This suggests that a good fraction of short GRBs still originate from merger events. From our analysis, we also conclude that the fraction of late-type hosts among the elliptical, starburst and spiral galaxy is with error of level, which is consistent with the observed early- to late-type number ratio of host galaxies.
1 Introduction
After the first discovery of the redshift and the host galaxy association of the short Gamma-ray burst (GRB with duration 2s) GRB050509B (Gehrels et al. 2005; Bloom et al. 2006), observations of the host galaxies of short GRBs (Berger et al. 2005; Hjorth et al. 2005; Fox et al. 2005; Covino et al. 2006) provide us an opportunity to study the population of their host galaxies and the nature of their progenitors (e.g. Prochaska et al. 2006; Savaglio et al. 2009; Zhang et al. 2009).
The lower explosion energies, the lower star formation rate, lack of the supernova (SN) association and the locations in their host galaxies suggest that the mergers of binary compact objects are the promising progenitor candidates for short GRBs (e.g. Berger et al. 2005; Fox et al. 2005; Belczynski et al. 2006). Based on these observations, binary compact objects were studied as possible short GRB progenitors by the population synthesis (PS) methods (e.g., Lipunov et al. 1997; Bloom et al. 1999; Fryer et al. 1999; Belczynski et al. 2002, 2007). By this method, Belczynski et al. (2006) presented binary compact object formation rates, their merger rates, locations, and afterglow properties for different initial conditions. Some predictions from the PS analysis agreed well with the existing observational constraints such as the redshift distribution of short GRBs (O’Shaughnessy er al. 2008).
However, not like the long GRBs (GRB with duration 2s) that are exclusively linked with star-forming galaxies (e.g., Bloom et al. 1998; Fruchter et al. 1999; Djorgovski et al. 2003; Christensen et al. 2004; Castro Cern et al. 2006; Savaglio et al. 2009), short GRBs reside in all types of galaxies (Berger et al. 2005, 2007; Fox et al. 2005; Gehrels et al. 2005; Berger 2009). Berger (2009) investigated the host galaxy properties for all short GRBs localized by Swift X-Ray Telescope (XRT) and found that the majority of short GRBs appear to occur in star-forming galaxies. This fact suggests that some short GRBs may come from other origin that traces the star formation rate. In fact, Zhang et al. (2009) showed that not only long GRBs, but also a good fraction of short GRBs could be from the death of the massive stars (= collapsars). Moreover, Virgili et al. (2009) tried to reproduce the luminosity-redshift distribution and the peak flux distribution of short GRBs, and they concluded that the fraction of collapsars as one of the origins of short GRBs is much higher than binary compact objects.
In this study, we would like to consider the origin of short GRBs from the point of view of the spatial distribution of short GRBs in their host galaxies. It is well known that distribution of binary compact objects is wider than massive stars, because binary compact objects can have kick velocities (e.g. Wang, Lai & Han 2006, Cui et al. 2006, and references therein) and it takes long time for them to merge by emitting gravitational waves. We try to obtain the fractions of the component that traces star formation rate (such as single massive star component: we call it as “SMC” in this study) and the component of binary compact objects (we call it as “BC” in this study) as the progenitor of short GRBs. We obtain them by reproducing the observed distribution in their host galaxies with theoretical models. We use the results of the PS calculations that give the distribution of BC in late- and early-type host galaxies (Belczynski et al. 2006). We also use the distribution of SMC in their host galaxies that is deduced from the observations of distribution of stars (Bloom et al. 2002). We find that the fraction of SMC is with error of level for the elliptical, starburst and spiral host galaxies. We also show that the fraction of the late-type hosts determined by the best fitting can be consistent with the observed number ratio of late- to early-type host galaxy. The data and the method are presented in 2. In 3, we give the best fitting results for different type of host galaxy. 4 and 5 are our discussions and conclusion. Throughout the paper, a concordance cosmology with parameters km s-1 Mpc-1, , and are adopted.
2 Data and Method
As stated above, we try to fit the observed distribution of short GRBs in their host galaxies by the combination of SMC and BC distributions. We can obtain the most favored fraction of them from the fitting (least-square method). In this analysis, we also investigate the difference of the distribution of short GRBs in different type of host galaxies. We can obtain the favored fraction of late-type host galaxies from the fitting (least-square method), which can be compared with the observed fraction.
2.1 Observational Data
In this study, we investigate the distribution of short GRBs in two ways. One is the distribution of distances of short GRBs from the center of their host galaxies (strictly speaking, the distane means the projected distance in the direction perpendicular to the line of sight). We call it as ’Offset’ in this study. Another is same with Offset, but normalized by the radius of their host galaxies. We call it as ’Normalized Offset’ in this study.
We use 22 samples of short GRBs from previous works. These samples include the bursts in the original classification (Kouveliotou et al. 1993) and the ones that have not only a spike of short duration but also extended emission (EE) as defined by Norris & Bonnell (2006). In our sample, 9 bursts have host galaxies with known radius (e.g. Fong et al. 2010). Therefore, we study the Offset with 22 short GRBs and Normalized Offset with 9 short GRBs. The properties of the bursts and their host galaxies of our sample are listed in Table 1. Columns denote the GRB name, the duration (), the redshift (), the Offset (), the Normalized Offset (), the type of host galaxy and the references of these data. Most of the values of are taken from the work of Berger (2009) except for GRB051227, GRB060505, GRB060614 from Troja et al. (2008) and GRB090426 and GRB090510 from Swift GRB table 111http://heasarc.gsfc.nasa.gov/docs/swift/archive/. We include three bursts only with the redshift limits of the putative host galaxies: GRB051210 (1.4), GRB060121 (1.7), and GRB060313 (1.1) from the work of Troja et al. (2008) and one burst with the Offset limit (0.6′′) for GRB070429B (Cenko et al. 2008). Since a host galaxy of GBR070809 has not been found to deep limit, the nearest galaxy is taken as its host galaxy (Fong et al. 2010). The Normalized Offset of GRB060502B is deduced from the outer component with a best fit sérsic model (Bloom et al. 2007). For the morphology of the host, elliptical (E) or spiral (S) types were reported by O’Shaughnessy et al. (2008) and star formation (SF) or low star formation (LSF) were given by Zhang et al. (2009) and the reference therein. Others are the bursts without observation reports (”0”) or too faint (“Faint”) to be observed.
| GRB | Z | Type | Ref | |||
| (s) | (kpc) | |||||
| 050509B | 0.04 | 0.225 | 54.3 (12.1) | 2.59 0.58 | E | 1,2,9 |
| 050709* | 0.07 | 0.161 | 3.70 (0.03) | 2.04 0.02 | S | 1,2,9 |
| 050724* | 3 | 0.258 | 2.69 (0.07) | 1.28 0.05 | E | 1,2,9 |
| 051210 | 1.27 | 1.4 | 30.3 (19.5) | 5.66 3.65 | 0 | 1,2 |
| 051221A | 1.4 | 0.546 | 2.05 (0.19) | 0.88 0.08 | S | 1,2,9 |
| 060121 | 1.97 | 1.7 | 0.96 (0.37) | 0.18 0.07 | Faint | 1,2 |
| 060313 | 0.7 | 1.1 | 2.57 (0.53) | 1.66 0.32 | Faint | 1,2 |
| 060502B | 0.09 | 0.287 | 70.0 (16.0) | 6.66 1.52 | E | 2,8,9 |
| 060505 | 4 | 0.089 | 7.45 (0.53) | … | S | 2,9 |
| 060614* | 103 | 0.125 | 1.10 | … | LSF | 2,10 |
| 060801 | 0.5 | 1.131 | 19.7 (19.8) | … | 0 | 2 |
| 061006* | 0.42 | 0.438 | 1.37 (0.27) | 0.41 0.09 | LSF | 1,2,10 |
| 061201 | 0.8 | 0.111 | 33.9 (0.40) | … | SF | 2,10 |
| 061210* | 0.19 | 0.41 | 10.7 (9.70) | … | SF | 2,10 |
| 061217 | 0.21 | 0.827 | 55.0 (28.0) | … | SF | 2,10 |
| 070429B | 0.5 | 0.9023 | 16.99 | … | Faint | 3,10 |
| 070714B* | 3 | 0.9225 | 11.64 | … | S | 4,10 |
| 070724A | 0.4 | 0.457 | 4.80 (0.10) | … | SF | 2,10 |
| 070809 | 1.3 | 0.2187 | 20.0 | … | S | 1,10 |
| 071227 | 1.8 | 0.381 | 15.0 (2.20) | … | S | 5,10 |
| 090426 | 1.2 | 2.609 | 0.80 | … | SF | 6,10 |
| 090510 | 0.3 | 0.903 | 5.50 | … | SF | 7,10 |
| figure |
-
*
* Burst with extended emission.
-
*
References: (1) Fong et al. 2010; (2) Troja et al. 2008; (3) Cenko et al. 2008; (4) Graham et al. 2009; (5) D’Avanzo et al. 2009; (6) Levesque et al. 2009; (7) Rau et al. 2009; (8) Bloom et al. 2007; (9) O’Shaughnessy et al. 2008; (10) Zhang et al. 2009
From Table 1, we can see that the short GRB host galaxies include not only early-type but also late-type. The observed number ratio of late- to early-type host galaxy is 5:1 (Berger 2009; Fong et al. 2010).
2.2 Method of Analysis
Belczynski et al. (2006) developed an updated PS code to calculate the locations of mergers of binary compact objects in early- and late-types host galaxies: elliptical (Ellip), spiral (Sp), and starburst (SB) galaxy. When they calculated the motion of the binaries, they took into account the gravitational potential of their host galaxies. In their study, the mass density of their host galaxies are assumed to be constant, and they modeled gravitational potentials for each types of galaxies with a large and a small mass. The bulge mass and radius for the large elliptical galaxy are taken as and 5kpc, respectively. The total mass of the bulge and disk and the disk radius for the large spiral and the starburst galaxies are assumed as and 12kpc. The small galaxies are downscaled by a factor of in mass and of 10 in size (constant density). The Offset of NS-NS (neutron star and neutron star, defined as “NN” in this work) and NS-BH (neutron star and black hole, “NB”) merger locations were given by Belczynski et al. (2006) for different types of host galaxies. Although Belczynski et al. (2002) presented all types of the binary, in this work we consider two types of the binary: NN and NB in three kinds of host galaxies: Ellip, Sp, and SB as mentioned by Belczynski et al. (2006). The number ratio of the NN to NB merger components has been calculated in Belczynski et al. (2002). They evolved initial binaries in a spiral galaxy and found that 52,599 NN and 8,105 NB are formed, which implies that the ratio of NN to NB is 6.49. They also found that the evolutionary time (the time required for the initial progenitor binary on ZAMS to form a binary) are typically of the order of a few to several tens Myr, and their distributions are similar among different types of galaxies. Thus it will be reasonable to assume this ratio to be the same for every galaxy since the structure of the star cluster and the evolution of the binary in them will be the similar in every type of the galaxy. Therefore, here we fix this parameter as 6.49 for each type of galaxy.
As mentioned by Smith et al. (2005) and Belczynski et al. (2006), most elliptical galaxies are formed before z 2 and there are no longer star-forming regions, while late-type galaxies have an ongoing and active star-forming regions. This suggests that in the spirals and starbursts galaxies, GRBs may come not only from BC but also from SMC. Thus we consider SMC in this study. As for the model of SMC, Bloom et al. (2002) proposed a model of the number density of massive-star forming regions in a disk galaxy as
| (1) |
where , the half-light radius of a galaxy if is the disk scale length. It is true that the distribution of massive star forming regions in a galaxy has large uncertainty as mentioned in their work, this distribution function is frequently used in the analysis of Offset/Normalized Offset of GRBs. Thus we use this distribution as a template in this study.
In summary, in our study, we consider only the distributions of NN and NB (that is, BC) for early-type host galaxies, while we consider distributions of BC and SMC for late-type host galaxies. The procedure of analysis includes the following steps. (1) We derive theoretical Offset/Normalized Offset curves for each type of host galaxy with a help of the PS model and SMC model. It is noted that a single theoretical curve can not obtained since there are uncertainties in the models. Thus we obtained one hundred curves for an each host galaxy changing the values for uncertain parameters. (2) Since the host galaxies for short GRBs include all types, we combine two/three distributions of Offset/Normalized Offset for different types of host galaxies with proper weight. When we consider the contribution from the late-type galaxies, we add the SMC component with proper weight. The proper weights are determined by the the least-square method to reproduce the observed Offset/Normalized Offset. (3) We apply the statistic methods to test all the fittings and give the test results.
We give an example below. Let’s consider Ellip-SB-Sp model. In this model, there are five components: two SMCs and two BCs in late-type host galaxies (Sp-SB), and one BC in early-type host galaxy (Ellip). We introduce the fractions and that are the fractions of the SMC in SB and Sp galaxies respectively, and and that are the fractions of SB and Sp galaxies in all types of galaxies. The most favored Offset/Normalized Offset curves are obtained by the least-square method for
| (2) | |||||
where and are the Offset curves of SMC and BC in SB galaxy. and are those in Sp galaxy, and is that of BC in Ellip galaxy. The fractions of SMC and of the late-type host galaxy are and , respectively. For Ellip-Sp model, while for Ellip-SB model, . In summary, we obtain the proper weights , , , and by reproducing the observed Offset/Normalized Offset using the theoretical curves , , , , and .
3 Results
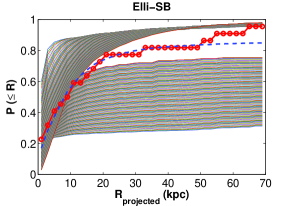
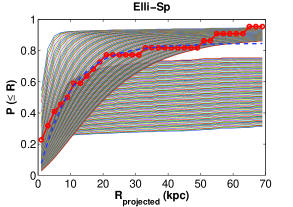
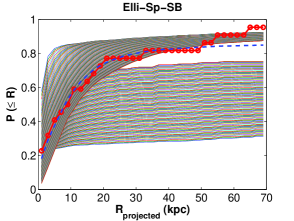
The results for the Offset are shown in Figure 1. It is shown at the top what kind of host galaxies are considered in each panel. Horizontal axis represents the projected distance from the center of a host galaxy, while vertical axis represents the cumulative Offset. Red circles represent observed 22 samples. The blue dashed curve is the best fitting curve. Green solid curve is the contribution from SMC, and blue solid curve is the one from BC in the best fitting case. The deep/bright gray regions in the left panels represent 1/3 error ranges. In the right panels, all of the possible curves are shown for SMC and BC. For example, at the left bottom panel of Figure 1, the result for Ellip-SB-Sp model is shown where BC is expressed as . From Figure 1, we can find that the observed data are all in the 3 error ranges of best fitting results.
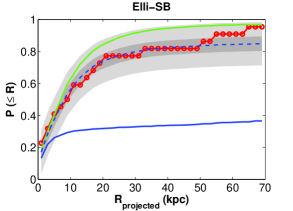
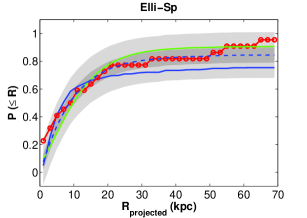
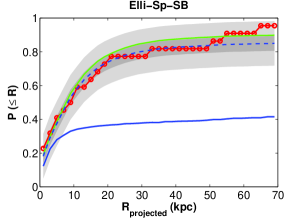
The values of , reduced masses of the early- and late-type galaxies, fraction of SMC component in late-type galaxy and its error, fraction of the late-type host galaxy and its error, the significant level (p) and statistic results (ksstat, tstat, fstat) for K-S test, T-test and F-test to the best fitting curve are shown in Table 2. From the table, we find that the fractions of the late-type host galaxy and the SMC components are 0.820.05 and 0.370.13 with error of level for the Offset analysis. Here we would like to explain how we calculate the “reduced” mass of host galaxies. They are expressed as , , and for elliptical, starburst, and spiral galaxies. Here is the mass of SB galaxy that gives the probability distribution , and is the one that gives , and so on.
| sample | Offset Analysis | Normalized Offset Analysis | |||||
| early-type galaxy | Ellip | Ellip | |||||
| late-type galaxy | SB | Sp | SB-SP | SB | Sp | SB-SP | |
| 0.20 | 0.24 | 0.19 | 0.28 | 0.37 | 0.28 | ||
| 6.97 | 42.0 | 12.4 | 50 | 50 | 50 | ||
| 6.04 | 4.86 | 5.55 | 10 | 0.21 | 10 | ||
| fraction | late-type | 0.83 (0.10) | 0.74 (0.05) | 0.82 (0.05) | 0.31 (0.27) | 0.24 (0.30) | 0.30 (0.21) |
| SMC component | 0.32 (0.13) | 0.48 (0.14) | 0.37 (0.13) | 0.17 (0.23) | 0.24 (0.41) | 0.19 (0.33) | |
| KS test | p | 0.09 | 0.09 | 0.09 | 0.02 | 0.02 | 0.02 |
| ksstat | 0.29 | 0.29 | 0.29 | 0.58 | 0.58 | 0.58 | |
| T-test | p | 0.68 | 0.60 | 0.71 | 0.70 | 0.76 | 0.71 |
| tstat | 0.41 | 0.52 | 0.37 | -0.39 | 0.31 | -0.37 | |
| F-test | p | 0.76 | 0.73 | 0.75 | 0.45 | 0.09 | 0.41 |
| fstat | 1.11 | 0.89 | 1.12 | 1.60 | 2.88 | 1.67 | |
Then from Table 2, we find that the fraction ( with error of level) of the late-type host galaxy in Ellip-SB-Sp model is consistent with the observed number ratio (5:1) (Berger 2009; Fong et al. 2010). It should be noted that the values of and the test results for the Ellip-Sp-SB model are the best among all models, because short GRBs are found in every type of galaxies.
The results of Normalized Offset are shown in Figure 2 and Table 2. The fractions of the late-type host galaxies and those of SMC are also presented there. The GRB identifications are noted along the solid histogram in Figure 2. We can see that the observed data are all in the 2 error ranges of the best fitting results. We also find that the fractions of SMC for all types of the host galaxies (Ellip-Sp-SB) and the late-type host galaxies are 0.190.33 and 0.300.21, respectively. The and the errors of the fractions for Normalized Offset are larger than the Offset analysis. This is likely because the number of Normalized Offset sample is smaller. Thus, the results for the Offset analysis will be more reliable than Normalized Offset in this work. However, with new observations for the short GRB host galaxies in the future, the Normalized Offset analysis should shed light on the origin of short GRBs.
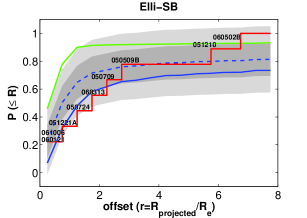
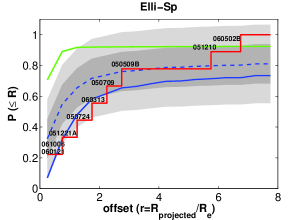
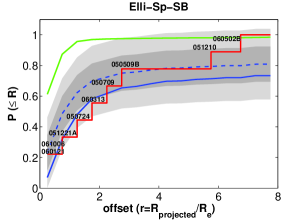
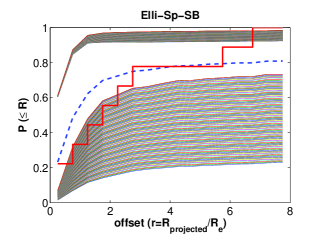
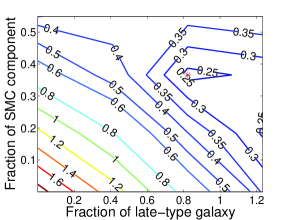
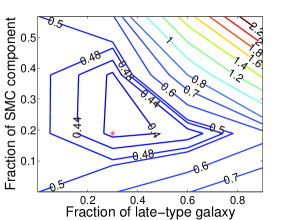
Figure 3 shows the contour plots of in the plane of the fractions of SMC and late-type galaxies for the Offset (left panel) and Normalized Offset (right panel) analysis.The Ellip-SB-Sp model is adopted. The minimum of is denoted by the red star. Other parameters are fixed to be the most favored values by the least-square method.
4 Discussion
Troja et al. (2008) analyzed the different properties of short GRB with extended emission (EE) and those without EE and found that the bursts with large offsets have no observed EE components. Here we also investigate the Offset for these two sub-samples in our observed offset sample: one includes 6 bursts with EE and the other is composed of 16 bursts without EE. The results are summarized in Table 3. The fitting results show that the average fractions of the late-type galaxies are about 0.58 and 0.62 for the bursts without EE and for those with EE. The average SMC component fractions for two samples are also very near: 0.48 and 0.52. Taking into account the error bars, we could not find any difference between the bursts with and those without EE in this analysis.
| sample | Offset Analysis for the bursts without EE | Offset Analysis for the bursts with EE | |||||
| early-type galaxy | Ellip | Ellip | |||||
| late-type galaxy | SB | Sp | SB-Sp | SB | Sp | SB-Sp | |
| 0.30 | 0.35 | 0.31 | 0.20 | 0.19 | 0.19 | ||
| 49.0 | 50 | 50 | 37.6 | 22.8 | 7.96 | ||
| 10 | 7.43 | 10 | 0.21 | 0.31 | 0.41 | ||
| fraction | late-type | 0.61 (0.09) | 0.54 (0.11) | 0.60 (0.08) | 0.67 (0.18) | 0.58 (0.15) | 0.65 (0.17) |
| SMC component | 0.48 (0.12) | 0.53 (0.11) | 0.43 (0.06) | 0.45 (0.20) | 0.54 (0.20) | 0.57 (0.20) | |
| KS test | p | 0.23 | 0.23 | 0.04 | 0.43 | 0.43 | 0.43 |
| ksstat | 0.23 | 0.23 | 0.30 | 0.33 | 0.33 | 0.33 | |
| T-test | p | 0.88 | 0.87 | 0.82 | 0.65 | 0.78 | 0.82 |
| tstat | 0.15 | 0.16 | 0.23 | 0.47 | 0.28 | 0.23 | |
| F-test | p | 0.96 | 0.95 | 0.78 | 0.54 | 0.50 | 0.39 |
| fstat | 1.02 | 1.02 | 1.09 | 1.46 | 1.51 | 1.70 | |
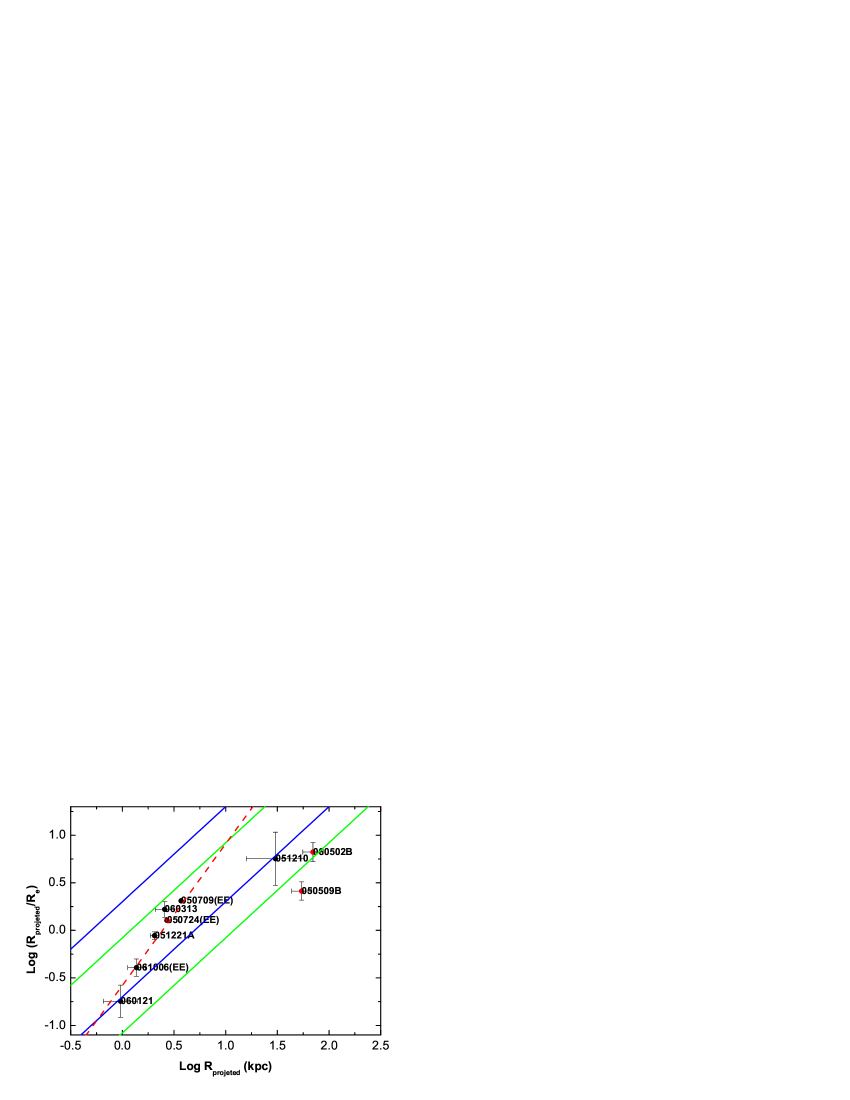
We check the correlation between the Offset and Normalized Offset. In Figure 4, we show the observed correlation and theoretically calculated one. The region between solid lines are expected range for early-type host galaxies in our calculation. The one between green lines are for late-type galaxies. The boundaries of these regions correspond to the maximum and minimum mass of the host galaxies in our analysis. Red points denote that the host galaxies are early-type, while black points denote that the ones are late-type. Except for GRB050509B with large host galaxy radius, all the observed data are in the expected range by our models. Especially for the late-type host galaxy, they are all in the expected range. They seem to have two different groups: one is GRB050509B, GRB060502B and GRB051210 with larger Offsets and Normalized Offsets. Two of their host galaxies are elliptical, but the one for GRB051210 is too faint to determine its type. It will be interesting if more bursts in this group will be found in the future and if their host galaxies are exclusively elliptical. The others including bursts with EE seem to trace a linear distribution. The linear correlation coefficient is . There seems to be no significant difference for the bursts with and without EE. We also find for all the observed data. These discussions are consistent with Troja et al. (2008).
We do the same analysis assuming that only one component (NN or NB) can be BC. The results don’t change so much, because the distribution of NN and NB are very similar with each other.
We obtain the fraction of the SMC in this study, but what is the SMC is a different discussion. It may be the collapsars, or young neutron stars with strong magnetic fields (young magnetars), or anything else. The SMC means the component that traces star-forming regions. This discussion is out-scope of this study.
Our work is based on the star formation disk model (Bloom et al. 2002) and the PS model (Belczynski et al. 2006), whose uncertainties will introduce uncertainties in our analysis, although it is claimed that the most uncertain aspects are all parameterized to allow for systematic error analysis (Belczynski et al. 2008). The smallness of number of short GRBs whose locations in their host galaxies also introduce uncertainties in our analysis. However, we would like to note that our analysis is the first step to discuss the origin of short GRBs from point of view of the Offsets/Normalized Offsets, including the SMC in the analysis. We believe that this step is very important to shed light on the origin(s) of short GRBs. We hope the improvement of these models and increase of observed samples so that we can discuss the origin of short GRBs with less uncertainties.
5 Conclusions
We have investigated the fractions of the SMC and BC as the origins of short GRBs from the Offset/Normalized Offset analysis. We have found that the fraction of the SMC is with error of level for the Offset analysis, which suggests that the SMC can be one of the origins of short GRBs, although most of short GRBs are from BC. The fraction of the late-type host galaxies is with error of level for the Offset analysis of the Ellip-SB-Sp model, which is consistent with the observed late- to early-type ratio of the host galaxies.
For the Normalized Offset analysis, the fractions of the SMC and late-type host galaxies are and , respectively. We believe that the Offset analysis is more reliable than the Normalized Offset analysis since the number of samples is more limited for the Normalized Offset analysis. However, the Normalized Offset analysis has a good potential to shed light on the origins of short GRBs when number of samples becomes larger in the future.
The fractions of the SMC are very similar for the bursts with EE and those without EE, which suggests that their origins may be the same. In the plane of the Offset and Normalized Offset, almost all of the short GRBs in this study are in the expected ranges by our models. There seems to be two groups in the plane, which may be related with the type of host galaxies.
We thank for helpful discussion with the members of Kavli Institute for Astronomy and Astrophysics and astronomy department of Peking university. This research was supported by Grant-in-Aid for Scientific Research on Priority Areas No. 19047004 by Ministry of Education, Culture, Sports, Science and Technology (MEXT), Grant-in-Aid for Scientific Research (S) No. 19104006 by Japan Society for the Promotion of Science (JSPS), Grant-in-Aid for young Scientists (B) No.19740139 by JSPS, Grant-in-Aid for Scientific Research on Innovative Areas No. 21105509 by MEXT of Japan, and Grant-in-Aid for the Global COE Program ”The Next Generation of Physics, Spun from Universality and Emergence” from MEXT of Japan.
References
- [] Belczynski, K., Bulik, T., & Rudak, B. 2002, ApJ, 571, 394
- [] Belczynski, K., Perna, R., Bulik, T. et al. 2006, ApJ, 648, 1110
- [] Belczynski, K., Taam, R. E., Kalogera, V., Rasio, F. A., & Bulik, T. 2007, ApJ, 662, 504
- [] Belczynski, K., Kalogera, V., Rasio, F. A., Taam, R. E., Zezas, A., Bulik, T., Maccarone, T. J. & Ivanova, N. 2008, ApJS, 174, 223
- [] Berger, E., et al. 2005, Nature, 438, 988
- [] Berger, E., et al. 2007, ApJ, 664, 1000
- [] Berger, E. 2009, ApJ, 690, 231
- [] Bloom, J. S., Djorgovski, S. G., Kulkarni, S. R., & Frail, D. A. 1998, ApJ, 507, L25
- [] Bloom, J. S., Sigurdsson, S., & Pols, O. 1999, MNRAS, 305, 763
- [] Bloom, J. S., Kulkarni, S. R., Djorgovski, S. G. 2002, AJ, 123, 1111
- [] Bloom, J. S., et al. 2006, ApJ, 638, 354
- [] Bloom, J. S., et al. 2007, ApJ, 654, 878
- [] Castro Cern J. M., Michaowski, M. J., Hjorth, J., Watson, D., Fynbo, J. P. U., & Gorosabel, J. 2006, ApJ, 653, L85
- [] Cenko S. B., Berger, E., Nakar, E. et al. 2008, arXiv:0802.0874
- [] Christensen, L., Hjorth, J., & Gorosabel, J. 2004, A&A, 425, 913
- [] Covino, S., et al. 2006, A&A, 447, L5
- [] Cui, X. H., Wang, H. G., Xu, R. X., Qiao, G. J. 2007, A&A, 472, 1
- [] D’Avanzo, P., Malesani, D., Covino, S., Piranomonte, S. et al. 2009, A&A, 498, 711
- [] Djorgovski, S. G., Bloom, J. S., & Kulkarni, S. R. 2003, ApJ, 591, L13
- [] Fong, W., Berger, E., & Fox, D. B. 2010, ApJ, 708, 9
- [] Fox, D. B., et al. 2005, Nature, 437, 845
- [] Fryer, C., Woosley, S., & Hartmann, D. 1999, ApJ, 526, 152
- [] Fruchter, A. S., et al. 1999, ApJ, 519, L13
- [] Gehrels, N., et al. 2005, Nature, 437, 851
- [] Graham, J. F., Fruchter, A. S., Levan, A. J., Melandri, A. et al. 2009, ApJ, 698, 1620
- [] Hjorth, J., et al. 2005, Nature, 437, 859
- [] Kouveliotou, C., Meegan, C. A., Fishman, G. J. et al. 1993, ApJ, 413, 101
- [] Levesque, E. M., Bloom, J. S., Butler, N. R. et al. 2009, arXiv: 0907.1661
- [] Lipunov, V. M., Postnov, K. A., & Prokhorov, M. E. 1997, MNRAS, 288, 245
- [] Norris, J. P. & Bonnell, J. T. 2006, ApJ, 643, 266
- [] O’Shaughnessy, R., Belczynski, K., Kalogera, V. 2008, ApJ, 675, 566
- [] Prochaska, J., et al. 2006, ApJ, 642, 989
- [] Rau, A., McBreen, S., Kruehler, T. & Greiner, J. 2009, GCN, 9393, 1
- [] Savaglio, S., Glazebrook, K., & Le Borgne, D. 2009, ApJ, 691, 182
- [] Smith, G. P., Treu, T., Ellis, R. S., Moran, S. M., & Dressler, A. 2005, ApJ, 620, 78
- [] Troja, E., King, A. R., O Brien, P. T. et al. MNRAS, 2008, 385, 10
- [] Virgili, F. J., Zhang, B., O’Brien, P., 2009, arXiv:0909.1850V
- [] Wang C., Lai D., Han J. L., 2006, ApJ, 639, 1007
- [] Zhang, B., et al. 2009, ApJ, 703, 1696