Magnetic properties of Fe3O4 nanoparticles coated with oleic and dodecanoic acids
Abstract
Magnetic nanoparticles (NP) of magnetite (Fe3O4) coated with oleic (OA) and dodecanoic acids (DA) were synthesized and investigated through Transmission Electron Microscopy (TEM), magnetization , and ac magnetic susceptibility measurements. The OA coated samples were produced with different magnetic concentrations (78, 76, and 65%) and the DA sample with 63% of Fe3O4. Images from TEM indicate that the NP have a nearly spherical geometry and mean diameter 5.5 nm. Magnetization measurements, performed in zero field cooled (ZFC) and field cooled (FC) processes under different external magnetic fields , exhibited a maximum at a given temperature in the ZFC curves, which depends on the NP coating (OA or DA), magnetite concentration, and . The temperature decreases monotonically with increasing and, for a given , the increase in the magnetite concentration results in an increase of . The observed behavior is related to the dipolar interaction (DI) between NP which seems to be an important mechanism in all samples studied. This is supported by the results of the ac magnetic susceptibility measurements, where the temperature in which peaks for different frequencies follows the Vogel-Fulcher model, a feature commonly found in systems with dipolar interactions. Curves of vs. /(=0) for samples with different coatings and magnetite concentrations collapse into a universal curve, indicating that the qualitative magnetic behavior of the samples may be described by the NP themselves, instead of the coating or the strength of the dipolar interaction. Below , vs. curves show a coercive field () that increases monotonically with decreasing temperature. The saturation magnetization () follows the Bloch’s law and values of at room temperature as high as 78 emu/g were estimated, a result corresponding to 80% of the bulk value. The overlap of / vs. / curves for a given sample and the low at high temperatures suggest superparamagnetic behavior in all samples studied. The overlap of / vs. curves at constant temperature for different samples indicates that the NP magnetization behavior is preserved, independently of the coating and magnetite concentration.
pacs:
75.50.Tt, 75.50.Gg, 75.30.Ds, 75.20.-gI Introduction
Iron oxides have many different technological applications, ranging from coloring of glasses to magnetic recording. In the latter, the increase of data density brings new challenges due to the decrease of the size of magnetic particles down to a nanometric scale which make systems unstable by the occurrence of superparamagnetism (SPM). In addition to this, the dipolar interaction (DI) between particles plays an important role in the general magnetic properties, being responsible for the gradual signal degradation with time.AZE1 Although many researches have focused in iron oxides nanoparticles (NP) for practical applications, there are still some controversial issues like the role played by the DI in the magnetic field dependence of the magnetization.AZE1 Among iron oxides, magnetite (Fe3O4) is a material that displays interesting magnetic properties, mostly when the particles are in the nanometric scale.
Bulk magnetite is a ferrimagnetic compound with Curie temperature close to 860 K.NEE1 The oxygen anions form a face-centered cubic lattice with Fe2+ and Fe3+ cations in interstitial sites. The tetrahedral (A) sites are occupied by Fe3+, and the octahedral (B) sites are randomly occupied by both Fe3+ and Fe2+, resulting in an inverse spinel structure.HAM1 There are a number of applications for Fe3O4 NP such as for recovering Ru catalysts from liquid-phase oxidation and hydrogenation reactions,JAC1 as a contrast agent for magnetic resonance imaging (MRI) in biological tissues, and for hyperthermia in experiments of cancer treatments,TAR1 among others.
Clustering of magnetic NP can be avoided by coating, where a layer of surfactant acts in changing the interaction between NP by altering the strength of the dipolar interaction. Different types of coating materials have been used for this purpose including silica and oleic acid. It is largely accepted that the oleic acid creates a non-magnetic and superficial single-layer surrounding the NP, thus reducing the magnetic interaction.ZHA1
Another feature related to the reduction of the dimension of magnetic granules is the decrease of the saturation magnetization (), which is smaller in NP than its corresponding bulk value. The reduction of in NP is a controversial issue with arguments in favor of finite size effects and surface spin disorder.MAR1 These effects are much more pronounced in ferrimagnetic systems like magnetite. In this case, the superexchange interaction between Fe ions is mediated through O2- ions,BER1 and incomplete coordination at the surface and/or oxygen vacancies are believed to be responsible for a surface spin disorder. This makes the total magnetization of the NP much smaller than the bulk value. Therefore, usually assumes lower values due to the increase of the surface/volume ratio.CAI1 The higher is the saturation magnetization, the more important is the material for practical applications. Therefore, it is important to understand how the saturation magnetization can be increased in a system of NP to make it valuable for practical applications. Previous studies indicated that covering magnetite NP with oleic acid (OA) results in higher values of due to the lowering of the surface magnetic disorder,GUA1 but the overall effect of the surfactant coating in the NP magnetic behavior is still an open question.
In this work we have investigated a series of magnetite NP prepared with two different coatings: oleic acid (OA samples) with different concentrations of magnetite (O65-65%, O76-76%, O78-78%), and dodecanoic acid (D63-63%). The samples were magnetically characterized through both ac and dc magnetic susceptibility measurements in order to gain further information regarding the influence of changing both the coating and the magnetic concentration in their overall magnetic behavior.
II Experimental Procedure
The synthesis of the OA coated NP was performed through a modified protocol for decomposition of an Iron(III) precursor in a high-temperature solution phase reaction, as described elsewhere.SUN1 ; SUN2 In a typical preparation, 2 mmol of Fe(acac)3 was dissolved in 6 mmol of OA, 4 mmol of oleylamine and 20 mL of phenyl ether, followed by addition of 10 mmol of 1,2-octanediol under vigorous magnetic stirring and flow of N2. The final mixture was heated at 210 ∘C and refluxed for 2 hours under N2 atmosphere. After the mixture was cooled down to room temperature, the Iron oxide NP were precipitated by adding ethanol and separated through centrifugation at 7000 rpm. The process was repeated several times until the supernatant solution became clear. Then, the NP were dried under vacuum and subjected to elemental analysis (CHN) in order to determine the amount of magnetic material. Samples containing 78, 76, and 65 % of mass corresponding to Iron oxide were prepared by adding or removing OA from the material prepared according to the procedure described above. In order to remove OA from the surface of the NP, the samples were subjected to reflux in acetone under N2 atmosphere for 2 hours.
The DA coated NP were obtained by using the same magnetite NP described above, after the OA excess removal from the sample. 6 mmol of iron oxide NP previously obtained were then heated with 9 mmol of dodecanoic acid and 10 mL of toluene as solvent at 80 ∘C for 40 minutes. After the mixture was cooled down to room temperature, the DA coated NP were precipitated by adding ethanol/acetone (1:1 v/v) and separated via centrifugation at 7000 rpm. The NP were dried under vacuum and subjected to elemental analysis. By combining the two procedures described above, we have successfully synthesized samples comprised of the same magnetite NP coated with both OA and DA and different concentrations of the magnetic material.
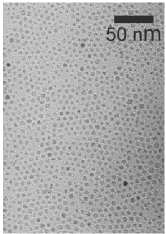
Transmission Electron Microscopy (TEM) was used to gain information regarding the morphology of the NP. The TEM images were obtained on a Philips CM 200 microscope operating at an accelerating voltage of 200 kV. The samples for TEM observations were prepared by placing a drop of a toluene solution containing the NP in a carbon-coated copper grid. The histograms of the NP size distribution, assuming spherical shape, were obtained from measurements of about 600 particles found in arbitrarily chosen areas of enlarged micrographs of different regions of the Cu grid.
All magnetization and ac magnetic susceptibility measurements were performed in a Quantum Design MPMS SQUID magnetometer for the monodispersed samples in powder form. The vs. curves were obtained using an excitation field of 1 Oe, in a wide range of frequencies, and under zero external dc magnetic field. The vs. measurements were performed under both zero-field cooled (ZFC) and field cooled (FC) conditions. The ZFC cycle was performed after heating up the sample up to 300 K, well above the blocking temperature, and cooling down the sample to 5 K without applied magnetic field. After this step, a small measuring magnetic field was applied, and the data were collected increasing the temperature from 5 to 300 K. In order to avoid remanent field from the superconducting coils, before cooling down the sample for the ZFC run the superconducting magnet has been reset three times. The FC measurements were performed after the ZFC cycle, cooling down the sample and keeping the same external magnetic field applied for the ZFC measurement. After each FC cycle, the temperature was increased to 300 K, the magnet has been reset, and the sample cooled down to 5 K for successive measurements.
The vs. measurements were performed after cooling the samples down to a desired temperature under zero external magnetic field. Once the temperature was reached, was cycled from 7 T to - 7 T, back and forth. After collecting the data for each vs. curve, the temperature was increased up to 300 K and the magnet reset three times, avoiding any remanent field for the subsequent measurement.
III Results and Discussion
III.1 Transmission electron microscopy
The results of TEM obtained for all samples indicated that the NP are uniform in shape and size and have a nearly spherical shape, as inferred from the image displayed in Figure 1. The diameter distribution was obtained by counting over than 600 NP and the data were fitted to a lognormal distribution, resulting in a mean diameter nm with a distribution width 0.15, and standard deviation 0.7 nm.
The critical diameter for monodomain formation in magnetic materials is given by , where is the exchange constant, is the magnetic anisotropy, and is the saturation magnetization. The critical diameter for the magnetite can be estimated by using the bulk values of , , and ( 1.3x10⁻¹¹ J/m, 1.35x10⁴ J/m3, and 4.6x10⁵ A/m), resulting in 28 nm. Therefore, the diameter of the magnetite nanoparticles studied here is well below its critical size, indicating that all particles, even the large ones, can be considered as single domain.
III.2 Magnetization versus temperature
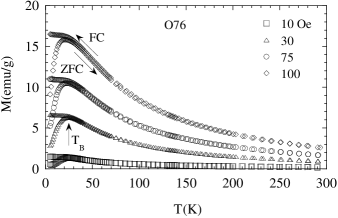
The dc magnetization curves vs. for all samples studied were found to exhibit similar features. Figure 2 shows typical curves obtained for the sample O76 under FC and ZFC conditions and for different measuring magnetic fields. A common feature of these curves is the occurrence of a well defined maximum in ZFC curves at a temperature , which is usually identified as the NP blocking temperature. As is increased, shifts monotonically towards lower temperatures.
By taking pairs of (, ) from similar curves as those displayed in Figure 2, one is able to build a vs. phase diagram. Such a phase diagram, for all samples studied, is displayed in Figure 3. The inset shows as a function of the normalized temperature /(=0). From the results of Figure 3, some general features can be observed: (i) is a monotonically decreasing function of ; (ii) increasing the concentration of the magnetic material results in an increase of ; (iii) all data follow a nearly universal curve when is replaced by the normalized temperature =/(=0), as shown in the inset of the Figure 3.

The systematic decrease of with increasing is frequently seen in systems comprised of magnetic NP. Such a behavior is related to the presence of dipolar interaction between NP and usually found in systems where the concentration of the magnetic material is high.KAC1 This is the case of our samples, in which the concentration of the magnetic material reaches values as high as 78%. On the other hand, the behavior of with observed here is quite different from the one found in frozen ferrofluids of magnetite NP suspended in a nonmagnetic solvent.LUO1 In such a system, where the magnetic concentration of NP is actually very low, the vs. phase diagram displays a well defined reentrant behavior. There, increases with increasing at low magnetic fields, passes through a maximum value, and decreases with increasing at high fields. Thus, the dipolar interactions in our samples are important and responsible for the vs. behavior displayed in Figure 3.
In fact, changes in the volume fraction of the magnetic material have their counterpart in the magnitude of (=0), obtained by extrapolating the vs. curves to = 0. We have found that increasing the concentration of the magnetic material results in a systematic increase of (=0), which ranged from K for the sample D63 to K for the sample O78. This result indicates that the increase in magnetic concentration leads to a progressive increase in , due to the increase in the interparticle interactions. Such an increase of with increasing magnetic volume has been predicted in theoretical models,DOR1 as well as in Monte Carlo simulations,OTE1 where dipolar interactions between magnetic NP are considered.
We also mention that the universal behavior observed in the versus =/(=0) curves (see inset of Fig. 3) is a convincing manifestation that all samples are comprised of the same magnetite NP. Under this circumstance, it seems that the only one effect related to the DI between NP is to shift to higher values, while features of the individual NP are preserved. The relevance of the DI in establishing is also supported by its value, which can be estimated for a system comprised of noninteracting NP. In this case, a rough estimate of the blocking temperature is obtained by using the expression , where , is the anisotropy constant ( 1.35x10⁴ J/m3 for the bulk magnetite), is the Boltzmann constant, and is the NP volume. Using the average diameter obtained in TEM images, the blocking temperature in the noninteracting limit was found to be 3 K, a value much lower than (=0) 14 K measured in all samples, further indicating the role played by the DI in our samples.
III.3 ac magnetic susceptibility versus temperature
The dynamic properties of the samples were also investigated by ac magnetic susceptibility measurements. Typical data of the temperature dependence of both components of the ( and ) for the sample O78 are displayed in Figure 4. The data were taken in a large range of frequencies , from 0.021 Hz up to 957 Hz, and under zero applied magnetic field. Some important features in these curves are: (i) the occurrence of a frequency dependent rounded maximum at and on both and components, respectively; (ii) increasing results in a shift of both and to higher temperatures; (iii) is essentially independent at high temperatures , indicating a superparamagnetic behavior of the Fe3O4 NP;Goya and (iv) a frequency dependent behavior of for , further suggesting the blocking process of the Fe3O4 NP.DOR3
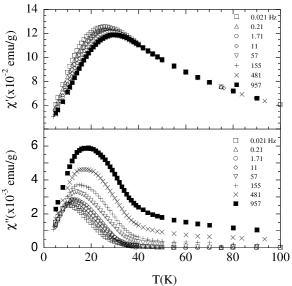
We also mention that the magnitude of the component increases appreciably with increasing , a feature commonly related to the presence of dipolar interactions between NP.JON Thus, mostly based on the results described above, it is tempting to discuss whether dipolar interactions between NP are responsible for the overall behavior of the data displayed in Figure 4. Such a discussion can be further explored by considering the inverse of the ac frequency as a function of the temperature in which peaks. A noninteracting system is believed to obey the Néel-Brown model, i.e., to follow an Arrhenius law ,BAT1 where is the characteristic relaxation time, is the anisotropy energy, and is the Boltzmann constant. The inset of Figure 5 shows the fitting to an Arrhenius law for the data of Fig. 4, resulting in s, and 1900 K. Although the fitting result is not poor, the obtained value is unphysically small and out of the expected range (roughly from s) as well as the anisotropy energy is exceptionally high when compared with 80 K, estimated by using the bulk value of and 5.5 nm. These combined results indicate that magnetic interactions between NP must be considered in any analysis performed in these samples.
On the other hand, it has been suggested that magnetic interactions between NP may result in an ordered state, with a spin-glass like behavior. In this case, a divergence of the relaxation time is expected to occur at a glass-like transition temperature , according to the conventional critical slowing down .DJU The critical exponent is expected to range from 4 up to 12 in conventional spin-glasses,MYD and values like have been reported for NP.DJU Fitting our data to this scale law resulted in a good fitting (not shown) with s, K but a very large value of . The value is compatible with results observed in NP of -Fe2O3 DOR2 and Fe-C,HAN2 although the values reported elsewhere were always much smaller ( and , respectively). Thus, based on this analysis, the existence of a critical behavior and the presence of a phase transition to a glass-like state can be disregarded in our samples.
Another approach to disclose the effect arising from the dipolar interactions between NP is to consider an extension of the noninteracting case (the Néel-Brown model) and similar to the above mentioned scale law, called the Vogel-Fulcher law, in which the relaxation time is given by . Such a law has been frequently used for describing the dynamic properties of systems in which the volume of the magnetic component is above a certain value and is a measure of the strength of the interparticle dipolar interaction.SUE Thus, we have fitted our data to the Vogel-Fulcher law and found an excellent agreement by using K, and s, as displayed in Figure 5. Such a result indicates that our data are consistent with a system in which dipolar interactions between NP are responsible for its dynamic properties.

We finally argue that in order to distinguish between a glass-type transition from superparamagnetic interacting NP, a model-independent empirical parameter with , estimated for 50 Hz,DOR3 can be considered. The resulting value is higher than those observed in conventional spin-glass systems (), and slightly smaller than the ones found in coupled granules ().DOR4 On the other hand, the ratio , evaluated near Hz and Hz and with obtained from the fit to the Vogel-Fulcher law, resulted in values higher than those observed for spin-glasses (), but in line with the ones expected for weakly-coupled interacting NP ().DOR4 This result reinforces the idea that for the samples studied here there is no evidence for a phase transition to a glass-like phase, and that represents a measure of the dipolar interaction.
III.4 Magnetization versus magnetic field
The vs curves for all samples studied were found to show similar behavior. Figure 6 displays typical vs. curves obtained for sample O76 at two selected temperatures: 5 and 300 K. The inset of Fig. 6 exhibits the vs. behavior at low magnetic fields. At low temperatures () the system is in the blocked state and curves vs. exhibit both remanence ( emu/g) and coercivity ( Oe). Our vs. data at several temperatures below also indicated that is symmetrical regarding the positive and negative values of the magnetic field, as well as , indicating that exchange bias are absent in our samples. We have also observed that at temperatures just above , both the remanence and the coercive field become negligible.


All vs. curves, where is the experimental saturation magnetization obtained at H = 7 T, measured at temperatures higher than were found to overlap in a common curve, as displayed in Figure 7 for the sample O76. Such an overlap of the vs. curves in all samples along with the near-zero clearly indicate the occurrence of superparamagnetism at temperatures higher than and below the bulk critical ferrimagnetic ordering temperature .
In the superparamagnetic phase, the collapsed vs. (, and ) curves are well described by a Langevin function weighted by a lognormal magnetic moment distribution , as discussed elsewhere.FON1 Figure 7 shows such a fitting for sample O76 and table I displays the mean magnetic moment (), mean magnetic diameter (), distribution width (), and standard deviation (), obtained from the fitting procedure. Table I also displays the corresponding mean diameters, obtained by using the saturation magnetization 460 emu/cm3 for the bulk magnetite and considering the nanoparticles as spheres.
A careful inspection of the data in Table I indicates that the mean particle diameter 4.9 nm, the distribution width , and the corresponding standard deviation 0.9 nm, obtained from the magnetization data, are very similar for all samples. This is an expected result since the samples were prepared from the same nanoparticles starting batch. In addition, these values are in excellent agreement with the ones obtained from TEM analysis, which were 5.5 nm, 0.15, and 0.7 nm.
| Sample | %MM | () | (nm) | (nm) | |
|---|---|---|---|---|---|
| D63 | 63 | 3157 | 4.8 | 0.19 | 0.9 |
| O65 | 65 | 3405 | 4.9 | 0.17 | 0.9 |
| O76 | 76 | 3528 | 5.0 | 0.19 | 1.0 |
| O78 | 78 | 3190 | 4.8 | 0.19 | 0.9 |
We have also observed, when the temperature is increased, that the magnitude of decreases accordingly and its saturation value is progressively reached at higher external magnetic fields. Mostly of the values at room temperature attained up to 80% of the bulk value 90 emu/g. These values of are quite impressive and well above the ones usually found in the literature,GOY1 ; GEE1 but in line with those obtained for NP of similar sizes.GUA1 The high values of found in our samples may be related to the nature of the coating used. It seems that both acids act in order to decrease the spin disorder at the surface of the nanoparticles, enhancing values. This kind of behavior has been also observed in Fe3O4 NP coated with oleic acid.GUA1

The temperature dependence of is of interest and needs to be further considered. For a ferromagnetic or ferrimagnetic material, the decrease of from its value at 0 K, , with increasing is related to the excitation of spin-waves with long wavelengths. For a continuous distribution of spin-wave states, the temperature dependence of the magnetization is expected to follow the Bloch’s law , where =(=0) and is a parameter proportional to the inverse of the exchange constant .
A commonly observed feature in systems comprised of nanosized particles is a deviation from the Bloch’s law at low temperatures. Such a deviation is primarily attributed to magnons with wavelengths larger than the particle dimensions that cannot be excited in nanosized materials. This results in a gap in the energy levels of the system and the spin waves are generated only when a threshold of thermal energy is achieved.MAN1 In any event, we have successfully fitted our data by using the Bloch’s law, as displayed in Figure 8 for the sample O76. Table II shows the parameters and , obtained from the fittings to the Bloch’s law for all samples. The values of , roughly ranging from to 3.56x, are essentially the same when compared to the one of x K-3/2 found in NP of magnetite with similar sizes.GOY1 Table II also shows the corresponding values of the exchange constant obtained from values of .
In a first approximation and for magnetite, is close related to the dominant exchange constant between tetrahedral (sublattice ) and octahedral (sublattice ) sites by:ARA1
| (1) |
where is the spin of the Fe3+ and the spin of the Fe2+ ions located in the octahedral magnetic sublattice. The spin wave stiffness constant has been also evaluated by using the relationship ,SRI1 where Å is the lattice parameter of the unit cell and .
| Sample | % MM | (x) | |||
|---|---|---|---|---|---|
| emu/g | K-3/2 | K | meVÅ2 | ||
| D63 | 63 | 87.4 | 3.56 | 9.0 | 100 |
| O65 | 65 | 83.2 | 3.54 | 9.1 | 106 |
| O76 | 76 | 96.0 | 3.35 | 9.4 | 110 |
| O78 | 78 | 88.5 | 3.28 | 9.5 | 112 |
The estimated values, displayed in Table II, indicate that decreases systematically as the concentration of magnetic material increases, a result followed by the values of . The progressive increase of with increasing volume fraction of the magnetic material indicates that represents an effective interaction between magnetic ions, including the interaction of those located at the surface. The values of K estimated in our samples were found to be twice smaller than the one of K obtained in magnetite single crystals by means of magnetization data.ARA1 We also notice that the estimated values of meVÅ2 in our series are smaller than the single crystal value of meVÅ2. Such a small discrepancy is certainly related to the fact that there is a smaller number of nearest neighbors for the surface spins, leading to a smaller effective than the one obtained in single crystals.

We finally notice that curves of vs. at a given temperature, for different magnetic concentrations and coatings also overlap, as shown in Figure 9 for K. This indicates that the nature of the coating acid and the dipolar interactions have only a quantitative effect on the vs. curves, but the qualitative features of the NP remain the same, and are well described by the intrinsic properties of the NP core.
Conclusions
In summary, samples comprised of magnetite NP coated with oleic and dodecanoic acids and with different magnetic concentrations have been synthesized and display superparamagnetic behavior at high temperatures. The NP ensemble may not be treated as a noninteracting monodomain system. The dipolar interactions between NP was found to play a role, although the overall magnetic behavior, mostly due to the same magnetic core, is preserved in samples with different volume fractions of the magnetic material. The NP diameters estimated from magnetization curves were found to be comparable with the ones obtained from TEM results, indicating that the magnetite core of the NP is the same for all particles. The main effect related to the increase in the magnetic concentration is the systematic increase of the blocking temperature due to an increase of the effective magnetic interaction between NP. Therefore, changing the NP coating resulted in no appreciable changes in the overall magnetic behavior of the samples. The high values of , corresponding to 80% of the bulk value, make these magnetite NP systems suitable for technological applications.
Acknowledgements.
This work was supported by the Brazilian agency Fundação de Amparo à Pesquisa do Estado de São Paulo (FAPESP) under Grant No. 2005/53241-9. Three of us (R.F.J., F.B.E., and L.M.R.) acknowledge the Conselho Nacional de Desenvolvimento Científico e Tecnológico (CNPq) for fellowships.References
- (1) M. Azeggagh and H. Kachkachi, Phys. Rev. B 75, 174410 (2007).
- (2) L. Néel, Ann. Phys. 3, 137 (1948).
- (3) W.C. Hamilton, Phys. Rev. 110, 1050 (1958).
- (4) See, for instance, M. J. Jacinto, P. K. Kiyohara, S. H. Masunaga, R. F. Jardim, and L. M. Rossi, Appl. Cat. A: Gen. 338, 52 (2008); M. J. Jacinto, O. H. C. F. Santos, R. F. Jardim, R. Landers, and L. M. Rossi, Appl. Cat. A: Gen. 360, 177 (2009).
- (5) P. Tartaj, M. P. Morales, S. Veintemillas-Verdaguer, T. González-Carreño, and C. J. Serna, J. Phys. D: Appl. Phys. 36, R182 (2003).
- (6) L. Zhang, R. He, and H. C. Gu, Appl. Surf. Sci. 253, 2611 (2006).
- (7) B. Martínez, X. Obradors, Ll. Balcells, A. Rouanet, and C. Monty, Phys. Rev. Lett. 80, 181 (1998).
- (8) A. E. Berkowitz, R. H. Kodama, S. A. Makhlouf, F. T. Parker, F. E. Spada, E. J. McNiff Jr., and S. Foner, J. Magn. Magn. Mater. 196, 591 (1999).
- (9) C. Caizer, Appl. Phys. A 80, 1745 (2005).
- (10) P. Guardia, B. Batlle-Brugal, A. G. Roca, O. Iglesias, M. P. Morales, C. J. Serna, A. Labarta, and X. Batlle, J. Magn. Magn. Mater. 316, e756 (2007) and references therein.
- (11) S. H. Sun and H. Zeng, J. Am. Chem. Soc. 124, 8204 (2002).
- (12) S. H. Sun, H. Zeng, D. B. Robinson, S. Raoux, P. M. Rice, S. X. Wang, and G. X. Li, J. Am. Chem. Soc. 126, 273 (2004).
- (13) H. Kachkachi, W. T. Coffey, D. S. F. Crothers, A. Ezzir, E. C. Kennedy, M. Noguès, and E. Tronc, J. Phys.: Condens. Matter 48, 3077 (2000).
- (14) W. Luo, S. R. Nagel, T. F. Rosenbaum, and R. E. Rosensweig, Phys. Rev. Lett. 67, 2721 (1991).
- (15) J.L. Dormann, D. Fiorani, and E. Tronc, J. Magn. Magn. Mater. 184, 262 (1998).
- (16) J. García-Otero, M. Porto, J. Rivas, and A. Bunde, Phys. Rev. Lett. 84, 167 (2000).
- (17) G. F. Goya, F. C. Fonseca, R. F. Jardim, R. Muccillo, N. L. V. Carreño, E. Longo, and E. R. Leite, J. Appl. Phys. 93, 6531 (2003).
- (18) J. L. Dormann, D. Fiorani, and E. Tronc, Adv. Chem. Phys. 98, 283 (1997).
- (19) T. Jonsson, J. Mattsson, P. Nordblad, and P. Svedlindh, J. Magn. Magn. Mater. 168, 269 (1997).
- (20) X. Batlle and A. Labarta, J. Phys. D 35, R15 (2002).
- (21) C. Djurberg, P. Svedlindh, P. Nordblad, M. F. Hansen, F. Bødker, and S. Mørup, Phys. Rev. Lett. 79, 5154 (1997).
- (22) A. Mydosh, Spin Glasses: An Experimental Introduction (Taylor and Francis, London) 1993.
- (23) J. L. Dormann, R. Cherkaoui, L. Spinu, M. Noguès, F. Lucari, F. D’Orazio, D. Fiorani, A. Garcia, E. Tronc, and J.P. Jolivet, J. Magn. Magn. Mater. 187, L139 (1998).
- (24) M. F. Hansen, P. E. Jönsson, P. Nordblad, and P. Svedlindh, J. Phys.: Condens. Matter 14, 4901 (2002).
- (25) S. H. Masunaga, R. F. Jardim, P. F. P. Fichtner, and J. Rivas, Phys. Rev. B 80, 184428 (2009).
- (26) J. L. Dormann, L. Bessais, and D. Fiorani, J. Phys. C 21, 2015 (1988).
- (27) F. C. Fonseca, G. F. Goya, R. F. Jardim, R. Muccillo, N. L. V. Carrenõ, E. Longo, and E. R. Leite, Phys. Rev. B 66, 104406 (2002).
- (28) G. F. Goya, T. S. Berquó, F. C. Fonseca, and M. P. Morales, J. App. Phys. 94, 3520 (2003).
- (29) S. H. Gee, Y. K. Hong, D. W. Erickson, M. H. Park, and J. C. Sur, J. App. Phys. 93, 7560 (2003).
- (30) K. Mandal, S. Mitra and P. A. Kumar, Europhys. Lett. 75, 618 (2006).
- (31) C. M. Srivastava and R. Aiyar, J. Phys. C 20, 1119 (1987).
- (32) R. Aragón, Phys. Rev. B 46, 5328 (1992).