Chromospheres and Winds of Red Supergiants:
An Empirical Look at
Outer Atmospheric Structure
Abstract
Stars between about 4 and 25 solar masses spend a significant fraction of their post-main sequence lifetime as red supergiants (RSGs) and lose material via stellar winds during this period. For RSGs more massive than 10 solar masses, this mass loss becomes of evolutionary significance, and probably determines the upper mass limit of RSGs in the Hertzsprung-Russell diagram. Despite decades of observations, the driving mechanism responsible for mass loss in RSGs remains unknown. Mainly this is because the optical spectrum accessible from the ground provides almost no useful wind diagnostics, and what information is obtained is spatially averaged over the entire wind volume. However, within the last decade, Hubble Space Telescope (HST) observations of many useful ultraviolet wind diagnostics have been obtained at a high signal-to-noise ratio and spectral resolution. In particular, RSGs in eclipsing binaries can provide spatially resolved observations of stellar chromospheres and winds. I review possible RSG wind acceleration mechanisms, discuss some observational constraints, and present some empirical models of RSG chromospheres and winds.
1. Stellar Winds in the H-R Diagram
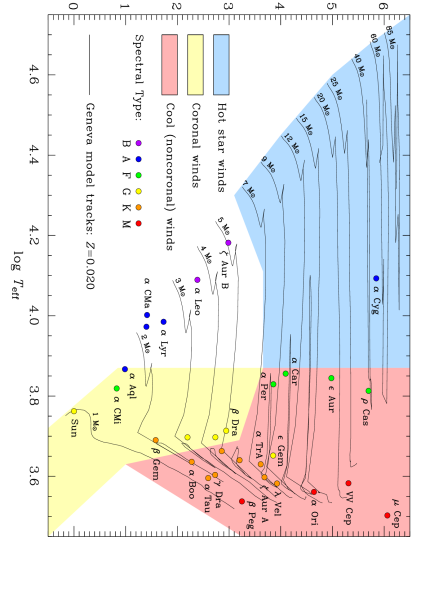
Stellar winds are a ubiquitous phenomenon across much of the Hertzsprung-Russell diagram (HRD). These winds can be broadly grouped into the three main categories of hot star winds, coronal (solar-type) winds, and the cool winds of evolved, late-type stars (Figure 1).
1.1. Hot Star Winds
Stars earlier than spectral class B3 typically have high velocity winds, and significant mass-loss rates. Radiation pressure is substantial in these stars since the (large) opacity of iron-group metals peaks in the mid-ultraviolet where the radiation field is strong, and so is the dominant term in the momentum equation. Castor, Abbott, & Klein (1975) showed that the winds of hot stars are driven by the force of radiation on optically thick atomic lines in regions above the photosphere, where the continuum is optically thin.
1.2. Coronal (Solar-type) Winds
Main sequence stars later than about F0 have substantial convective zones, which interact with stellar rotation to produce magnetically active photospheres. Acoustic waves and turbulence generated by convective “noise” propagate outward into the chromosphere, where the acoustic waves steepen into shocks and dissipate, producing localized, transient heating of the chromospheric gas (and the non-magnetic chromospheric line emission). Gas in the corona, lying above the chromosphere, is heated to million degree temperatures by dissipation of magnetic flux and reconnection of magnetic flux tubes tied by their photospheric footprint to convective motions. Coronal winds are tenuous with a mass-loss rate too small to be of evolutionary importance. These are driven mainly by the thermal pressure gradient of the hot corona, the Parker (1958) mechanism, although dynamic events in the corona (magnetic reconnection events, flares, and coronal mass ejections) also contribute to the solar wind mass flux (and presumably to that of similar stars also).
1.3. Cool Winds of Late-Type Stars
The red supergiant binary Her was first shown, by Deutsch (1956), to be losing mass via a stellar wind. The intervening decades of research have failed to produce a viable physical process that explains the mass-loss process in red giants and supergiants (Judge & Stencel 1991). In these stars, mass loss occurs via a low velocity (typically 20–50 km s-1), massive ( to M⊙ yr-1) wind. This cool wind regime is separated in the HRD from that of coronal winds by the Linsky & Haisch (1979) dividing line (Figure 1), which lies near spectral class K1 for red giants and around F0 for the most luminous supergiants. Noncoronal stars show generally weaker chromospheric emission line fluxes and a lower degree of ionization than the coronal stars, and have little or no detectable X-ray flux. There is little evidence of emission from gas warmer than about 20,000 K, and most of the gas must be much cooler than this.
2. Possible Mass-Loss Mechanisms in Red Giants and Supergiants
The most stringent constraint on possible mass-loss mechanisms is provided by the slowly accelerating nature of the wind. Consequently, most of the work done in driving these cool star winds goes into lifting material out of the stellar potential and not into the kinetic energy of the ejecta. This implies an effective driving force that only slightly exceeds gravity over distances of several stellar radii.
2.1. Pulsation
Pulsation plays a dominant role in initiating mass loss in Mira variables, OH/IR stars and other cool, evolved stars with optically thick, dusty winds (Bowen 1988). These are mostly highly evolved asymptotic giant branch (AGB) stars, but probably include some massive red supergiant (RSG) stars also, such as WOH G64. van Loon et al. (2008) showed that the ratio of wind kinetic energy to the power supplied by pulsation varies smoothly with pulsation period, being uniformly large for periods exceeding d. The RSGs blend in indistinguishably from the AGBs in this trend, suggesting that pulsation may be important in RSGs also. This is consistent with the suggestion of Judge & Stencel (1991) that long period waves (with periods longer than the acoustic cutoff period) generated by photospheric variability may drive mass loss. On the other hand, Josselin & Plez (2007) state “the extrapolation of the theory of mass loss of AGB stars [to RSGs] seems irrelevant as RSGs have only irregular, small-amplitude variations and are not pulsating in a similar manner”. In summary, while it is clear that pulsation is a leading contender amongst possible wind-driving mechanisms, and it is certainly energetically viable, there still is no definitive observational evidence that the winds of (most) RSGs are actually initiated or driven by pulsation. Nevertheless, the observational record is sparse, and the role of pulsation in RSGs remains very much an open question.
2.2. Radiation Pressure on Dust Grains
Dust grain opacities, unlike atomic opacities, peak in the infrared, and so ensure good coupling of the radiation field to the circumstellar material. As such, dust-driven winds (usually initiated by pulsation) have been among the most popular of proposed mechanisms explaining mass loss in red giants and supergiants, e.g. Lafon & Berruyer (1991), Höfner (2008). There is much evidence that dust-driven winds are the operative mechanism in Miras, OH/IR stars, and the optically thick, dusty winds of other highly evolved AGB stars (and possibly a few RSGs such as WOH G64). But these conclusions can not possibly be generalized to the very different conditions found in the optically thin winds of RSGs (and first ascent red giant branch stars). Some RSGs have relatively little dust, and where the dust emission has been spatially resolved by IR interferometry in the case of the M2 supergiant Ori (Bester et al. 1996), the observed dust shell lies at a distance of , far exterior to the empirically inferred wind acceleration region (Harper, Brown, & Lim 2001). Furthermore, VV Cep, another M2 supergiant in a binary system and spectral proxy of Ori, contains little or no dust, yet has a comparable mass-loss rate to that of Ori. Similar arguments were advanced years ago by Goldberg (1979) and Judge & Stencel (1991), and the passage of time has not diminished their logic. Radiation pressure on dust grains can not play a significant role in driving the optically thin winds of RSGs.
2.3. Dissipation of Alfvén Waves
One of the most plausible mechanisms proposed to drive mass loss in RSGs has been the dissipation of Alfvén waves. Unlike acoustic waves, Alfvén waves can have large damping lengths that are far more effective in transferring energy and momentum to the circumstellar gas over distances of the order of a stellar radius, as needed to produce stellar winds consistent with observations (Hartmann & MacGregor 1980). Alfvén wave dissipation is predicted to result in extended, warm chromospheres in low gravity stars — a result that was thought to be consistent with observation. Hartmann & Avrett (1984) constructed an Alfvén wave model appropriate for Ori which predicts a warm wind with electron temperatures peaking at K at ( is the radius of the stellar photosphere), and remaining above 5000 K out to . However, these results are in strong disagreement with the empirical model of Harper et al. (2001), in which the wind reaches a maximum temperature of just 4000 K in the lower chromosphere, then falls to 2500 K at and to 800 K by , with a nearly constant ionization fraction of . It seems unlikely that Alfvén waves, which couple only to ionized gas, could transfer the necessary energy and momentum to the wind in a nearly neutral gas that must be highly damping.
2.4. Acoustic Waves
Photospheric convection in late-type stars generates acoustic turbulence, and some of this acoustic energy propagates upward into the chromosphere. Athay & White (1979) showed, from solar UV observations, that the solar acoustic wave flux is (barely) sufficient to heat the chromosphere, but not the corona. Hartmann & MacGregor (1980) computed acoustic flux models for low gravity stars and concluded that “the primary dynamical effect of propagating acoustic waves and the shocks that develop from them is to extend the essentially hydrostatic portions of the lower atmosphere, rather than drive a steady wind”. Cuntz (1990) confirmed, using a 1-D hydrodynamic code, that short period acoustic waves dissipate and heat the chromosphere but do not contribute significantly to mass loss. More sophisticated hydrodyamical modeling of the solar chromosphere carried out by Carlsson & Stein (1995) further confirmed this outcome. The conclusion: short period acoustic waves heat chromospheres but do not cause significant mass loss.
2.5. Radiation Pressure on Atomic and Molecular Lines
The coupling of the cool radiation field of late-type stars to the line opacity of circumstellar gas is poor, and so the resulting radiative force is small. Molecules, with strong infrared bands, such as carbon monoxide, provide a better match, but their overall abundance is small, and hence their contribution to the radiative force is limited. Typically, empirical models of the outer atmospheres of RSGs give a radiative acceleration of the stellar gas of a few times cm s-2, or . This is 1.5 dex below the of the lowest gravity supergiant. Radiation pressure on the gas alone can not drive a stellar wind in red giants or supergiants.
3. A Tale of Four Stars
Ultimately, the nature of the driving force accelerating cool stellar winds will be resolved by observation. To this end, I have analyzed ultraviolet observations of three bright red supergiants observed with the HST Goddard High Resolution Spectrograph (GHRS) and the Space Telescope Imaging Spectrograph (STIS). With these results, and including the analysis of Harper et al. (2001) for Ori, we can present comparative empirical results for the following four RSGs:
-
•
Vel – the brightest K supergiant in the sky:
mag, K4 Ib -
•
Ori – the brightest M supergiant in the sky:
mag, M2 Iab -
•
Aur – the brightest eclipsing K supergiant binary:
mag, K4 Ib + B5 V, yr -
•
VV Cep – the brightest eclipsing M supergiant binary:
mag, M2 Iab + B, yr
The binaries are of particular interest because, in principle, they provide the opportunity of obtaining spatially resolved observations of the outer atmospheres and winds of these red supergiants.
3.1. Velorum
The UV spectrum of this red supergiant, observed in 1994 by HST/GHRS, contains numerous emission lines of singly ionized metals, especially Fe ii. Optically thin lines have a pure emission profile, but optically thicker lines show self-reversed absorption. This absorption feature forms just shortward of the line centre for slightly optically thick lines, and deepens and shifts blueward with increasing line optical depth. We interpret the velocity at the blueward edge of the absorption trough to be the velocity of the wind where the line becomes optically thin and the underlying emission profile (which forms close to the star) starts to show through. From this, we directly infer , where is the wind velocity and is the hydrogen column density of the wind. Then, assuming a spherical steady wind with radial hydrogen column density and velocity :
| (1) |
and so is found. Here is the mean particle mass, and is the hydrogen atom mass. Inverting this result yields the desired empirical wind velocity law with a mass-loss rate M⊙ yr-1 and a terminal velocity of about km s-1 .
3.2. Orionis
The line profile analysis technique used for Vel does not work well for Ori because the terminal velocity of the wind (10 km s-1) lies within the chromospheric line profile, which is broadened by turbulence of 20 km s-1. However, another approach is available. Because Ori has a large angular diameter (the largest of any RSG), its wind can be resolved by the Very Large Array (VLA) radio telescope. The resolved radio continuum is a useful diagnostic because the source function is thermal () and controlled by local conditions, which greatly simplifies modelling of the outer atmosphere and wind. Harper et al. (2001) used multi-wavelength VLA radio continuum fluxes, constrained by additional published radio and mid-IR fluxes, to derive an empirical model of the wind of Ori. The Harper et al. (2001) density model, assuming a spherical, steady flow, gives a mass-loss rate of M⊙ yr-1 and a slow wind acceleration with a terminal velocity of 10 km s-1.
3.3. Case Studies of Two Supergiant Binaries: Aur & VV Cep
Observations of RSGs in binary systems provide a unique opportunity to derive spatially resolved information about their outer atmospheres. RSG binaries are coeval systems with stars of roughly similar mass. The more massive star has evolved off the main sequence into the RSG region of the HRD, while the less massive component remains on the main sequence as a (typically) B star. In the ultraviolet (UV), essentially all the flux comes from the hot companion. Since the companion is very much smaller (in physical size, not mass) than the RSG, the UV line of sight to the companion samples only a small volume of the supergiant’s wind. Along sightlines close to the supergiant’s limb, a “chromospheric” absorption spectrum is seen superimposed upon the typically featureless B-type continuum. For the special case of eclipsing binaries, the sightlines during ingress and egress probe deep into the supergiant’s atmosphere and provide an unparalleled look at atmospheric structure on very small spatial scales (about 1–2% of the supergiant’s radius).
The potential of these RSG binaries (the Aur stars with G–K supergiant primaries, and the VV Cep stars with M supergiant primaries) has been recognized for decades but never fully realized, largely because these observations were done in the blue-violet region of the spectrum (Wilson & Abt 1954; Wright 1970). In this spectral region, both stars typically have comparable fluxes, and the composite spectrum must be disentangled before useful analysis can be done. Also, nearly all of the strong resonance and low-lying atomic transitions, which are most useful for mapping the chromosphere, lie in the UV spectrum inaccessible from the ground. The situation has changed dramatically in recent decades starting with the launch of IUE in 1978, and continuing with the HST/GHRS and STIS spectrographs, and the recent Far Ultraviolet Spectroscopic Explorer (FUSE) mission. These space missions revolutionized stellar astronomy by making the UV spectra of stars accessible.
3.4. Aurigae
In the mid-1990s, Aur (orbital period yr) was observed at a series of 11 epochs over 2 orbital periods (Figure 2) by the HST/GHRS. These observations permitted the circumstellar density profile to be mapped, the mean wind law and velocity structure to be derived (assuming steady, spherical flow), and provided definitive evidence of substantial orbit-to-orbit variability in the wind structure. This analysis gave a mass loss rate M⊙ yr-1 with a terminal velocity of km s-1.
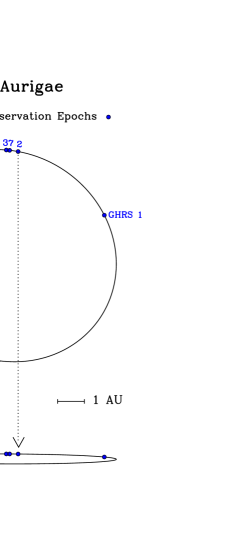

The development of the chromospheric spectrum as eclipse ingress progresses is also shown in Figure 2. It is evident that line profiles show complex structure, especially near eclipse where two components are often present in the line core (see Epoch 4 in particular).
3.5. VV Cephei
The UV spectrum of VV Cep was observed in total eclipse, for the first time, in November 1997 with the newly commissioned HST/STIS echelle spectrograph. Observations of VV Cep continued on for a total of 21 epochs, ending just past first quadrature in 2003. In eclipse, VV Cep has a rich emission line spectrum with more than 2000 features between 1300 and 3150 Å (Bauer, Bennett, & Brown 2007). Immediately after egress, VV Cep shows a complex chromospheric absorption spectrum, while far from eclipse (near quadrature), an inverse P-Cygni “shell” spectrum becomes prominent. In particular, the chromospheric lines sometimes show doubling of the line profiles, indicating the presence of complex velocity structure in the lower chromosphere. Despite this complexity, reliable line-of-sight (tangential) column densities through the chromosphere can be obtained from analysis of the prominent damping wings of the stronger atomic lines, e.g., Mg ii & , H i Lyman-, and the stronger lines of Fe ii. These tangential column densities can then be used to construct a density model of the chromosphere and wind of VV Cep. The resulting wind model has a mass-loss rate of = 1.5 M⊙ yr-1 with a terminal velocity of km s-1.
4. The Wind Velocity Law
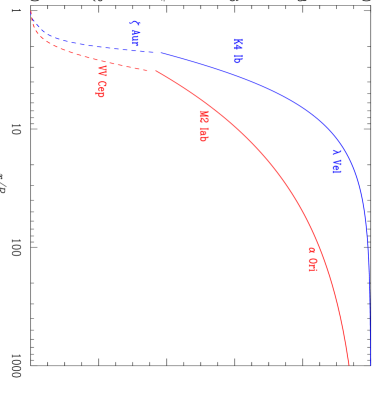
We can use these RSG analyses to piece together an idea of the actual wind velocity law. The binary technique excels at observations in the chromosphere and the base of the wind, where pertubations due to the companion are minimal. But, given the separation of stars is only about for both Aur and VV Cep (where is the semi-major axis, the stellar radius), it is unlikely that the binary approach provides much useful information at radial distances beyond . In this regard the radio continuum flux method is complementary since (at present) the spatial resolution is limited to about for Ori. Similarly, the line profile analysis used for Vel works best for the strong lines with well-defined absorption troughs with well-defined blue edges and so is well-suited for recovering structure in the outer wind.
One can get a sense of the complete wind laws for K and M supergiants by combining the results of these analyses in a single diagram (Figure 3). The dashed curves derived for the binary supergiants are only useful out to a distance of about , while the solid curves of the single stars are only meaningful beyond 2–. Presumably combining the useful parts of each of these curves should approximate the complete velocity law of K and M supergiants.
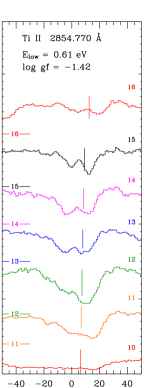
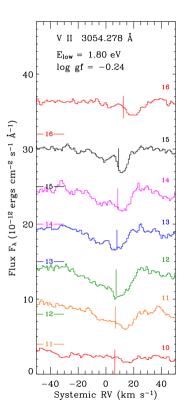
5. Line Doubling in the Chromospheric Spectrum
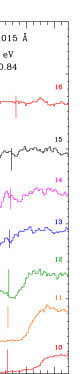
Despite these results, we still know little about what drives these supergiant winds. Some of the assumptions adopted are manifestly incorrect, e.g., that of a steady wind, given the obvious line profile changes in the UV spectrum of Vel between 1990 and 1994 (Carpenter et al. 1999, Fig. 10). The cores of chromospheric absorption lines are typically double (e.g., see the Epoch 4 spectrum, Figure 2). McKellar et al. (1959) presented the first detailed description of RSG chromospheric line doubling, as observed in the Ca ii -line of the RSG 31 Cygni. Line doubling is seen in our HST observations of VV Cep (Figure 4). The profile shape and position vary somewhat from epoch to epoch, but the separation of the components remains approximately constant. For VV Cep, averaging over several lines and epochs gives a mean separation of the components of km s-1. These components straddle the supergiant’s RV, with the mean blue component at km s-1 (systemic).
The relative strength of these components is strongly correlated with lower-level excitation potential. Low excitation lines have a dominant blue component, but the strength of the red component increases with excitation potential. Lines from levels above 1 eV show predominantly red components. The line-doubling phenomenon appears to be ubiquitous in RSG chromospheres and needs to be understood before more realistic models can be constructed.
Acknowledgments.
This research was based on observations with the NASA/ESA Hubble Space Telescope obtained at the Space Telescope Science Institute (STScI). Support for Programs GO-7269, GO-8257, GO-8779 and GO-9231 (PDB) was provided by NASA through grants from STScI, which is operated by AURA, Inc. under NASA contract NAS5-26555.
References
- Athay & White (1979) Athay, R. G. & White O. R. 1979, ApJS, 39, 333
- Bauer et al. (2007) Bauer, W. H., Bennett, P. D., & Brown, A. 2007, ApJS, 171, 249
- Bester et al. (1996) Bester, M., Danchi, W. C., Hale, D., Townes, C. H., Degiacomi, C. G., Mékarnia, D., & Geballe, T. R. 1996, ApJ, 463, 336
- Bowen (1988) Bowen, G. H. 1988, ApJ, 329, 299
- Carlsson & Stein (1995) Carlsson, M., & Stein, R. F. 1995, ApJ, 444, L29
- Carpenter et al. (1999) Carpenter, K. G., Robinson, R. D., Harper, G. M., Bennett, P. D., Brown, A., & Mullan, D. J. 1999, ApJ, 521, 382
- Castor et al. (1975) Castor, J. I., Abbott, D. C., & Klein, R. I. 1975, ApJ, 195, 157
- Cuntz (1990) Cuntz, M. 1990, ApJ, 353, 255
- Deutsch (1956) Deutsch, A. J. 1956, ApJ, 123, 210
- Goldberg (1979) Goldberg, L. 1979, QJRAS, 20, 361
- Harper et al. (2001) Harper, G. M., Brown, A., & Lim, J. 2001, ApJ, 551, 1073
- Hartmann & Avrett (1984) Hartmann, L., & Avrett, E. H. 1984, ApJ, 284, 238
- Hartmann & MacGregor (1980) Hartmann, L., & MacGregor, K. B. 1980, ApJ, 242,260
- Höfner (2008) Höfner, S. 2008, Phys. Scripta, T133, 014007
- Josselin & Plez (2007) Josselin, E., & Plez, B. 2007, A&A, 469, 671
- Judge & Stencel (1991) Judge, P. G., & Stencel, R. E. 1991, ApJ, 371, 357
- Lafon & Berruyer (1991) Lafon, J.-P. J., & Berruyer, N. 1991, A&ARev, 2, 249
- Linsky & Haisch (1979) Linsky, J. L., & Haisch, B. M. 1979, ApJ, 229, L27
- McKellar et al. (1959) McKellar, A., Aller, L. H., Odgers, G. J., & Richardson, E. H. 1959, Publ. DAO, 11, 35
- Parker (1958) Parker, E. N. 1958, ApJ, 128, 664
- van Loon et al. (2008) van Loon, J. Th., Cohen, M., Oliveira, J. M., Matsuura, M., McDonald, I., Sloan, G. C., Wood, P. R., & Zijlstra, A. A. 2008, A&A, 487, 1055
- Wilson & Abt (1954) Wilson, O. C., & Abt, H. A. 1954, ApJS, 1, 1
- Wright (1970) Wright, K. O. 1970, Vistas in Astr., 12, 147