75As NQR and NMR studies of superconductivity and electron correlations in iron arsenide LiFeAs
Abstract
We report the 75As-NQR and NMR studies on the iron arsenide superconductor LiFeAs with K. The spin lattice relaxation rate, , decreases below without a coherence peak, and can be fitted by gaps with s±-wave symmetry in the presence of impurity scattering. In the normal state, both and the Knight shift decrease with decreasing temperature but become constant below . Estimate of the Korringa ratio shows that the spin correlations are weaker than that in other families of iron arsenides, which may account for the lower in this material.
The discovery of superconductivity in LaFeAsO1-xFx[1] has generated strong interest on iron pnictide materials. Among them the most extensively studied materials are ReFeAsO1-xFx (Re: rare earth elements, so-called 1111 compound)[2, 3, 4, 5] and AFe2As2 (A: Ba, Sr, Ca, so-called 122 compound)[6, 7, 8] systems. Both of their parent compounds show a spin density wave (SDW) ordering and a tetragonal-orthorhombic structural phase transition. With doping, SDW is suppressed and superconductivity emerges. The superconductivity is found to be in the spin-singlet state[9, 10] with multiple gaps[9, 10, 11]. The Fermi surfaces (FS) consist of two hole-pockets centered at point (0, 0) and two electron-pockets around point ( )[12]. It has been proposed that the Fermi surface nesting between the hole- and electron-pockets may promote spin fluctuations[13, 14, 15, 16] and superconductivity with s±-wave symmetry[13, 14, 17] that possesses isotropic gaps on each FS with the relative phase of between them.
Soon after the discovery of 1111 and 122 compounds, another arsenide, LiFeAs (so-called 111 compound)[18, 19], was discovered to show superconductivity even in stoichiometric composition without SDW transition[20]. It has Cu2Sb type tetragonal structure with space group P4/nmm[19]. The K is lower than 1111 and 122 materials. Local density approximation (LDA) shows that there are also hole pockets on the point and electron pockets on the M point[12], although angle-resolved photoemission spectroscopy (ARPES) has not found FS nesting[21]. A question one can ask is why is lower in this system.
In this letter, we report a study on LiFeAs ( K) using the 75As nuclear quadrupole-resonance (NQR) and 75As nuclear magnetic resonance (NMR) techniques. The measurement was carried out down to 1/10 which allows us to discuss about the gap symmetry with less ambiguity. We find that the spin lattice relaxation rate, , decreases below without a coherence peak, resembling the case of 1111 and 122 systems. The result can be fitted by gaps with s±-wave symmetry in the presence of impurity scattering. In the normal state, both the Knight shift and decrease with decreasing temperature. The Korringa ratio is found to be close to unity, indicating that spin correlations are weak in LiFeAs, which may account for the lower than other iron arsenides.
Two polycrystalline samples of LixFeAs with nominal and were prepared by employing high pressure method[18]. The starting materials of Li () and FeAs were mixed. The pellets of mixed starting materials wrapped with gold foil were sintered at 1 GPa to 1.8 GPa, 800 for 60 min. followed by quenching from high temperature before releasing pressure. The FeAs precursors were synthesized by sintering the mixtures of high purity Fe and As powders sealed in an evacuated quartz tube. Powder x-ray diffraction (XRD) indicates that the samples are of single phase. The physical properties including the NMR results are the same. This supports that only stoichiometric compound can be formed.[19] In the following we only present the results for the sample with nominal .
For NQR and NMR measurements, the pellets were crushed into coarse powders and sealed into epoxy (stycast) cases. All operations were performed in a glove box filled with He gas. AC susceptibility measurements using the NQR/NMR coils indicate that for the powdered sample is 17 K at zero magnetic field and 16 K at T. NQR and NMR measurements were carried out by using a phase coherent spectrometer. The NQR spectra were taken by changing the frequency () point by point, while the NMR spectra were taken by sweeping the magnetic field at a fixed frequency. The Knight shift was determined with respect to with MHz/T. The spin-lattice relaxation rate was measured by using a single saturation pulse.
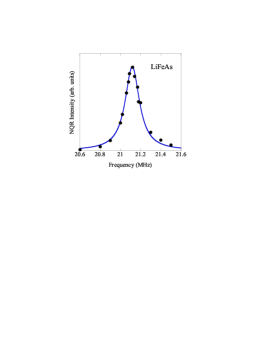
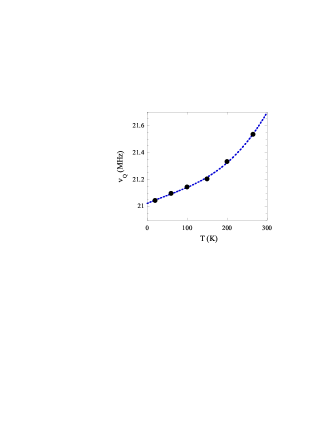
Figure 1 shows the 75As-NQR spectrum at K. The clear single peak structure is observed and it can be fitted by a single Lorentzian curve, suggesting that the sample is homogeneous. The NQR frequency MHz is much larger than LaFeAsO0.92F0.08 ( MHz)[22] and Ba0.72K0.28Fe2As2 ( MHz)[10]. Figure 2 shows the -dependence of measured by NQR at zero magnetic field and determined from an excellent fit of the nuclear magnetization to the single exponential function , where and are the nuclear magnetization in the thermal equilibrium and at a time after the saturating pulse, respectively. As seen in the figure, shows no coherence peak just below , which is similar to other iron arsenide superconductors[22, 9, 10, 23, 24]. Below , becomes to be proportional to in the present case, which was also seen in BaFe2(As0.67P0.33)2 [25] and LaFeAs1-δO0.9F0.1 [26], and was explained by the existence of a residual density of states (RDOS) in a line-node model [25].
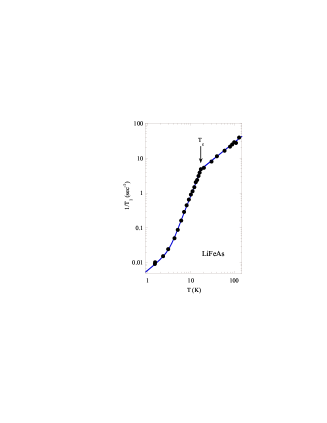
Indeed, our data can also be accounted for qualitatively by a -wave model[9, 10, 22], in the presence of impurity scattering. On the other hand, it has been proposed that the -wave is more stabilized given the Fermi surface topology.[13, 14] In the -wave model, the gaps on each FS are isotropic but the relative phase between them is . Impurity scattering between the electron and hole pockets could also induce a finite DOS at the Ferimi level.[27] However, an -wave without sign change, namely -wave[29] would not be able to reproduce the data at low temperature, since a finite DOS is not induced by impurity scattering in this model. Below we show that -wave model can fit the data quite well. By introducing the impurity scattering parameter in the energy spectrum in the form of , the nuclear spin-lattice relaxation rate is given by [28]
| (1) |
where
| (2) | |||
| (3) |
Here the is the gap parameter. is the average over the entire Fermi-surface, and it sums over the contributions from two bands. Namely, for a quantity ,
| (4) |
Where () is the density of state (DOS) coming from band (). Our fitting assumes that two gaps with different size open on different FS. It is tempting to assume that the larger gap with positive phase is on the electron FS at M point and the smaller gap with negative phase is on the hole FS at point[21]. The parameters , , and can fit the data well as shown by the solid curve in Fig. 2. The is smaller than that in LaFeAsO0.92F0.08 ( , ) [22] and Ba0.72K0.28Fe2As2 ( , ) systems[10]. The impurity scattering parameter , where is the impurity concentration and is the scattering potential at the impurity, is slightly larger than that in LaFeAsO0.92F0.08 ( ) [22] and Ba0.72K0.28Fe2As2 ( ) [10], which accounts for the -linear behavior at low temperature. The gap values obtained in our study is comparable to ARPES value , [21].
The results suggest that the superconducting properties are quite similar to 1111 and 122 systems. This in turn suggests that the microscopic electronic structure is similar to 1111 and 122 systems, as suggested by LDA calculation[12]. In fact, if there is a large difference in the FS topology, the superconducting property was shown to be drastically different. In LaNiAsO1-xFx ( K), there is no hole pocket around point[30] and the FS nesting can not happen. There, shows a well-defined coherence peak just below followed by an exponential decay at lower temperature[31].
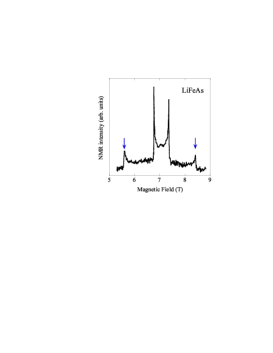
In order to gain insights into the normal state properties, we also performed NMR measurements. Figure 3 shows the 75As-NMR spectrum in LiFeAs at K. The two satellites indicated by the arrows correspond to the and transitions. The estimated from the distance between the two satellites agrees well with the NQR result. The left peak of the central transitions (the two singularities in the center) corresponds to -axis. Both the Knight shift and were measured at this peak. The right peak of the central transition corresponds to , where is the angle between and the -axis. NQR measurements correspond to -axis, since the principal axis of the NQR tensors is along the -axis.
The measured shift of the central transition corresponding to consists of the Knight shift and the shift due to second-order perturbation of the nuclear quadrupole interaction in the case of nuclear spin
| (5) |
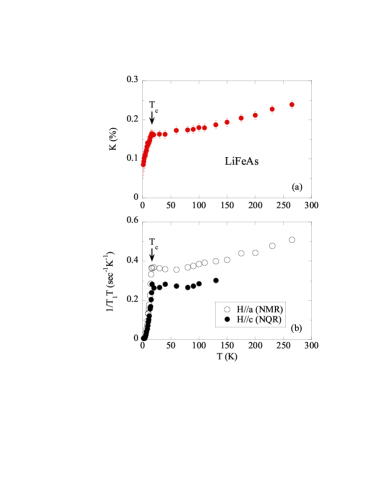
where is the field corresponding to the peak of . In order to get accurate , vs was plotted. From the linear fitting, was deduced as the intercept, while from the slope of the plot can be obtained. The -dependence of so obtained is shown in Fig. 4, which decreases with decreasing temperature. Figure 5 (a) shows the temperature dependence of . It decreases with decreasing temperature but becomes almost constant below K, which resembles the cases of NaCoO1.3H2O superconductor[32]. Our result is consistent with a recent report by Jeglic et al[33].
We also measured the corresponding to . The data are shown in the form of in Fig. 5 (b). The temperature dependence of has similar behavior as the Knight shift. It also decreases with decreasing temperature and becomes almost constant below 50 K. The result is different from that obtained by Jeglic et al who reported a constant up to room temperature[33]. The anisotropy between and is consistent with that observed in 122 system[10].
The constant behavior of both and below K suggests that the electron correlations are weak. This is in contrast to the Ba0.72K0.28Fe2As2[10] and LaFeAsO0.92F0.08[22], where increase with decreasing down to . In order to evaluate more quantitatively the strength of the electron correlations, it is useful to estimate the quantity where is the Knight shift due to spin susceptibility. The so-called Korringa ratio
| (6) |
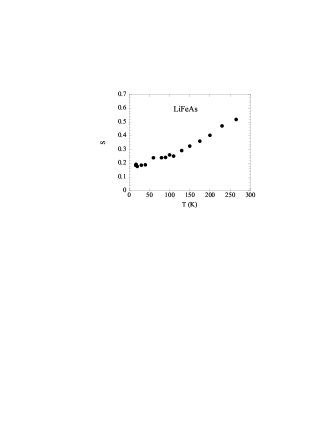
where and are the electron and nuclear gyromagnetic ratios, is unity for noninteracting Fermi gas. For strongly antiferromagnetically correlated metals, . For ferromagnetically correlated metals, on the other hand, . The quantity of LiFeAs is plotted in Fig. 6, assuming which is the value of at K. is close to 1, suggesting that the spin correlations in LiFeAs are weak, which is in accordance with theoretical prediction[34]. This conclusion does not depend on the choice of the value of . For example, if one assumes , then K and K. For comparison, we note that is 1/50 in the electron-doped cuprate superconductor due to antiferromagnetic spin correlations, even though the relation =const. holds [35]. Such weak correlations may account for the lower in LiFeAs than other iron arsenides where electron correlations are strong or moderate. Finally, we comment on the temperature dependence of . As seen in Fig. 6, with decreasing temperature, decreases but becomes almost constant below K. The origin for this -dependence is unclear at present. One possibility is that there does exist some kind of weak spin correlation at a finite wave vector . Since is proportional to the sum of susceptibility over all but the Knight shift is decided only by the susceptibility at , it may result in the decrease of . In any case, the value of close to unity indicates that such -dependent correlation is not strong and it ceases to develop below =50 K.
In summary, we have performed NQR and NMR measurements on LiFeAs with K. Below , decreases with no coherence peak and can be fitted by gaps with s±-wave symmetry in the presence of impurity scattering. The gaps obtained are and , the former is smaller than that in 1111 and 122 systems. In the normal state, both and the Knight shift decrease with decreasing temperature but becomes constant below . Estimate of the Korringa ratio indicates that the electron correlations are weak in LiFeAs, which may account for its lower .
We thank S. Kawasaki, K. Matano, T. Tabuchi for help in some of the measurements. This work was supported in part by research grants from MEXT and JSPS (No. 20244058 and No. 17072005. The work at IOP was supported by NSFC.
References
- [1] Y. Kamihara, T. Watanabe, M. Hirano, and H. Hosono, J. Am. Chem. Soc. 130, 3296 (2008).
- [2] G. F. Chen, Z. Li, D. Wu, G. Li, W. Z. Hu, J. Dong, P. Zheng, J. L. L. Luo, and N. L. Wang, Phys. Rev. Lett. 100, 247002 (2008).
- [3] Z. A. Ren, J. Yang, W. Lu, W. Yi, G. C. Che, X. L. Dong, L. L. Sun, and Z. X. Zhao, Mater. Res. Innovations 12, 105 (2008).
- [4] Z. A. Ren, J. Yang, W. Lu, X. L. Shen, Z. C. Li, G. C. Che, X. L. Dong, L. L. Sun, F. Zhou, and Z. X. Zhao, Europhys. Lett. 82, 57002 (2008).
- [5] X. H .Chen, T. Wu, G. Wu, R. H. Liu, H. Chen and D. F. Fang, Nature 453, 761 (2008).
- [6] M. Rotter, M. Tegel, and D. Johrendt, Phys. Rev. Lett. 101, 107006 (2008).
- [7] G. F. Chen, Z. Li, G. Li, W. Z. Hu, J. Dong, J. Zhou, X. D. Zhang, P. Zheng, N. L. Wang, and J. L. Luo, Chin. Phys. Lett. 25, 3403 (2008).
- [8] M. S. Torikachvili, S. L. Bud ko, N. Ni and P. C. Canfield, Phys. Rev. Lett. 101, 057006 (2008).
- [9] K. Matano, Z. A. Ren, X. L. Dong, L. L. Sun, F. Zhou, Z. X. Zhao and G.-q. Zheng, Europhys. Lett. 83, 57001 (2008).
- [10] K. Matano, Z. Li, G. L. Sun, D. L. Sun, C. T. Lin, M. Ichioka, and G.-q. Zheng, Europhys. Lett. 87, 27012 (2009).
- [11] H. Ding, P. Richard, K. Nakayama, K. Sugawara, T. Arakane, Y. Sekiba, A. Takayama, S. Souma, T. Sato, T. Takahashi, Z. Wang, X. Dai, Z. Fang, G. F. Chen, J. L. Luo, and N. L. Wang, Europhys. Lett. 83, 47001 (2008).
- [12] D. J. Singh and M. H. Du, Phys. Rev. Lett. 100, 237003 (2008).
- [13] I. I. Mazin, D. J. Singh, M. D. Johannes, and M. H. Du, Phys. Rev. Lett. 101, 057003 (2008).
- [14] K. Kuroki, S. Onari, R. Arita, H. Usui, Y. Tanaka, H. Kontani, and H. Aoki, Phys. Rev. Lett. 101, 087004 (2008).
- [15] A. V. Chubukov, D. Efremov and I. Eremin, Phys. Rev. B 78, 134512 (2008).
- [16] T. Kariyado and M. Ogata, J. Phys. Soc. Jpn 78, 043708 (2009).
- [17] F. Wang, H. Zhai, Y. Ran, A. Vishwanath and D. H. Lee, Phys. Rev. Lett. 102, 047005 (2009).
- [18] X. C. Wang, Q. Q. Liu, Y. X. Lv, W. B. Gao, L. X. Yang, R. C. Yu, F. Y. Li, and C. Q. Jin, Solid State Commun. 148, 538 (2008).
- [19] J. H. Tapp, Z. Tang, B. Lv, K. Sasmal, B. Lorenz, P. C. W. Chu, and A. M. Guloy, Phys. Rev. B 78, 060505 (2008).
- [20] S. J. Zhang, X. C. Wang, R. Sammynaiken, J. S. Tse, L. X. Yang, Z. Li, Q. Q. Liu, S. Desgreniers, Y. Yao, H. Z. Liu, and C. Q. Jin, Phys. Rev. B 80, 014506 (2009).
- [21] S. V. Borisenko, V. B. Zabolotnyy, D. V. Evtushinsky, T. K. Kim, I. V. Morozov, A. N. Yaresko, A. A. Kordyuk, G. Behr, A. Vasiliev, R. Follath, and B. Buechner, arXiv: 1001, 1147 (2010).
- [22] S. Kawasaki, K. Shimada, G. F. Chen, J. L. Luo, N. L. Wang, and G.-q. Zheng, Phys. Rev. B 78, 220506 (2008).
- [23] Y. Nakai, K. Ishida, Y. Kamihara, M. Hirano, and H. Hosono, J. Phys. Soc. Jpn. 77, 073701 (2008).
- [24] H. J. Grafe, D. Paar, G. Lang, N. J. Curro, G. Behr, J. Werner, J. H. Borrero, C. Hess, N. Leps, R. Klingeler, and B. Buchner, Phys. Rev. Lett. 101, 047003 (2008).
- [25] Y. Nakai, T. Iye, S. Kitagawa, K. Ishida, S. Kasahara, T. Shibauchi, Y. Matsuda, and T. Terashima, Phys. Rev. B 81, 020503(R) (2010).
- [26] F. Hammerath, S. -L. Drechsler, H. -J. Grafe, G. Lang, G. Fuchs, G. Behr, I. Eremin, M. M. Korshunov, and B. Buchner, Phys. Rev. B 81, 140504(R) (2010).
- [27] Y. Bang, H. Y. Choi, Phys. Rev. B 78, 134523 (2008).
- [28] Y. Nagai, N. Hayashi, N. Nakai, H. Nakamura, M. Okumura, and M. Machida, New. J. Phys. 10, 103026 (2008).
- [29] Y. Yanagi, Y. Yamakawa, N. Adachi, and Y. Ono, arXiv: 1005. 2841 (2010).
- [30] G. Xu, W. Ming, Y. Yao, X. Dai, S. C. Zhang, and Z. Fang, EuroPhys. Lett. 82, 67002 (2008).
- [31] T. Tabuchi, Z. Li, G. F. Chen, S. Kawasaki, J. L. Luo, N. L. Wang, and G.-q, Zheng, Phys. Rev. B 81, 140509 (2010).
- [32] G.- q. Zheng, K. Matano, D. P. Chen, and C. T. Lin, Phys. Rev. B 73, 180503 (2006).
- [33] P. Jeglic, A Potocnik, M. Klanjsek, M. Bobnar, M. Jagodic, K. Koch, H. Rosner, S. Margadonna, B. Lv, A. M. Guloy, and D. Arcon, Phys. Rev. B 81, 140511 (2010).
- [34] Z. Li, J. S. Tse, and C. Q. Jin, Phys. Rev. B 80, 092503 (2009).
- [35] G.-q. Zheng, T. Sato, Y. Kitaoka, M. Fujita, and K. Yamada, Phys. Rev. Lett. 90, 197005 (2003).