11email: francesca.annibali@oapd.inaf.it alessandro.bressan@oapd.inaf.it roberto.rampazzo@oapd.inaf.it 22institutetext: SISSA/ISAS, via Beirut 2-4, 34151 Trieste, ITALY
33institutetext: INAOE, Luis Enrique Erro 1,72840 Tonantzintla, Puebla, Mexico
33email: ovega@inaoep.mx 44institutetext: Institut für Astronomie der Universität Wien, Türkenschanzstrae 17, A-1180 Wien, Austria
44email: zeilinger@astro.univie.ac.at 55institutetext: CEA Saclay/Service d Astrophysique, Laboratoire AIM,CEA/DSM/IRFU-CNRS-Université Paris Diderot, F-91191 Gif-sur-Yvette Cédex, France
55email: pasquale.panuzzo@cea.fr
Nearby early-type galaxies with ionized gas.
Aims. A significant fraction of early-type galaxies (ETGs) show emission lines in their optical spectra. We aim at understanding the powering mechanism and the origin of the ionized gas in ETGs, and its connection with the host galaxy evolution.
Methods. We analyzed intermediate-resolution optical spectra of a sample of 65 ETGs, mostly located in low density environments and biased toward the presence of ISM traces, for which we already derived in the previous papers of the series the stellar population properties. To extract the emission lines from the galaxy spectra, we developed a new fitting procedure that properly subtracts the underlying stellar continuum, and that accounts for the uncertainties due to the age-metallicity degeneracy. The emission line luminosities derived in annuli of increasing galacto-centric distance were used to constrain the excitation mechanism and the metallicity of the ionized gas.
Results. Optical emission lines are detected in 89% of the sample. The detection fraction drops to 57% if only the galaxies with EW(H [NII])3 Å are considered. The incidence and strength of emission do not correlate either with the E/S0 classification, or with the fast/slow rotator classification. Comparing the nuclear rre/16 emission with the classical [OIII]/H vs [NII]/H diagnostic diagram, the galaxy activity is so classified: 72% of the galaxies with emission are LINERs, 9% are Seyferts, 12% are Composite/Transition objects, and 7% are non-classified. Seyferts have young luminosity-weighted ages ( 5 Gyr), and appear, on average, significantly younger than LINERs and Composites. Excluding the Seyfert galaxies from our sample, we find that the spread in the ([OIII], H or [NII]) emission strength increases with the galaxy central velocity dispersion , low- galaxies having all weak emission lines, and high- galaxies displaying both weak and strong emission lines. Furthermore, the [NII]/H ratio tends to increase with . A spatial analysis of the emission line properties within the individual galaxies reveals that the [NII]/H ratio decreases with increasing galacto-centric distance, indicating either a decrease of the nebular metallicity, or a progressive “softening” of the ionizing spectrum. The average nebular oxygen abundance is slightly less than solar. A comparison with the stellar metallicities derived in Paper III shows that the gas oxygen abundance is 0.2 dex lower than that of stars.
Conclusions. The stronger nuclear (r) emission can be explained with photoionization by PAGB stars alone only for 22% of the LINERs/Composite sample. On the other hand, we can not exclude an important role of PAGB star photoionization at larger radii. For the major fraction of the sample, the nuclear emission is consistent with excitation from a low-accretion rate AGN, fast shocks (200 -500 km/s) in a relatively gas poor environment (n cm-3) , or coexistence of the two. The derived [SII]6717/6731 ratios are consistent with the low gas densities required by the shock models. The derived nebular metallicities suggest either an external origin of the gas, or an overestimate of the oxygen yields by SN models.
Key Words.:
Galaxies: elliptical and lenticular, cD – Galaxies: ISM – Galaxies: active–Galaxies:abundances.1 Introduction
Early-type galaxies (ETGs) have long been considered to be inert stellar systems, essentially devoid of gas and dust. However, this view has radically changed since a number of imaging and spectroscopy studies from both the ground and space have revealed the presence of a multiphase interstellar medium (ISM): a hot ( K), X-ray emitting halo (Forman & Jones fj85 (1985); Fabbiano et al. fab92 (1992); O’Sullivan et al. sul01 (2001)); a warm ( K) gas (often referred to as ”ionized gas“) (e.g. Phillips et al. ph86 (1986); Sadler & Gerhard sg85 (1985); see also Goudfrooij gou99 (1999) for a review); and colder components detected in the mid and far infrared, CO and HI (see review of Sadler et al. sad02 (2002); Temi et al. temi04 (2004); Bressan et al. bress06 (2006); Sage & Welch sw06 (2006); Morganti et al. mo06 (2006); Helmboldt hel07 (2007); Oosterloo et al. oos07 (2007); Panuzzo et al. panu07 (2007)). The hot gas component dominates the ISM in E/S0 galaxies, and only comparatively small quantities are detected in the warm and cold phases (Bregman et al. bre92 (1992)). The derived masses of the warm ISM range from to (Phillips et al. ph86 (1986); Trinchieri & di Serego Alighieri tds91 (1991); Macchetto et al. mac96 (1996); Goudfrooij et al. 1994a ; 1994b ; 1994c ; Goudfrooij & de Jong gouj95 (1995)), orders of magnitude below the X-ray emitting hot ISM and the stellar mass. Ionized gas is detected in 40-80% of early-type galaxies via its optical emission lines (Caldwell cal84 (1984); Phillips et al. ph86 (1986); Macchetto et al. mac96 (1996); Sarzi et al. sar06 (2006, 2009); Yan et al. yan06 (2006); Serra et al. serra08 (2008)). The ionized gas is also usually morphologically associated with dust (Kim kim89 (1989); Goudfrooij et al. 1994c ).
Despite the number of studies, several issues remain still open. The first question is the origin of the ISM in ETGs. Narrow band imaging centered around H[NII]6584 shows that the ionized gas presents a variety of morphologies, from regular, disk-like structures, to filamentary structures (Demoulin-Ulrich et al. du84 (1984); Buson et al. bus93 (1993); Macchetto et al. mac96 (1996); Zeilinger et al. zei96 (1996); Martel et al. mar04 (2004); Sarzi et al. sar06 (2006)). Evidence for the acquisition of external gas comes from kinematical studies showing that the angular momentum of the gas is often decoupled from that of the stars (Bertola et al. ber92 (1992); van Dokkum & Franx vdf95 (1995); Caon et al. caon00 (2000)), even if according to Sarzi et al. (sar06 (2006)) the angular momenta are inconsistent with a purely external origin for the gas. The fact that the ionized gas emission is always associated with dust (e.g. Tran et al. tr01 (2001)) tends to exclude “cooling flows” as the origin for the warm gas in E/S0 galaxies (Goudfrooij gou99 (1999)). In the scenario proposed by Sparks et al. (spa89 (1989)) and de Jong et al. (dej90 (1990)), the dusty filaments can arise from the interaction of a small gas rich galaxy with the giant elliptical, or from a tidal accretion event in which the gas and dust are stripped from a passing spiral (see e.g. Domingue et al. Domingue03 (2003); Tal et al. Tal09 (2009)).
The history of star formation and evolution leaves its chemical signature in the ISM of ETGs. Historically, X-ray abundance measurements of the hot ISM have been problematic, as typified by the so-called Fe discrepancy (Arimoto et al. ari97 (1997)). More recently, Chandra and XMM measurements of X-ray bright galaxies at the center of groups have supported roughly solar or even slightly supersolar abundances for the ISM (e.g. Gastaldello & Molendi gm02 (2002); Buote et al. buo03 (2003); Tamura et al. tamu03 (2003)), and have claimed no evidence for very subsolar Fe abundances (Humphrey & Buote hb06 (2006); Ji et al. ji09 (2009)). These studies also report anomalously low oxygen abundances compared to iron and magnesium. This is in conflict with results from SN stellar yields if one assumes that the source of ISM is the material injected into interstellar space by evolved stars. Up to now, the only study of metallicity in the warm ISM is that of Athey & Bregman (ab09 (2009)), who derived oxygen abundances for seven ETGs from optical emission lines. The authors find an average solar metallicity, favoring an internal origin of the warm ISM. However, this study is limited by the small sample. Determining the metallicity of the warm ISM is fundamental to create a link between the hot gas phase and the galaxy stellar population, and to discriminate between an internal and an external origin of the interstellar matter in E/S0 galaxies.
The second still open issue concerns the ionizing source of the warm gas. Optical spectroscopic studies show that ETGs are typically classified as LINERs (Low-Ionization Nuclear Emission-line Regions, Heckman heck80 (1980)) according to their emission line ratios (e.g. Phillips et al. ph86 (1986); Yan et al. yan06 (2006)). However, there is still strong debate about the ionization mechanism in LINERs. At present, the most viable excitation mechanisms are: a low accretion-rate AGN (e.g., Ho 1999b ; Kewley et al. kew06 (2006), Ho 2009a ), photoionization by old post-asymptotic giant branch (PAGB) stars (e.g. Trinchieri & di Serego Alighieri tds91 (1991); Binette et al. bin94 (1994); Stasińska et al. sta08 (2008)), fast shocks (Koski & Osterbrock ko76 (1976); Heckman heck80 (1980); Dopita & Sutherland dosu95 (1995); Allen et al. allen08 (2008)). The AGN mechanism is strongly supported by the detection of broad emission lines in optical spectra (e.g. Ho et al. 1997a ; Wang & Wei ww08 (2008)), by the properties of the X-ray emission (Terashima et al. tera02 (2000); Flohic et al. flo06 (2006); Gonzalez-Martin et al. go09 (2009)), by the presence of UV and X-ray variability (e.g Maoz et al. maoz05 (2005), Pian et al. pian10 (2010)), and by the evidence that massive black holes (BHs) appear to be a generic component of galaxies with a bulge (Magorrian et al. mago98 (1998); Ho 1999a ; Kormendy kor04 (2004)). PAGB stars are good candidates because their radiation, much harder than that from young stars, is able to reproduce the observed emission-line ratios in LINERs (Trinchieri & di Serego Alighieri tds91 (1991); Binette et al. bin94 (1994); Stasińska et al. sta08 (2008)). The most compelling evidence in support of the PAGB mechanism is the finding that the emission-line flux correlates very well with the host galaxy stellar luminosity within the emission-line region (Macchetto et al. mac96 (1996)), and that the emission-line flux distribution follows that of the stellar continuum (Sarzi et al. sar06 (2006, 2009)). These correlations suggest that the source of ionizing photons is distributed in the same way as the stellar population. LINERs emission has also been observed in extranuclear regions associated with large-scale outflows and related shocks (Lípari et al. li04 (2004)), or regions shocked by radio jets (Cecil et al. cec00 (2000)).
Evidence is growing that more than one mechanism may be at work in LINERs. In a recent study, Sarzi et al. (sar09 (2009)) showed that the role of AGN activity is confined to the central regions, whereas at larger radii the stellar and nebular fluxes follow each other, thus suggesting a stellar ionizing source. Eracleous et al. (era10 (2010)) showed that low accretion-rate AGNs do not produce enough ionizing photons to explain the observed H luminosities within a 2” 4” aperture, so that other mechanisms are needed.
With the aim of understanding the formation history of ETGs, and the connection between the stellar populations and the ionized gas, we have analyzed intermediate-resolution optical spectra for a sample of 65 field E/S0 galaxies (Rampazzo et al. ramp05 (2005), hereafter Paper I; Annibali et al. anni06 (2006), hereafter Paper II). The stellar population properties (i.e. ages, metallicities, and elements abundance ratios) were derived at different radii in Annibali et al. (anni07 (2007)) (hereafter Paper III) through the analysis of the Lick indices. In this paper we present the study of the optical emission lines in annuli of increasing galacto-centric distance. The purpose is to characterize the properties of the ionized gas, its origin, and the possible excitation mechanisms at different radii.
The paper is organized as it follows. In section 2 we provide a brief overview of the sample. In section 3 we describe the method used to extract the emission-line fluxes from the optical spectra. In section 4 we provide a spectral classification through standard diagnostic diagrams, and investigate possible correlations with the host galaxy properties. In section 5 we determine the oxygen metallicity. In section 6 we compare our data with the models. A summary and the conclusions are given in section 7.
| Galaxy Id | RSA | RC3 | Age | Z | [/Fe] | ||||
|---|---|---|---|---|---|---|---|---|---|
| km s-1 | arcsec | km s-1 | gal Mpc-3 | Gyr | |||||
| NGC 128 | S02(8) pec | S0 pec sp | 183 | 17.3 | 4227 | 9.7 1.7 | 0.024 0.004 | 0.16 0.03 | |
| NGC 777 | E1 | E1 | 317 | 34.4 | 5040 | 5.4 2.1 | 0.045 0.020 | 0.28 0.10 | |
| NGC 1052 | E3/S0 | E4 | 215 | 33.7 | 1475 | 0.49 | 14.5 4.2 | 0.032 0.007 | 0.34 0.05 |
| NGC 1209 | E6 | E6: | 240 | 18.5 | 2619 | 0.13 | 4.8 0.9 | 0.051 0.012 | 0.14 0.02 |
| NGC 1297 | S02/3(0) | SAB0 pec: | 115 | 28.4 | 1550 | 0.71 | 15.5 1.2 | 0.012 0.001 | 0.29 0.04 |
| NGC 1366 | E7/S01(7) | S0 sp | 120 | 10.6 | 1310 | 0.16 | 5.9 1. | 0.024 0.004 | 0.08 0.03 |
| NGC 1380 | S03(7)/Sa | SA0 | 240 | 20.3 | 1844 | 1.54 | 4.4 0.7 | 0.038 0.006 | 0.24 0.02 |
| NGC 1389 | S01(5)/SB01 | SAB(s)0-: | 139 | 15.0 | 986 | 1.50 | 4.5 0.6 | 0.032 0.005 | 0.08 0.02 |
| NGC 1407 | E0/S01(0) | E0 | 286 | 70.3 | 1766 | 0.42 | 8.8 1.5 | 0.033 0.005 | 0.32 0.03 |
| NGC 1426 | E4 | E4 | 162 | 25.0 | 1443 | 0.66 | 9.0 2.5 | 0.024 0.005 | 0.07 0.05 |
| NGC 1453 | E0 | E2 | 289 | 25.0 | 3906 | 9.4 2.1 | 0.033 0.007 | 0.22 0.03 | |
| NGC 1521 | E3 | E3 | 235 | 25.5 | 4165 | 3.2 0.4 | 0.037 0.006 | 0.09 0.02 | |
| NGC 1533 | SB02(2)/SBa | SB0- | 174 | 30.0 | 773 | 0.89 | 11.9 6.9 | 0.023 0.020 | 0.21 0.10 |
| NGC 1553 | S01/2(5)pec | SA(r)0 | 180 | 65.6 | 1280 | 0.97 | 4.8 0.7 | 0.031 0.004 | 0.10 0.02 |
| NGC 1947 | S03(0) pec | S0- pec | 142 | 32.1 | 1100 | 0.24 | 5.9 0.8 | 0.023 0.003 | 0.05 0.02 |
| NGC 2749 | E3 | E3 | 248 | 33.7 | 4180 | 10.8 2.3 | 0.027 0.006 | 0.25 0.04 | |
| NGC 2911 | S0p or S03(2) | SA(s)0: pec | 235 | 50.9 | 3131 | 5.7 2.0 | 0.034 0.019 | 0.25 0.10 | |
| NGC 2962 | RSB02/Sa | RSAB(rs)0+ | 23.3 | 2117 | 0.15 | ||||
| NGC 2974 | E4 | E4 | 220 | 24.4 | 1890 | 0.26 | 13.9 3.6 | 0.021 0.005 | 0.23 0.06 |
| NGC 3136 | E4 | E: | 230 | 36.9 | 1731 | 0.11 | 1.5 0.1 | 0.089 0.004 | 0.36 0.02 |
| NGC 3258 | E1 | E1 | 271 | 30.0 | 2778 | 0.72 | 4.5 0.8 | 0.047 0.013 | 0.21 0.03 |
| NGC 3268 | E2 | E2 | 227 | 36.1 | 2818 | 0.69 | 9.8 1.7 | 0.023 0.004 | 0.34 0.04 |
| NGC 3489 | S03/Sa | SAB(rs)+ | 129 | 20.3 | 693 | 0.39 | 1.7 0.1 | 0.034 0.004 | 0.05 0.02 |
| NGC 3557 | E3 | E3 | 265 | 30.0 | 3038 | 0.28 | 5.8 0.8 | 0.034 0.004 | 0.17 0.02 |
| NGC 3607 | S03(3) | SA(s)0: | 220 | 43.4 | 934 | 0.34 | 3.1 0.5 | 0.047 0.012 | 0.24 0.03 |
| NGC 3818 | E5 | E5 | 191 | 22.2 | 1701 | 0.20 | 8.8 1.2 | 0.024 0.003 | 0.25 0.03 |
| NGC 3962 | E1 | E1 | 225 | 35.2 | 1822 | 0.32 | 10.0 1.2 | 0.024 0.003 | 0.22 0.03 |
| NGC 4374 | E1 | E1 | 282 | 50.9 | 1060 | 3.99 | 9.8 3.4 | 0.025 0.010 | 0.24 0.08 |
| NGC 4552 | S01(0) | E | 264 | 29.3 | 322 | 2.97 | 6.0 1.4 | 0.043 0.012 | 0.21 0.03 |
| NGC 4636 | E0/S01(6) | E0-1 | 209 | 88.5 | 937 | 1.33 | 13.5 3.6 | 0.023 0.006 | 0.29 0.06 |
| NGC 4696 | (E3) | E+1 pec | 254 | 85.0 | 2958 | 0.00 | 16.0 4.5 | 0.014 0.004 | 0.30 0.10 |
| NGC 4697 | E6 | E6 | 174 | 72.0 | 1241 | 0.60 | 10.0 1.4 | 0.016 0.002 | 0.14 0.04 |
| NGC 5011 | E2 | E1-2 | 249 | 23.8 | 3104 | 0.27 | 7.2 1.9 | 0.025 0.008 | 0.25 0.06 |
| NGC 5044 | E0 | E0 | 239 | 82.3 | 2704 | 0.38 | 14.2 10. | 0.015 0.022 | 0.34 0.17 |
| NGC 5077 | S01/2(4) | E3+ | 260 | 22.8 | 2764 | 0.23 | 15.0 4.6 | 0.024 0.007 | 0.18 0.06 |
| NGC 5090 | E2 | E2 | 269 | 62.4 | 3421 | 10.0 1.7 | 0.028 0.005 | 0.26 0.04 | |
| NGC 5193 | S01(0) | E pec | 209 | 26.7 | 3711 | 6.8 1.1 | 0.018 0.002 | 0.26 0.04 | |
| NGC 5266 | S03(5) pec | SA0-: | 199 | 76.7 | 3074 | 0.35 | 7.4 1.4 | 0.019 0.003 | 0.15 0.05 |
| NGC 5328 | E4 | E1: | 303 | 22.2 | 4671 | 12.4 3.7 | 0.027 0.006 | 0.15 0.05 | |
| NGC 5363 | [S03(5)] | I0: | 199 | 36.1 | 1138 | 0.28 | 12.1 2.3 | 0.020 0.004 | 0.16 0.05 |
| NGC 5638 | E1 | E1 | 168 | 28.0 | 1676 | 0.79 | 9.1 2.3 | 0.024 0.008 | 0.24 0.05 |
| NGC 5812 | E0 | E0 | 200 | 25.5 | 1930 | 0.19 | 8.5 2.1 | 0.027 0.008 | 0.22 0.05 |
| NGC 5813 | E1 | E1-2 | 239 | 57.2 | 1972 | 0.88 | 11.7 1.6 | 0.018 0.002 | 0.26 0.04 |
| NGC 5831 | E4 | E3 | 164 | 25.5 | 1656 | 0.83 | 8.8 3.5 | 0.016 0.011 | 0.21 0.09 |
| NGC 5846 | S01(0) | E0+ | 250 | 62.7 | 1709 | 0.84 | 8.4 1.3 | 0.033 0.005 | 0.25 0.03 |
| NGC 5898 | S02/3(0) | E0 | 220 | 22.2 | 2267 | 0.23 | 7.7 1.3 | 0.030 0.004 | 0.10 0.03 |
| NGC 6721 | E1 | E+: | 262 | 21.7 | 4416 | 5.0 0.8 | 0.040 0.007 | 0.24 0.02 | |
| NGC 6758 | E2 (merger) | E+: | 242 | 20.3 | 3404 | 16.0 2.5 | 0.016 0.002 | 0.32 0.05 | |
| NGC 6776 | E1 pec | E+pec | 242 | 17.7 | 5480 | 2.7 0.5 | 0.033 0.010 | 0.21 0.05 | |
| NGC 6868 | E3/S02/3(3) | E2 | 277 | 33.7 | 2854 | 0.47 | 9.2 1.8 | 0.033 0.006 | 0.19 0.03 |
| NGC 6875 | S0/a(merger) | SAB(s)0- pec: | 11.7 | 3121 | |||||
| NGC 6876 | E3 | E3 | 230 | 43.0 | 3836 | 9.8 1.6 | 0.023 0.003 | 0.26 0.03 | |
| NGC 6958 | R?S01(3) | E+ | 223 | 19.8 | 2652 | 0.12 | 3.0 0.3 | 0.038 0.006 | 0.20 0.03 |
| NGC 7007 | S02/3/a | SA0-: | 125 | 15.4 | 2954 | 0.14 | 3.4 0.6 | 0.031 0.010 | 0.15 0.05 |
| NGC 7079 | SBa | SB(s)0 | 155 | 19.8 | 2670 | 0.19 | 6.7 1.1 | 0.016 0.003 | 0.21 0.05 |
| NGC 7097 | E4 | E5 | 224 | 18.1 | 2404 | 0.26 | 10.5 2.4 | 0.024 0.005 | 0.30 0.05 |
| NGC 7135 | S01 pec | SA0- pec | 231 | 31.4 | 2718 | 0.32 | 2.2 0.4 | 0.047 0.010 | 0.46 0.04 |
| NGC 7192 | S02(0) | E+: | 257 | 28.6 | 2904 | 0.28 | 5.7 2.0 | 0.039 0.015 | 0.09 0.05 |
| NGC 7332 | S02/3(8) | S0 pec sp | 136 | 14.7 | 1207 | 0.12 | 3.7 0.4 | 0.019 0.002 | 0.10 0.03 |
| NGC 7377 | S02/3/Sa pec | SA(s)0+ | 145 | 36.9 | 3291 | 4.8 0.6 | 0.020 0.002 | 0.10 0.03 | |
| IC 1459 | E4 | E | 311 | 34.4 | 1659 | 0.28 | 8.0 2.2 | 0.042 0.009 | 0.25 0.04 |
| IC 2006 | E1 | E | 122 | 28.6 | 1350 | 0.12 | 8.1 0.9 | 0.026 0.003 | 0.12 0.02 |
| IC 3370 | E2 pec | E2+ | 202 | 38.6 | 2934 | 0.20 | 5.6 0.9 | 0.022 0.004 | 0.17 0.04 |
| IC 4296 | E0 | E | 340 | 41.4 | 3762 | 5.2 1.0 | 0.044 0.008 | 0.25 0.02 | |
| IC 5063 | S03(3)pec/Sa | SA(s)0+: | 160 | 26.7 | 3402 |
2 Sample Overview
The Rampazzo et al. (ramp05 (2005)) + Annibali et al. (anni06 (2006)) sample (hereafter R05A06 sample) was selected from a compilation of ETGs showing ISM traces in at least one of the following bands: IRAS 100 m, X-ray, radio, HI and CO (Roberts et al. rob91 (1991)). All galaxies belong to the Revised Shapley Ames Catalog of Bright Galaxies (RSA) (Sandage & Tammann RSA (1987)) and have a redshift lower than 5500 km s-1. Because of the selection criteria, the sample is biased toward the presence of emission lines. Table 1 summarizes the main characteristics of the sample. Column (1) gives the galaxy identification name; Col. (2) and (3) provide the galaxy morphological classification according to RSA (Sandage & Tammann RSA (1987)) and RC3 (de Vaucouleurs et al. RC3 (1991)), respectively: only in few cases do the two catalogues disagree in the distinction between E and S0 classes; Col. (4) gives the central velocity dispersion from HYPERLEDA (http://leda.univ-lyon1.fr//); Col. (5) gives the effective radius from RC3; Col. (6) gives the galaxy systemic velocity, Vhel, which is lower than 5000 km s-1; Col. (7) provides the richness parameter (Tully Tu88 (1988)): it represents the density of galaxies brighter than -16 apparent B-mag in the vicinity of the entry, in galaxies Mpc-3. Cols (8), (9) and (10) list the age, metallicity and [/Fe] ratios derived in Paper III.
The galaxies of the R05A06 sample are mainly located in low density environments. The local density of the galaxies varies from 0.1 Mpc-3, typical of very isolated galaxies, to 4 Mpc-3, characteristic of denser regions in the Virgo cluster. For comparison, in the Tully (Tu88 (1988)) catalogue objects like NGC 1399 and NGC 1389, members of the Fornax cluster, have =1.59 and 1.50 Mpc-3, respectively. Thus, the R05A06 sample, even though biased towards low density environments, contains a fraction of galaxies in relatively dense environments. The sample spans a wide range in central velocity dispersion, from 115 to 340 km s-1 (see Papers I and II for details).
Following the RC3 classification, the sample is composed of 70% ellipticals and 30% lenticulars. However, if we classify the galaxies according to their amount of rotation (see Appendix A), we end up with 70% fast rotators (F) and 30% slow rotators (S).
Intermediate resolution (FWHM 7.6 Å at 5550 Å) spectra in the (3700 - 7250) Å wavelength range were acquired with the 1.5 m ESO-La Silla telescope for the 65 galaxies of the sample. The spectra were extracted for 7 apertures of increasing radius (1.5″, 2.5″, 10″, re/10, re/8, re/4, and re/2), corrected for the galaxy ellipticity, and 4 adjacent annulii (r re/16, re/16 r re/8, re/8 r re/4, and re/4 r re/2). The data reduction and the computation of the Lick indices are described in Papers I and II. In Paper III we derived ages, metallicities, and [/Fe] ratios by comparing the data with our new Simple Stellar Population (SSP) models. No stellar population parameters are derived for IC 5063, since line emission is too strong to allow a measurement of the Lick indices. Summarizing the results of Paper III, we derive a large age spread, with SSP-equivalent ages ranging from a few Gyrs to a Hubble time. The galaxies have metallicities and [/Fe] ratios above solar. Both the total metallicity and the [/Fe] present a positive correlation with the central velocity dispersion, indicating that the chemical enrichment was more efficient and the duration of the star formation shorter in more massive galaxies. We also find that the youngest objects in our sample are all located in the lowest density environments ( Mpc-3). We suggest that the young galaxies in the lowest density environments underwent secondary episodes of star formation, which we call “rejuvenation episodes”. Within the individual galaxies, the stellar metallicity tends to decrease from the center outwards. We derive an average metallicity gradient of .
3 Emission lines
3.1 Starlight Subtraction and Line Intensities
There are a number of emission lines that we expect to detect within the wavelength range (3700 - 7250) Å sampled by our spectra: [OII] 3727, [NeIII] 3869, H 4861, [OIII] 4959, 5007, [OI] 6300, H 6563, [NII] 6548, 6584, [SII] 6717, 6731.
The emission line fluxes were measured in residual spectra obtained after subtracting the stellar population contribution from the observed galaxy spectra. The starlight subtraction is a crucial step for the correct determination of the emission line properties, in particular for H and H, which are superimposed to the Balmer absorption features of the underlying stellar population. The H emission, much fainter than the H ( 1/3 in absence of extinction), is the most difficult to measure. With only few exceptions, we never see in our spectra a true emission feature in H, but rather an infilling of the stellar absorption line. It follows that a reliable measurement of this line rests on the appropriate modeling of the underlying starlight contribution.
To subtract the underlying stellar population from the galaxy spectra we used new SSPs (Bressan, unpublished, see also Clemens et al. Clemens09 (2009), Chavez et al. Chavez09 (2009)). The SSPs were computed from the isochrones of Padova 94 (Bertelli et al. Bertelli94 (1994)) with the revision of Bressan, Granato & Silva (Bressan98 (1998)), including a new AGB mass-loss treatment calibrated on LMC cluster colors. These SSPs are particularly suited for our analysis because they make use of the MILES spectral library (Sánchez-Blázquez et al. sanb06 (2006)). MILES consists of 2.3 Å FWHM optical spectra of 1000 stars spanning a large range in atmospheric parameters, and represents a substantial improvement over previous libraries used in population synthesis models.
For our study, we considered the galaxy spectra extracted in 4 concentric annulii (r re/16, re/16 r re/8, re/8 r re/4, and re/4 r re/2), as described in Section 2. The galaxy continua were fitted with the new SSPs, previously smoothed to match the instrumental resolution and the galaxy velocity dispersion, through a criterion. In the fit, we considered selected spectral regions chosen to be particularly sensitive either to age or to metallicity. For each SSP of given age and metallicity, and ranging from the Galactic foreground value to , the is:
| (1) |
where is the number of selected spectral regions, is the number of points in the -th region, is the observed galaxy flux at a given wavelength, is the SSP flux normalized to the observed flux in the -th region, is the error on the observed flux. The spectral regions have widths between Å and Å. The normalization constant is computed in a Å wide region adjacent to the -th band. This approach guarantees that the solution is mostly driven by the strengths of the absorption features, rather than by the global slope of the observed galaxy spectrum. This minimizes the effect of extinction and of the uncertainties due to flux calibration on the solution. The spectral regions were selected in order to include both features particularly sensitive to age (the relative strength of the Ca II H + K lines, the 4000 Å break () , the H and H lines), and features more sensitive to metallicity (the Fe lines at 4383, 4531, 5270, 5335, and the Mg absorption features around 5175). The region around H, where emission is expected, was obviously excluded from the fit. On the other hand, negligible emission is expected in the higher-order Balmer lines (H, H and H, blended with the CaII H line at our resolution). The residual spectrum around each line is derived by normalizing the SSP in two continuum bands adjacent to the line of interest.
Because of the degeneracy between age, metallicity, and extinction, fits with similarly good values can produce significantly different residual spectra, in particular around H. Thus, to obtain a statistically meaningful determination of the emission lines, we considered all the N fits with , and computed the emission lines on the corresponding residual spectra.
For each line, we adopted the average emission flux computed as:
| (2) |
where is line flux obtained by subtracting the SSP of metallicity Z, age t, and reddening to the observed galaxy spectrum, and is its weight. The line flux is determined by fitting the residual spectrum with Gaussian curves of variable width and intensity. The emission line width is treated as a free parameter because the velocity dispersion of the gas can be significantly different from that of the stars. More specifically, single Gaussians were used to fit all the lines, with the exceptions of [SII]6717, 31, which was fitted with a sum of 2 Gaussians, and the [NII] H complex, which was fitted with a sum of 3 Gaussians. The [OII]3727 feature is actually a doublet (), but the two lines appear completely blended in our spectra.
The error on the average emission flux is:
| (3) |
This error takes into account the uncertainty due to the intrinsic degeneracy of the stellar populations. Because of the high signal-to-noise of our spectra, this is actually the largest source of error in the measure of the emission fluxes.
The use of a single SSP in the fitting procedure may lead to spurious effects where recent star formation is present in some amounts. We showed in Paper III that some galaxies in our sample have very young luminosity weighted ages (4 Gyr), possibly as a consequence of “rejuvenation” episodes. Therefore, we repeated the fitting procedure using, instead of one SSP, a combination of a young (t 8 Gyr) and an old (t 8 Gyr) SSP. This approach guarantees a more reliable spectral subtraction under the Balmer lines for the “rejuvenated” galaxies. The two-SSP fitting procedure results in some differences for the galaxies with faint H emission. This may be important when discriminating between LINERs and Seyfert through the [OIII]/H ratio (see Section 4). On the other hand, we checked that there are no significant differences in the resulting emission lines for galaxies randomly selected among those without signs of recent star formation.
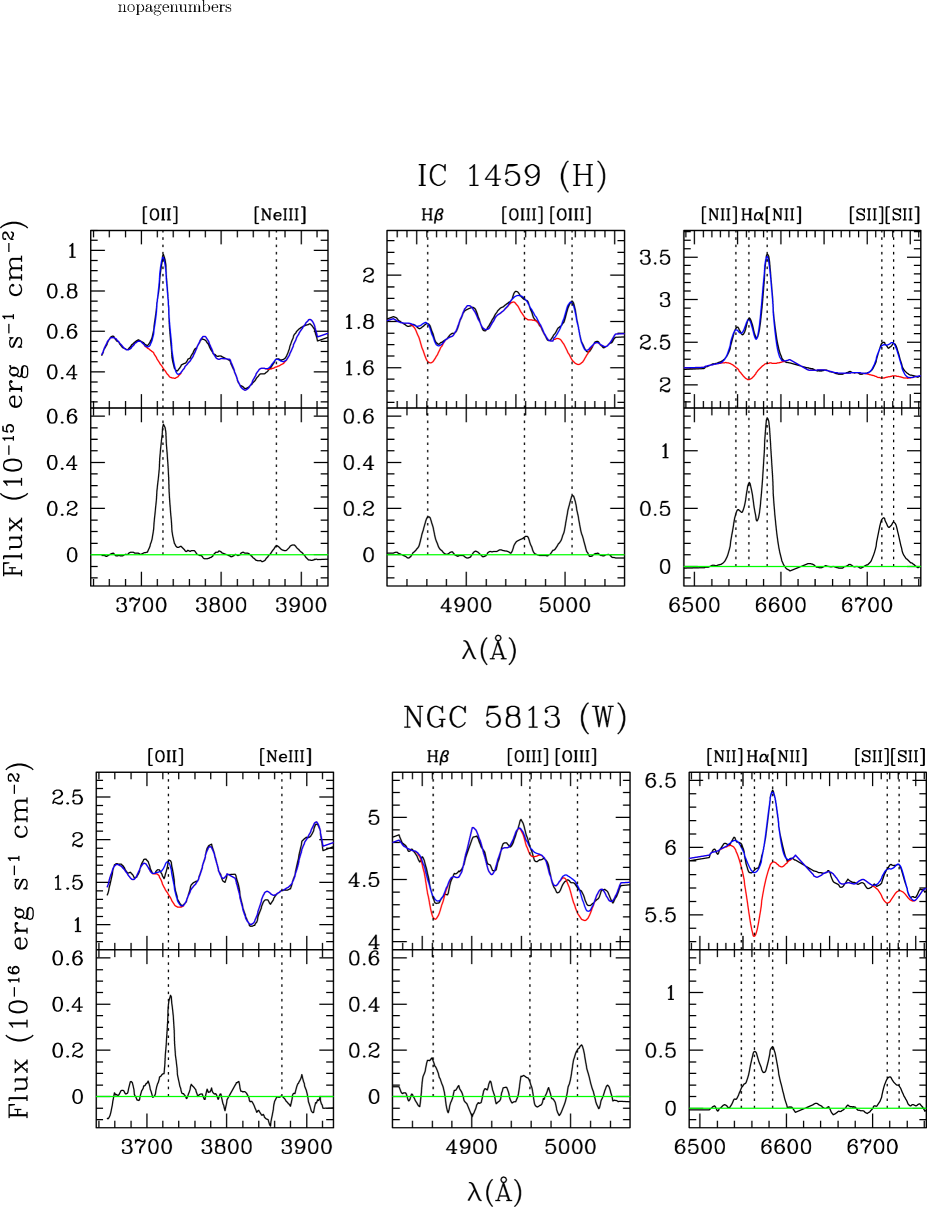
In Fig. 1 we show the stellar continuum subtraction procedure for two illustrative examples: IC 1459, with relatively strong emission lines, and NGC 5813, with weak emission lines. Notice that in the figure the subtracted stellar continuum is an SSP of age, metallicity, and extinction equal to the average of all the N solution with . This is slightly different from our procedure, where we have subtracted the individual solutions N times from the same galaxy spectrum, and have computed the final emissions as average of the N emission fluxes. In Fig. 1, the emission features are easily visible in IC 1459. The errors on the emission line fluxes introduced by the uncertainties in the stellar continuum subtraction are thus relatively small. In the case of NGC 5813, instead, the determination of the emissions is dominated by starlight subtraction effects, in particular for H and H. Consequently the errors on the emission lines are quite large.
We provide in Table 2 the emission line fluxes in units of erg s-1 cm-2 arcsec-2 derived for the R05A06 sample in 4 annuli of increasing galacto-centric distance (r re/16, re/16 r re/8, re/8 r re/4, and re/4 r re/2). In Table 3 we provide the line equivalent widths (EW), derived as , where is the flux computed in a continuum band adjacent to the line of interest. The high errors in H are due to its intrinsic faintness, accompanied by a strong dependence of the H absorption line on age. The values given in Tables 2 and 3 are not corrected for reddening. The extinction corrected emissions can be easily derived from the values given in Col. 3 of Table 2, and computed as described in the next paragraph.
3.2 Extinction
The extinction in the lines was derived through the relative observed strengths of the Balmer lines. The intrinsic flux ratio is 2.85 for HII regions and 3.1 for AGN-like objects (Osterbrock Osterbrock89 (1989)). Values larger than these are due to absorption from an intervening medium.
More specifically, given an observed ratio, the reddening is computed as:
| (4) |
where is the magnitude attenuation at a given wavelength, and , , and , depend on the adopted extinction curve. We adopted the Cardelli et al. (1989) extinction law, where . We also assumed , since all the galaxies in the R05A06 sample display AGN - like emission-line ratios (see Section 4). The assumption of does not change significantly our results.
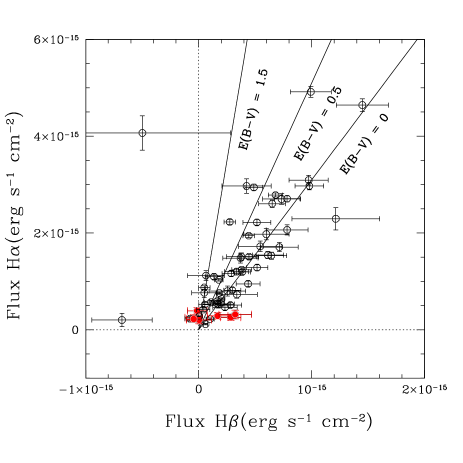
In Figure 2, we plot the H versus H fluxes derived in a central r re/16 region. The majority of the galaxies have . Some galaxies display instead very strong extinction, as high as or even more. They have very faint H intensities, accompanied by relatively strong H emissions. Vice versa, a few objects fall below the line, in the region of “negative reddening”. In these cases, the emission derived in H is incompatible (too large) with the derived H. An obvious explanation is that the underlying continuum was not subtracted properly. More specifically, the fact that we underestimate the H/H ratio suggests that we have subtracted populations that are systematically too young or too metal poor. To verify this hypothesis, we simulated the situation in which a too-young population is subtracted from the galaxy spectrum in the following way. We created a synthetic spectrum by adding H and H emission lines (in the ratio ) to an old SSP. Then we re-derived the emission intensities by subtracting from the synthetic spectrum increasingly younger SSPs. We obtained that the ratio decreases as the age increases. The effect is as much stronger as the initial emission intensities are weaker. It is due to a combination of the stronger dependence of the H absorption line on age, and of the intrinsic faintness of the H emission line with respect to H.
Finally, there are some galaxies whose H and H emissions are both consistent with zero within a 3 error (NGC 1366, NGC 1389, NGC 1407, NGC 1426, NGC 5638, NGC 5812, and NGC 5831). These galaxies show no emission in the other lines as well, and are classified as no emission (N) galaxies.
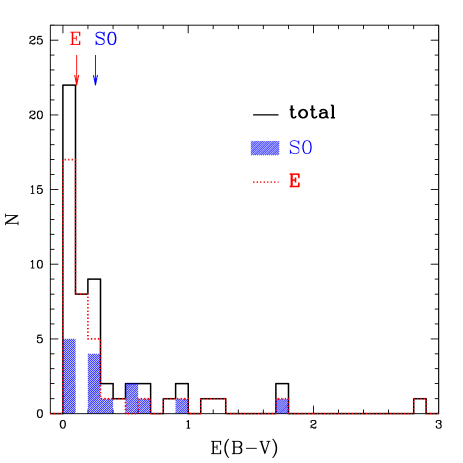
The derived values at different galacto-centric distances are given in Col. 3 of Table 2. For the galaxies with “negative reddening”, and for the galaxies with lower than the Galaxy foreground extinction, the was set to the foreground value. Very large values are derived for NGC 777, NGC 1521, NGC 3136, NGC 3557, NGC 6776, NGC 7007, NGC 3489. Such strong extinction values, not observed in the continuum, suggest that the distribution of the dust is patchy. Notice however that the errors in the derived values are quite large, due to the high uncertainty in the H emission. The reddening distributions for the E and S0 classes are shown in Fig. 3. The median values for the two classes are 0.11 and 0.26 respectively. However, a Mann-Withney U test shows that there is not a significant difference between the two distributions.
Once computed the values, we corrected the observed emission fluxes:
| (5) |
where
| (6) |
is taken from the extinction curve, and is the wavelength of the line of interest.
3.3 Results
The galaxies are classified in Table 4 according to the intensity of their nuclear emission lines. We identify three categories: no emission galaxies (N), where no emission lines are detected within a 3 error; weak emission line galaxies (W), with EW(H [NII]6584)3 Å; and strong emission line galaxies (H), with EW(H [NII]6584)3 Å.
Emission lines are detected in 58 out of 65 galaxies ( 89% of the sample), while strong emission is present in 57% of the sample. In the central r re/16 region, we derive median EWs of 0.51, 0.72, 1.4 and 1.8 for H, [OIII], H, and [NII] 6584, respectively. For the same lines, the median percentage errors amount to 31%, 11% , 6% , and , 1%.
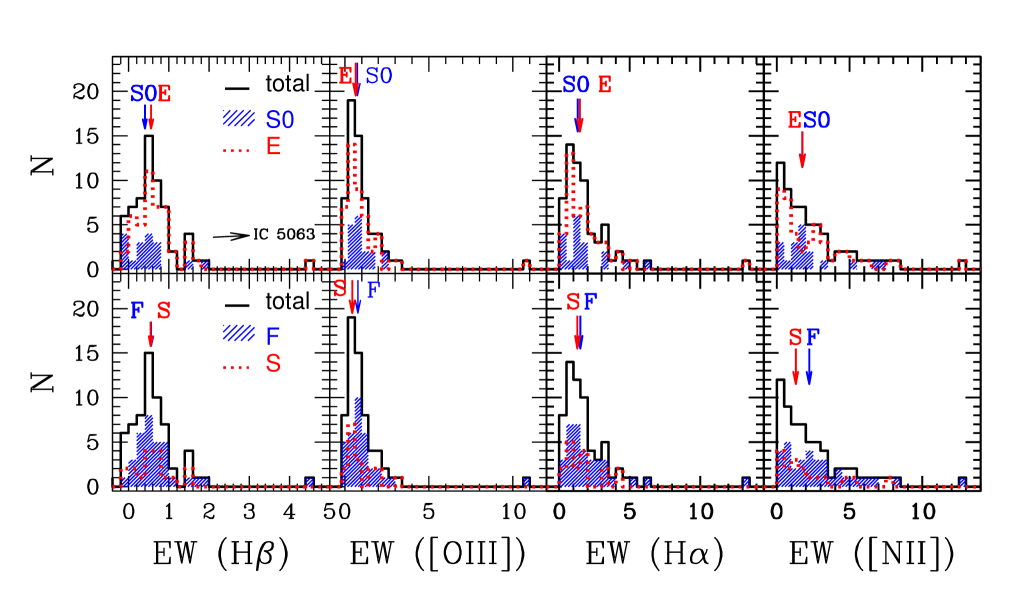
We investigated possible differences in the emission intensity between the E and S0 subsamples, and between the fast (F) and slow (S) rotators subsamples. The distributions and the relative median values are shown in Fig 4. An appreciable difference is observed only between F and S for the median [NII] value. However, Mann-Whitney U tests provide P 0.05 (for a two-tailed test) for all the distributions, indicating that there is no significant difference between the E, S0, F and S subsamples.
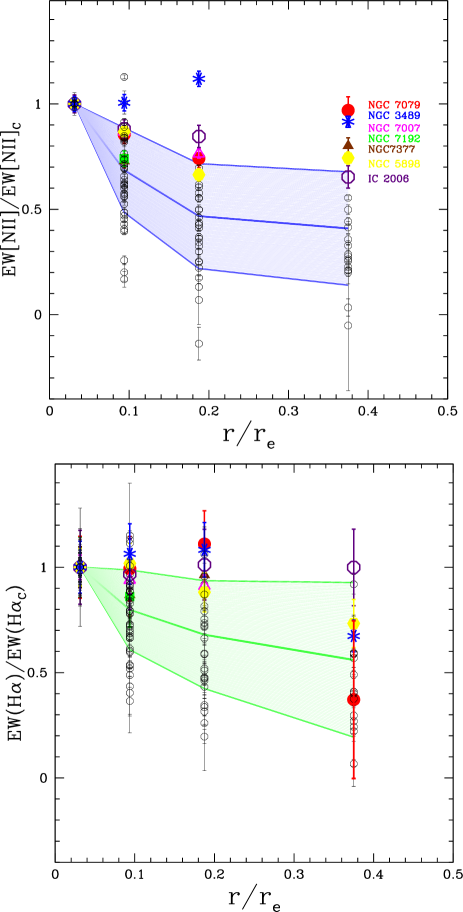
To quantify the importance of the emission with respect to the underlying stellar continuum at increasing galacto-centric distance, we studied the behavior of the [NII] and of the H lines in the 4 annuli defined in Section 2. Notice that the use of adjacent annuli instead of “apertures” allows us to isolate the true emission contribution from different regions within the galaxy. The [NII] line is relatively stronger, and thus more easily measured also in the external annuli. Furthermore, it is also very poorly affected by uncertainties in the underlying stellar population subtraction, and it has the lowest percentage error. On the other hand the H presents the advantage that, being a recombination line, directly reflects the ionizing photon flux, but its measure is much more affected than the [NII] by uncertainties in the underlying population subtraction. The behaviors of the observed [NII]/([NII]re/16) and H/(Hre/16) ratios with increasing galacto-centric distances are shown in Fig. 5. Negative values are consistent with no emission. The plotted values were not corrected for reddening, but extinction could affect the EWs if the nebular emission was more reddened than the continuum. Indeed, Tran et al. (tr01 (2001)) showed that the presence of emission lines in ETGs tends to be associated with the presence of clumpy dust.
Fig. 5 shows that, with some exceptions (NGC 3489, NGC 5898, NGC 7007, NGC 7079, NGC 7192, NGC 7377), the emission EWs tend to decrease from the center outwards. The average decrease in the [NII] EW is 0.7, 0.5, and 0.4 of the central value at 0.1 re, 0.2 re, and 0.4 re, while the H EW decreases more gently ( 0.8, 0.7, and 0.6 at the same radii). The steeper decrease of the [NII] compared to the H indicates a progressive softening of the ionizing spectrum from the galaxy center to more external regions. The decrease in the H EW implies that the ionizing flux decrease more rapidly than the stellar continuum around 6500 Å. However, given the uncertainties, we can consider significant only the decrease from the center to 0.1 re. Deeper observations are needed to trace with higher confidence the EW behavior out to larger radii.
The galaxies NGC 7079, NGC 3489, NGC 7007, NGC 7192, NGC 7377, NGC 5898 deviate from the average decreasing trend, presenting flat or increasing emission EWs (although the H of NGC 3489, NGC 5898 and NGC 7079 drops in the most external annulus). NGC 3489 and NGC 7007 have large reddenings, thus their increasing trend could be due to stronger extinction toward the galaxy center. Unfortunately, the errors in the derived values are large, and it is difficult to establish from our data if indeed the reddening decreases with galacto-centric distance. On the other hand, the other galaxies (NGC 7079, NGC 7192, NGC 7377, and NGC 5898) show very little or almost null extinction, thus the observed trends are likely to be intrinsic.
4 Spectral classification
4.1 Diagnostic Diagrams
| Galaxy Id | Emission Type111Nno emission; Wweak emission (3 Å); Hhigh emission (3 Å) | Activity Class222At larger radii, some LINERs are classified as Composites. |
|---|---|---|
| NGC 128 | H | LINER |
| NGC 777 | W | Sy/ LINER |
| NGC 1052 | H | LINER |
| NGC 1209 | H | LINER |
| NGC 1297 | H | LINER |
| NGC 1366 | N | |
| NGC 1380 | H | LINER |
| NGC 1389 | N | |
| NGC 1407 | N | |
| NGC 1426 | N | |
| NGC 1453 | H | LINER |
| NGC 1521 | W | LINER |
| NGC 1533 | H | LINER |
| NGC 1553 | W | LINER |
| NGC 1947 | H | LINER |
| NGC 2749 | H | LINER |
| NGC 2911 | H | LINER |
| NGC 2962 | H | |
| NGC 2974 | H | LINER |
| NGC 3136 | H | LINER/ Sy |
| NGC 3258 | H | Comp |
| NGC 3268 | H | LINER |
| NGC 3489 | H | Sy/ LINER |
| NGC 3557 | W | LINER |
| NGC 3607 | H | LINER |
| NGC 3818 | Traces | |
| NGC 3962 | H | LINER |
| NGC 4374 | H | LINER |
| NGC 4552 | W | Comp |
| NGC 4636 | H | LINER |
| NGC 4696 | H | LINER |
| NGC 4697 | W | LINER |
| NGC 5011 | W | LINER |
| NGC 5044 | H | LINER |
| NGC 5077 | H | LINER |
| NGC 5090 | H | LINER |
| NGC 5193 | W | Comp |
| NGC 5266 | H | LINER |
| NGC 5328 | W/Traces | Comp |
| NGC 5363 | H | LINER |
| NGC 5638 | N | |
| NGC 5812 | N | |
| NGC 5813 | W | LINER |
| NGC 5831 | N | |
| NGC 5846 | H | LINER |
| NGC 5898 | W | LINER |
| NGC 6721 | W/Traces | Comp |
| NGC 6758 | H | LINER |
| NGC 6776 | H | LINER/ Sy |
| NGC 6868 | H | LINER |
| NGC 6875 | W | |
| NGC 6876 | W /Traces | Comp |
| NGC 6958 | H | Sy/ LINER |
| NGC 7007 | W | Sy/ LINER |
| NGC 7079 | W | LINER |
| NGC 7097 | H | LINER |
| NGC 7135 | H | LINER |
| NGC 7192 | W | LINER |
| NGC 7332 | W/Traces | |
| NGC 7377 | W | LINER |
| IC 1459 | H | LINER |
| IC 2006 | W | Comp |
| IC 3370 | H | LINER |
| IC 4296 | H | LINER |
| IC 5063 | H | Sy |
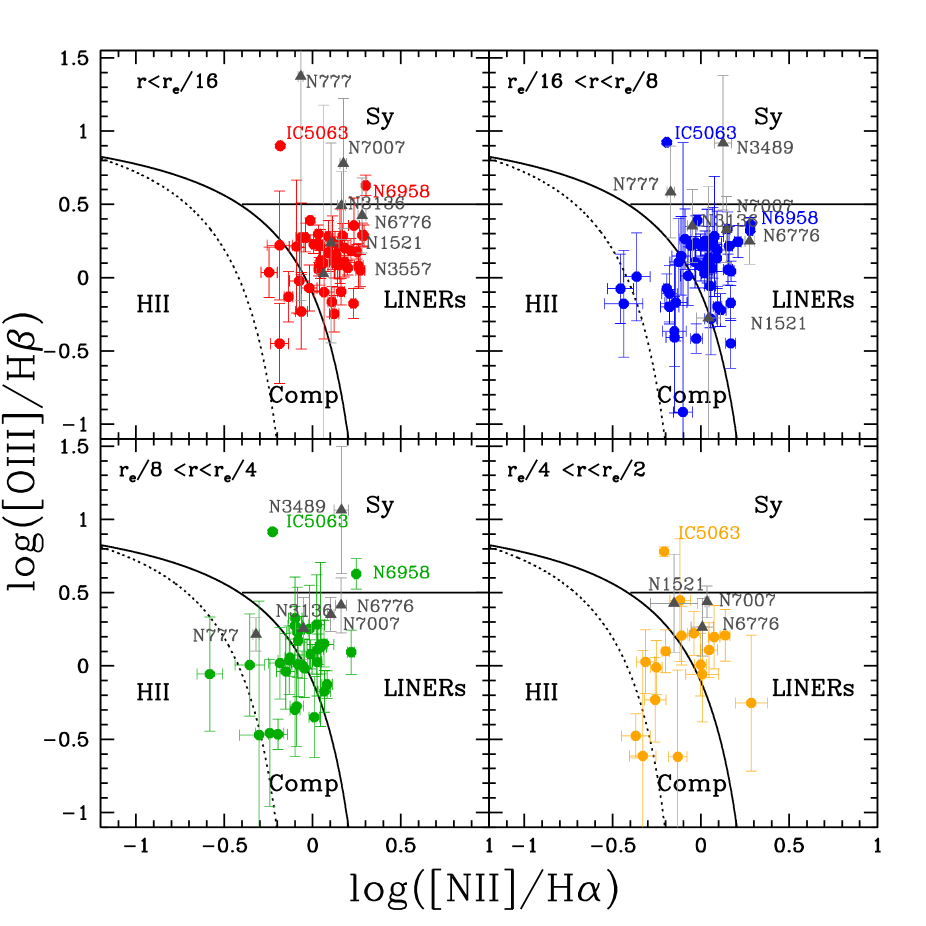
Galaxies were classified through the standard [OIII]5007/ H versus [NII]6584/ H diagnostic diagram (Baldwin, Phillips and Terlevich (Baldwin81 (1981); hereafter BPT). Using a combination of stellar population synthesis models and photoionization models, Kewley et al. (Kewley01 (2001)) identified a “maximum starburst line” in the BPT diagram. Galaxies lying above this line are likely to be dominated by an AGN. Kauffmann et al. (Kauff03 (2003)) later revised the Kewley et al. (Kewley01 (2001)) classification scheme introducing an empirical line to divide pure star-forming galaxies from AGN-HII Composite objects (also called “Transition objects”), with significant contribution from both AGN and star formation (see also Stasińska et al. sta06 (2006)). The optical spectra of composite objects can be due to either 1) a combination of star formation and a Seyfert nucleus, or 2) a combination of star formation and LINERs emission (Kewley et al. kew06 (2006)).
From the distribution in the BPT diagram of the galaxies from the Sloan Digital Sky Survey, Kewley et al. (kew06 (2006)) introduced an empirical horizontal line to separate “Seyfert” and LINERs. Even though LINERs show [NII]/ H ratios larger than the star-forming galaxies, indicating a harder ionization continuum, it is still under debate if they are powered by active galactic nuclei or not (see Section 1).
The BPT diagram for the R05A06 sample is shown in Fig. 6. The [NII]6584/ H line ratio was preferred to the [SII](6717 6731)/ H and [OI]6300/ H ratios because of the larger signal to noise of the [NII] line in our spectra. Emission line ratios were corrected for extinction adopting the values derived in Section 3.2 and reported in Col. 3 of Table 2, even though the BPT diagram is almost insensitive to reddening. The galaxies with negative reddening, or reddening lower than the foreground value, where corrected adopting the galactic foreground reddening from NED .
According to their nuclear () emission, the majority of our galaxies are classified as LINERs. A few galaxies (NGC 3258, NGC 4552, NGC 5193, NGC 5328, NGC 6721, NGC 6876, IC 2006) fall in the region of “Composites”, and possibly contain a combined contribution from both star formation and AGN. IC 5063, NGC 777, NGC 3489, NGC 7007, and NGC 6958, fall in the Seyfert region. Among them, only IC 5063 can be classified as a bona fide Seyfert galaxy. The others all have very high uncertainties in the [OIII]/ H ratios, due to the low H emission (nuclear EW0.3 Å), and are consistent with a LINERs classification within the errors. These galaxies also display very large reddenings (). Vice versa, NGC 3136 and NGC 6776 are LINERs, but are consistent with being Seyferts within the errors. Among the Seyferts, a spectral classification is present in the literature only for NGC 3489 (Ho et al. 1997b , Sarzi et al. sar06 (2006)), NGC 777 (Ho et al. 1997b ), and NGC 6958 (Saraiva et al. 2001). These studies classify the first two galaxies as Seyferts, and the last one as LINER.
The final spectral classification obtained from the nuclear (r re/16) lines is given in Col. 3 of Table 4.

4.2 Gradients
We investigated how the distribution of the galaxies in the BPT diagram changes at annuli of increasing galacto centric distance (r re/16, re/16 r re/8, re/8 r re/4, and re/4 r re/2). This emerges by comparing the four panels of Fig. 6. Only a few galaxies have sufficiently high S/N ratios that allows to measure the emission line ratios in the most external annuli.
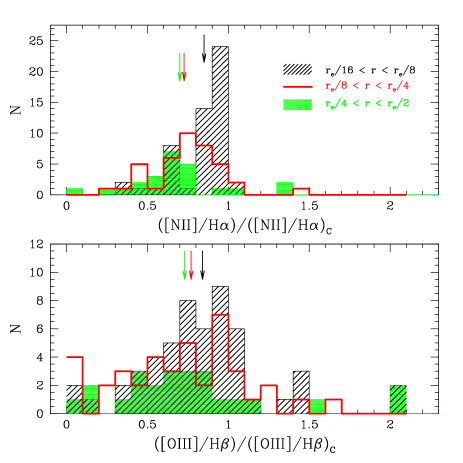
The clear result is that, from the center outwards, the bulk of the galaxies moves left-down in the BPT diagram. An increasing number of galaxies pass from LINERs to “Composite” objects as the emission lines are measured at larger galacto-centric distances. Likely, this effect would not have been observed by considering apertures instead of annuli, since the central emission is almost always dominating. The effect is better quantified in Fig. 7, where we plot the distribution of the [NII]/H and [OIII]/H ratios over the central r re/16 values (C) for the different annuli. The peak of the ([NII]/H)/([NII]/H)C distribution moves from 1 to values at larger radii. The average ([NII]/H)/([NII]/H)C values are 0.85, 0.73, and 0.69 at re/16 r re/8, re/8 r re/4, and re/4 r re/2, respectively. These correspond to horizontal shifts of , , and dex in the BPT diagram. However, given the large errors in the emission line measures in the most external annulus, we consider this result significant only out to r re/4. The ([OIII]/H)/([OIII]/H)C distribution is less peaked, in part also because of the large errors in the derived [OIII]/H ratios. The average values are 0.92, 0.77, and 0.64. for the three annuli, corresponding to vertical shifts of , , and dex in the BPT diagram. However, given the intrinsic faintness and large errors of the [OIII] and H lines compared to [NII] and H, none of our conclusions will be based on the spatial behavior of the [OIII]/H ratio.
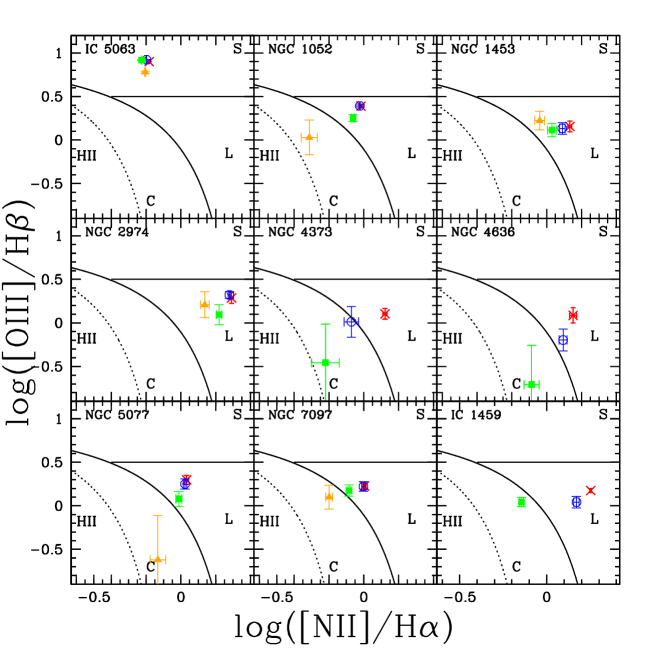
When the galaxies are inspected individually, we see that for the majority of them the [NII]/H ratio decreases monotonically with galacto-centric distance. The only exceptions are: IC 5063, NGC 1521, NGC 3136, NGC 3489, NGC 5813, NGC 5898, NGC 6721, NGC 6876, NGC 7135 and NGC 7192. In all these galaxies the [NII]/H ratio does not have a clear trend. In NGC 3489, the ratio increases from the center outwards. The [NII]/H ratio decreases very steeply in IC 1459, IC 4296, NGC 3607, NGC 4374, NGC 4697, NGC 5090, and NGC 5266. We show in Fig. 8 the individual BPT diagrams in different annuli for some galaxies of the sample. The [NII]/H and [OIII]/H ratios in the four annuli for the whole sample are shown in Appendix B.
Summarizing, the hardness of the ionizing continuum decreases with galacto-centric distance.
4.3 Central correlations with galaxy properties
We investigated possible correlations between the emission line properties and the galaxy properties. Our results are summarized in Fig. 9.
In the top panels of Fig. 9 we plotted the central () H and [NII]6584 equivalent widths versus the central velocity dispersion , the age, the metallicity, and the /Fe enhancement. The H and [NII] EWs quantify the strength of the emission with respect to the stellar continuum. However, the [NII] line is much less affected than the H by uncertainties or systematics due to the stellar continuum subtraction. The scatter in the H and and [NII] EW increases with . This still holds if the [OIII] emission is considered. If we exclude the Seyfert galaxy IC 5063, strong emission is observed only for galaxies with 200 km s-1. The galaxies with the strongest emissions tend to be fast rotators. Also, all the low galaxies are fast rotators. Concerning the stellar population parameters, the trend is preserved only for the [NII] line versus the [/Fe] ratio (it is barely present in the H vs [/Fe] plane). We notice that this trend could be driven by the contamination from the [NI]5199 line to the Mgb index, implying larger derived [/Fe] values for galaxies with stronger emission (Goudfrooij & Emsellem goem96 (1996)). The lack of a trend between the EW and metallicity is a bit surprising at the light of the well know metallicity- relation for ETGs.
In the third row panels of Fig. 9 we show the central () [NII]5684/H ratio, which is a measure of the hardness of the ionizing spectrum. In examining possible correlations between this emission line ratio and the galaxy properties, we separated the sample in high emission galaxies (H) and weak emission ones (W) (see Section 3.3 and classification in Table 4). In fact, the determination of the H emission can be strongly affected by systematics in the underlying continuum subtraction in the W galaxies. To investigate the presence of correlations it is thus safer to consider only the H subsample. The first panel in the third row shows that there is a positive correlation between the central [NII]/H and . The Spearman correlation coefficient is 0.31 (with 36 data points), implying that there is a 6% probability that the variables are not correlated for a two-tailed test. However, if we restrict the analysis to the galaxies with EW([NII]), the probability that there is no correlation drops to 4%. This result is in agreement with Phillips et al.( ph86 (1986)), who derived a positive trend between the [NII]/ H ratio and the galaxy absolute magnitude. On the other hand, Spearman tests show that there is no strong correlation between [NII]/ H and the age, the metallicity, or the /Fe enhancement of the galaxy stellar population.
In the forth row panels of Fig. 9 we show the central [OIII]/H ratio, which is related to the ionization parameter. No clear trend is observed with , age, metallicity, and [/Fe]. We only notice that the largest [OIII]/H values are associated to the youngest galaxy ages.
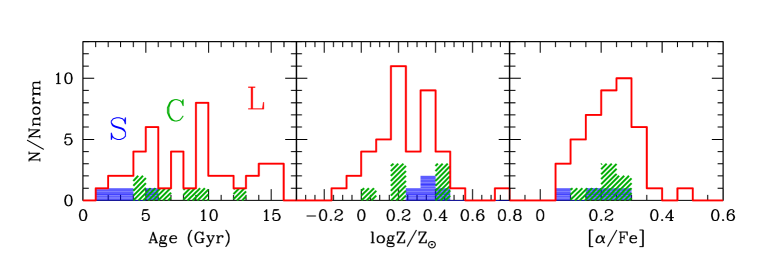
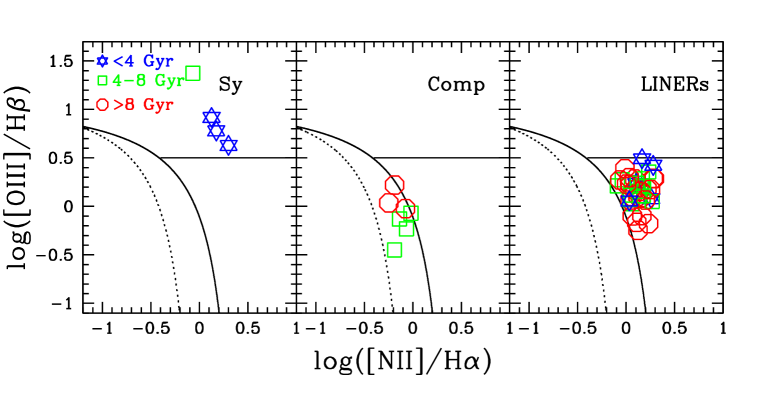
The relation between the nuclear emission spectral class (Seyfert, LINERs, composite), and the stellar population properties is show in Figs. 10 and 11. Seyfert galaxies tend to have ages younger than 4 Gyr. “Composite” galaxies have ages older than 5 Gyr. LINERs cover the whole age range from a few Gyrs to a Hubble time. For the three classes, the average ages are 3.8, 7.5, and 9 Gyr, respectively. The average metallicities are 0.39, 0.29, and 0.22, respectively. No significant difference is observed in the [/Fe] ratio.
It emerges that Seyferts tend to have luminosity-weighted ages significantly younger than LINERs, likely because of recent star formation episodes. The only caveat in this statement is that the only bona fide Seyfert in our sample (IC 5063), does not have an age determination.
5 Oxygen abundance
If the ionizing source is known, one can derive the element abundance of the warm gas. In their nuclear () region, the majority of the galaxies in our sample are classified as LINERs, a few are classified as “Composites”, and only IC 5063 is classified as a bona fide Seyfert galaxy. We have also noticed a progressive increase of the fraction of “Composites” with respect to pure LINERs moving from the galaxy center to more external regions. As discussed in Section 1, the ionizing mechanism in LINERs/Composites is still far from being understood. For this reason, we derived the oxygen metallicity for the R05A06 sample in the two extreme assumptions of 1) photoionization by hot stars, and 2) AGN excitation. A calibration in the case of shock heating is not present in the literature.


| Galaxy | [SII]6717/6731 | (cm-3) |
|---|---|---|
| NGC 1052 | 1.11 0.03 | 384.1 |
| NGC 1209 | 1.19 0.13 | 254.8 |
| NGC 1297 | 1.08 0.10 | 423.6 |
| NGC 1380 | 0.98 0.15 | 653.9 |
| NGC 1453 | 1.28 0.09 | 141.5 |
| NGC 1533 | 1.22 0.16 | 212.0 |
| NGC 1553 | 1.21 0.30 | 229.3 |
| NGC 1947 | 1.32 0.04 | 95.0 |
| NGC 2749 | 1.18 0.08 | 267.7 |
| NGC 2974 | 1.10 0.05 | 385.1 |
| NGC 3136 | 1.60 0.11 | 26 |
| NGC 3268 | 1.32 0.13 | 103.4 |
| NGC 3489 | 1.21 0.14 | 223.1 |
| NGC 3607 | 1.24 0.20 | 185.4 |
| NGC 3962 | 1.27 0.06 | 147.1 |
| NGC 4374 | 1.45 0.17 | 26 |
| NGC 4636 | 1.45 0.15 | 26 |
| NGC 4696 | 1.31 0.08 | 110.0 |
| NGC 5044 | 1.51 0.06 | 26 |
| NGC 5077 | 1.26 0.06 | 158.7 |
| NGC 5090 | 1.48 0.20 | 26 |
| NGC 5193 | 1.57 0.50 | 26 |
| NGC 5266 | 1.06 0.04 | 476.7 |
| NGC 5363 | 1.27 0.05 | 148.8 |
| NGC 5813 | 1.34 0.22 | 83.4 |
| NGC 5846 | 1.10 0.21 | 395.6 |
| NGC 5898 | 1.55 0.34 | 26 |
| NGC 6758 | 1.42 0.17 | 26 |
| NGC 6868 | 1.43 0.08 | 26 |
| NGC 6958 | 0.77 0.03 | 1605.9 |
| NGC 7007 | 1.53 0.15 | 26 |
| NGC 7079 | 0.95 0.21 | 732.3 |
| NGC 7097 | 1.23 0.06 | 200.4 |
| NGC 7377 | 1.43 0.14 | 26 |
| IC 1459 | 0.97 0.04 | 674.2 |
| IC 3370 | 1.48 0.05 | 26 |
| IC 4296 | 1.10 0.15 | 400.7 |
| IC5063 | 1.08 0.01 | 433.3 |
| Galaxy | (Kob99) | (SB98) |
|---|---|---|
| NGC 128 | 8.44 0.24 | |
| NGC 1052 | 8.52 0.15 | 8.67 0.03 |
| NGC 1209 | 8.63 0.19 | 8.78 0.04 |
| NGC 1297 | 8.59 0.04 | |
| NGC 1380 | 8.81 0.20 | 8.75 0.04 |
| NGC 1453 | 8.55 0.19 | 8.76 0.04 |
| NGC 1533 | 8.76 0.18 | 8.74 0.04 |
| NGC 1553 | 8.48 0.31 | 8.87 0.04 |
| NGC 2749 | 8.7 0.04 | |
| NGC 2911 | 8.56 0.16 | |
| NGC 2974 | 8.53 0.18 | 8.86 0.04 |
| NGC 3258 | 8.94 0.17 | |
| NGC 3268 | 8.83 0.16 | 8.85 0.04 |
| NGC 3607 | 8.86 0.18 | 8.94 0.04 |
| NGC 3962 | 8.62 0.18 | 8.83 0.04 |
| NGC 4374 | 8.79 0.17 | |
| NGC 4552 | 8.98 0.16 | |
| NGC 4636 | 8.75 0.17 | |
| NGC 4696 | 8.71 0.16 | 8.82 0.04 |
| NGC 4697 | 8.85 0.26 | |
| NGC 5044 | 8.66 0.16 | |
| NGC 5077 | 8.40 0.17 | 8.69 0.04 |
| NGC 5090 | 8.93 0.16 | |
| NGC 5193 | 9.01 0.16 | |
| NGC 5266 | 8.20 0.22 | 8.72 0.04 |
| NGC 5328 | 8.96 0.23 | 8.54 0.17 |
| NGC 5363 | 8.32 0.21 | 8.68 0.03 |
| NGC 5813 | 8.84 0.17 | |
| NGC 5846 | 8.84 0.17 | 8.71 0.04 |
| NGC 5898 | 8.75 0.21 | |
| NGC 6721 | 8.88 0.16 | |
| NGC 6758 | 8.63 0.18 | |
| NGC 6776 | ||
| NGC 6868 | 8.48 0.19 | |
| NGC 6876 | 8.97 0.16 | |
| NGC 6958 | 8.82 0.04 | |
| NGC 7079 | 8.72 0.28 | 8.78 0.05 |
| NGC 7097 | 8.59 0.17 | 8.67 0.03 |
| NGC 7135 | 8.64 0.16 | |
| NGC 7192 | 8.83 0.19 | |
| NGC 7377 | 8.60 0.25 | |
| IC 1459 | 8.54 0.16 | 8.78 0.03 |
| IC 2006 | 8.85 0.21 | |
| IC 3370 | 8.49 0.21 | |
| IC 4296 | 8.85 0.17 | 8.88 0.04 |
| IC5063 | 8.69 0.03 |
5.1 HII region calibration
In HII region, the oxygen metallicity is determined through the standard parametrization, first introduced by Pagel et al. (Pagel79 (1979)), and then revised by other authors (Edmund & Pagel Edmunds84 (1984); McCall, Rybski & Shields McCall85 (1985); Dopita & Evans Dopita86 (1986); McGaugh McGaugh91 (1991); Zaritsky et al. Zaritsky94 (1994)). The main problem with this calibration is that the relationship between and the oxygen abundance is double valued, requiring some a priori knowledge of a galaxy’s metallicity in order to determine its correct location in the upper or lower branch of the curve. A good discriminator is the [OIII]5007/ [NII]6584 ratio, which is usually less then 100 for galaxies with 12 + log(O/H) 8.3, on the metal rich branch (Edmunds & Pagel Edmunds84 (1984), Kobulnicky et al. Kobulnicky99 (1999)). The various calibrations, based on different photoionization models and HII region data, show a dispersion of 0.2 dex in the metal rich branch. Kobulnicky et al. (Kobulnicky99 (1999)) reports analytic expressions based on a set of photoionization models that fit the empirical calibrations within less than 0.05 dex, and that include the effect of the ionization parameter through .
We computed the oxygen abundance for our sample adopting the calibration in Kobulnicky et al. (Kobulnicky99 (1999)) (hereafter Kob99). Because of the lack of star forming regions in ETGs, this calibration is valid if: 1) the gas is photoionized by hot old stars, likely PAGB stars, and 2) the calibration is still valid even though PAGB stars have different spectral shapes than high-mass main sequence stars. The same approach was adopted by Athey & Bregman (ab09 (2009)) to determine oxygen abundances in a sample of 7 ETGs. We computed the and values using the emission line fluxes in Table 2, and correcting for reddening through the values in Col 3 of Table 2. The derived oxygen metallicities at r re/16 are given in Col. 2 of Table 6. The errors were computed by combining the intrinsic uncertainty in the calibration ( 0.15 dex, see Kob99), with the uncertainty in the emission line fluxes. We could not determine the oxygen abundance in 13 galaxies, namely IC 5063, NGC 777, NGC 1297, NGC 1521, NGC 1947, NGC 2749 , NGC 3136, NGC 3489, NGC 3557, NGC 5011, NGC 6776, NGC 6958, and NGC 7007, since is larger than 10, and falls outside the valid calibration range for HII regions.
There are 6 galaxies in common with the sample of Athey and Bregman (ab09 (2009)): NGC 3489, NGC 3607, NGC 4374, NGC 4636, NGC 5044, and NGC 5846. Excluding NGC 3489, we derived for the other galaxies central values of 0.50 0.15, 0.58 0.11, 0.63 0.1, 0.70 0.05, 0.51 0.11. For the same galaxies, they derive , , , , . With the exception of NGC 3607, our and their results are in agreement within the errors.
5.2 AGN calibration
Storchi-Bergmann et al. (Storchi98 (1998)) (hereafter SB98) derived oxygen metallicity calibrations from a grid of models assuming photoionization by a typical AGN continuum (the segmented power law of Mathews & Ferland mat87 (1987)). The first calibration (hereafter SB1) is in terms of [OIII]4959,5007/ H and [NII]6548,6584/ H (Eq. (2) in SB98), while the second calibration (hereafter SB2) is in terms of [OII]3727/ [OIII]4959,5007 and [NII]6548,6584/ H (Eq. (3) in SB98). The fitted calibrations are within 0.05 dex of the models. The models were computed assuming a gas density cm-3. The correction due to deviations from this density is , valid for 100 cm 10,000 cm-3.
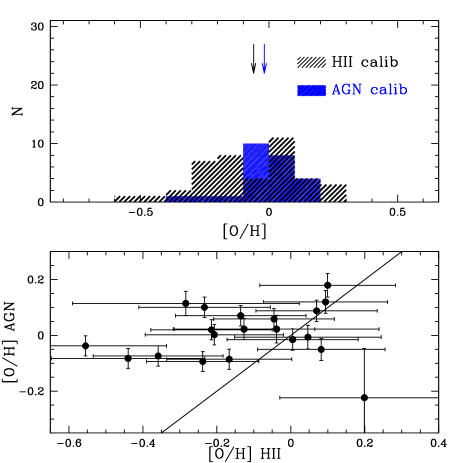
We derived oxygen metallicities for the R05A06 sample using both SB1 and SB2. The electron densities ne were calculated from the [SII]6717, 31 line ratios using the temden task within IRAF/STSDAS (Shaw & Dufour Shaw95 (1995)), and assuming an electronic temperature 10,000 K. This was possible only for some galaxies of our sample (see Table 5), because the quality of our spectra gets significantly worse beyond 6600 Å, and the presence of telluric absorption lines around 6800 Å prevents in many cases a reliable fit to the [SII] doublet. The derived electron densities are given in Table 5. As evident from the [SII] fluxes given in Table 2, both increasing and decreasing density profiles are present within our sample. The oxygen metallicities were then corrected for the density dependence assuming . Because of the limited range of validity for the density correction, we discarded the galaxies with n 100 cm-3. The [O/H] values obtained with SB1 and SB2 are compared in Fig. 12. The metallicities obtained with SB2 are on average 0.09 dex larger than those obtained with SB1, in agreement with SB98 who derived a shift of 0.11 dex between the two calibrations. The final metallicities are computed as the average between the two values. The results are given in Col. 3 of Table 6.
We compare the results obtained with the Kob99 and with the SB98 calibrations in Fig. 13. The SB98 calibration provides an average oxygen abundance 0.04 dex higher than that obtained with Kob99. Also, Kob99 provides a broader metallicity range than SB98.
5.3 Abundance gradients
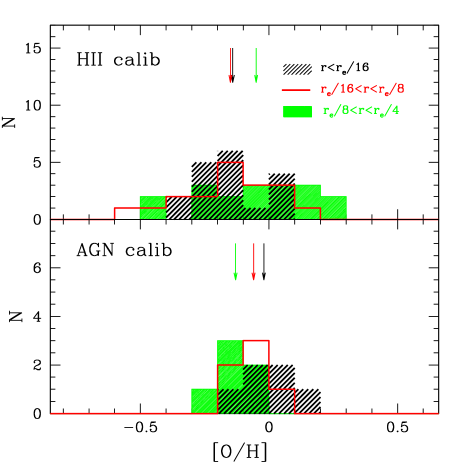
We studied the behavior of the oxygen metallicity as function of galacto-centric distance. The [O/H] distributions obtained with Kob99 and SB98 in the three more internal annuli (r re/16, re/16 r re/8, re/8 r re/4) are shown in Fig. 14. The samples are not very large because of the increased difficulty in measuring the emission lines in the more external annuli. Emission lines are too faint to allow a reliable abundance measurement in the more external annulus (re/4 r re/2). The results obtained with the Kob99 and SB98 calibrations are contradictory: in the first case, the oxygen metallicity tends to increase from the galaxy center outwards. In the second case, the opposite behavior is observed. The latter trend is more consistent with the negative metallicity gradients of the stellar populations.
5.4 Comparison with stellar metallicities
To understand the origin of the warm gas in ETGs it is important to compare the nebular metallicities with those of the stellar populations. We already derived the (total) stellar metallicities (Z) and the [/Fe] ratios for the R05A06 sample through the Lick indices in Paper III. The comparison with the nebular metallicities is not straightforward, since the emission lines provide a direct measure of the oxygen abundance, while the Lick indices depend on a mixture of different elements. In this paper, we compute the oxygen stellar metallicities from the Z and [/Fe] values derived in Paper III, assuming that O belongs to the -enhanced group (Ne, Na, Mg, Si, S, Ca, Ti, and also N). The comparison between gas and star metallicities is shown in Fig. 15. The clear result is that, irrespective of the adopted calibration (Kob99 or SB98), the gas metallicity tends to be lower than the stellar metallicity. The effect is more severe for the galaxies with the largest stellar metallicities. A Spearman test shows that in both cases the star and gas metallicities are poorly correlated.
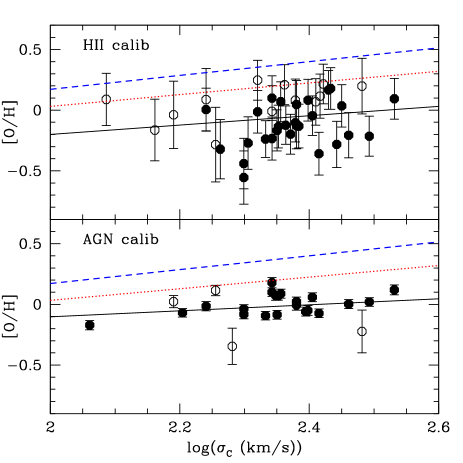
We plot the central (r re/16) nebular metallicities obtained with Kob99 and SB98 versus the galaxy stellar velocity dispersions in Fig. 16. Linear square fits provide an increasing trend of with in both cases. However, the Spearman correlation coefficients are low ( with degrees of freedom for Kob99, top panel, and with degrees of freedom for SB98, bottom panel), indicating that the correlations are weak. For comparison, we plotted in Fig. 16 the stellar metallicity- relations derived by us in Paper III (A07) and by Thomas et al. (tho05 (2005)) for low density environment ETGs. The A07 relation was appropriately re-scaled to account for the solar metallicity adopted in this paper 333 in A07, while we adopt from Caffau et al. (Caffau09 (2009)) in this paper. This implies a correction term of dex to be applied to the A07 relation.. In Fig. 16, the fits provide and at 200 km s-1 for Kob99 and SB98, respectively. For comparison, the A07 relation gives a stellar metallicity of 0.18 dex at the same , i.e. 0.26 dex and 0.21 dex larger than those obtained for the warm gas with Kob99 and SB98. The discrepancy is even larger if we consider the Thomas et al. (tho05 (2005)) relation, which provides a metallicity of 0.34 dex at 200 km s-1, i.e. 0.4 dex higher than the nebular metallicity. We notice that the discrepancy between gas and stars persists (and is even more significant) if we consider only the high emission (H) galaxies (see classification in Table 4).
6 Comparison with Models
The ionizing source in LINERs is still not well understood. Among the proposed mechanisms, we recall sub-Eddington accretion into a super massive black hole (e.g., Ho 1999b ; Kewley et al. kew06 (2006), Ho 2009a ), photoionization by old PAGB stars (e.g. Trinchieri & di Serego Alighieri tds91 (1991); Binette et al. bin94 (1994); Stasińska et al. sta08 (2008)), fast shocks (Koski & Osterbrock ko76 (1976); Heckman heck80 (1980); Dopita & Sutherland dosu95 (1995); Allen et al. allen08 (2008)).
The first hypothesis is strongly supported by our current knowledge of the demography of central BHs based on direct dynamical searches (Magorrian et al. mago98 (1998); Ho 1999a ; Kormendy kor04 (2004)),according to which massive BHs appear to be a generic component of galaxies with a bulge. As shown by Ho et al. (1997c ), local stellar mass loss can supply the fuel necessary to accretion rates of . Thus, radiatively inefficient accretion flows onto a central BH (see Quataert quat01 (2001) for a review) provide an attractive solution to explain the origin of LINERs. Additional evidences for the presence of AGN activity come from X-ray and radio observations, which have revealed the presence of compact nuclear X-ray and radio sources, sometimes with detected variability, in a significant fraction of LINERs (see e.g. Terashima tera99 (1999); Flohic et al. flo06 (2006); Filho et al. filh06 (2006); Gonzalez-Martin et al. go09 (2009); Pian et al. pian10 (2010)). On the other hand, some LINERs lack evidence of a central AGN, leaving space to alternative explanations for the observed emission lines. X-ray and radio studies are available in the literature for a few galaxies in our sample. Compact nuclear X-ray and/or radio sources have been detected in IC 5063 (Koyama et al. koy92 (1992)), NGC 777 (Ho & Ulvestad hu01 (2001)), NGC 1052, NGC 4374, IC 1459 (Gonzalez-Martin et al. go09 (2009)), NGC 5363 (Gonzalez-Martin et al. go09 (2009), Filho et al. filh06 (2006)), NGC 1553 (Blanton et al. bla01 (2001)), NGC 3557 (Balmaverde et al. bal06 (2006)), NGC 5090 (Grützbauch et al. gru07 (2007)), IC 4296 (Pellegrini et al. pel03 (2003)), NGC 5077, (Filho et al. filh06 (2006)), and NGC 4552 (Nagar et al. nag02 (2002), Filho et al. filh04 (2004)). Other galaxies observed in X-ray and/or radio lack evidence for AGN activity: NGC 3607, NGC 4636, NGC 5813, (Gonzalez-Martin et al. go09 (2009), Filho et al. filh06 (2006)), NGC 4696, NGC 5846 (Gonzalez-Martin et al. go09 (2009)), NGC 6876 (Machacek et al. mac05 (2005)). High quality X-ray imaging has revealed in NGC 4636 the signature of shocks, probably driven by energy deposited off-center by jets (Jones et al. jo02 (2002); Baldi et al. bald09 (2009)).
Shock heating was initially proposed as a viable excitation mechanism to solve the so-called “temperature problem” of Seyferts and LINERs, in which the electron temperatures observed were found to be systematically higher than predicted by photoionization models. Indeed, Koski & Osterbrock (ko76 (1976)) and Fosbury et al. (fos78 (1978)) argued that shocks are essential to explain the observed [OIII] line ratios in the prototypical LINER NGC 1052. Dopita & Sutherland (dosu95 (1995)) and Allen et al. (allen08 (2008)) presented extensive grids of high velocity shock models, and showed that the emission line ratios observed in LINERs can be modeled in terms of fast shocks (150 - 500 km s-1) in a relatively gas poor environment.
The findings that the emission-line flux correlates with the host galaxy stellar luminosity within the emission-line region (Macchetto et al. mac96 (1996)), and that the line flux distribution closely follows that of the stellar continuum (Sarzi et al. sar06 (2006, 2009)), have been presented as evidences in support of the PAGB scenario. These results suggest in fact that the sources of ionizing photons are distributed in the same way as the stellar population. Recently, Sarzi et al. (sar09 (2009)) tried to model the H EW spatial distribution under the assumption that the ionizing photons originate from an underlying old stellar population. They showed that to obtain an almost constant EW it is necessary to assume that the gas radial profile decrease more gently than the ionizing radiation, or alternatively that the ionizing photons are more concentrated than the bulk of the stellar populations. Indeed, the presence of negative metallicity gradients in ETGs (e. g., Annibali et al. anni07 (2007)) could explain this effect, because in general the ionizing flux from old populations is larger for higher metallicities. The Stasińska et al. (sta08 (2008)) models are able to reproduce the emission line ratios of LINERs provided that the ionization parameter is sufficiently high (). Binette et al. (bin94 (1994)) and Cid Fernandes et al. (cf09 (2009)) demonstrated that photoionization by PAGB stars can only explain LINERs with relatively weak emission lines. Binette et al. (bin94 (1994)) estimated that the H equivalent width produced by a 8 Gyr old and a 13 Gyr old simple stellar populations amounts to 0.6 Å and 1.7 Å, respectively. Stronger emission lines require far more ionizing photons than old stars can provide.
A first-order test on the validity of the PAGB scenario consists in a comparison of the observed and predicted EWs. Following the computations of Binette et al. (bin94 (1994)), we assume that photoionization by old stars produce a typical emission of 1 Å in H. Comparing this value with our measured central () EWs, we obtain that PAGB photoionization alone can explain the observed nuclear emission in only 11 out of the 49 galaxies classified as LINERs/Composites in our sample (i.e. in 22% of the LINERs/Comp sample). This implies that, for the majority of the cases, some mechanism other than PAGB stars must be at work in the central regions of LINERs. On the other hand, as we progressively move toward larger radii, an increasing number of LINERs enter the EW(H) Å transition region, where the emission strength is compatible with photoionization by PAGB stars alone. Thus, while our computations exclude that PAGB stars play a significant role in the central galaxy regions, we can not rule out that they are an important excitation source at larger radii. Interestingly, Sarzi et al. (sar09 (2009)) quote a 3” radius for the maximum extent of central activity, which for their sample galaxies corresponds on average to 0.11 re.
One of the arguments presented in support of the PAGB photoionization scenario is that the emission flux closely follows the stellar continuum. At odds with other results (e.g. Sarzi et al. sar09 (2009)), we have shown in Section 3.3 that the EW (emission flux over continuum flux) decreases with radius. Is this incompatible with the PAGB scenario? Answering this question is not straightforward. First of all, we have shown that the strongest decrease in EW occurs from the nuclear to the second (re/16 r re/8) annulus, being much gentler at larger radii. Indeed, our data lack the depth necessary to reliably trace the emission strength beyond r. Second, neither a well established decreasing trend in EW would be per se incompatible with the PAGB scenario: in fact, because of the presence of age/metallicity gradients in the stellar population, the ratio of the ionizing flux over the optical continuum is not necessarily constant. A reliable radial prediction of the ionizing photon budget stems on a detailed analysis of the combined effect of age and metallicity on the PAGB population, which is beyond the aims of this paper.
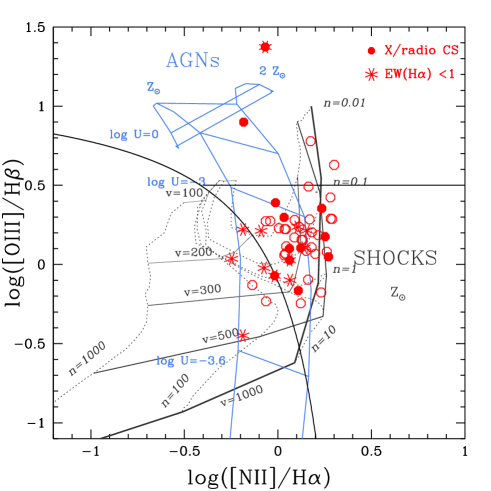
Since the nuclear emission requires a mechanism different than PAGB photoionization, we compare in Fig. 17 our (r re/16) data, corrected for reddening, with the dusty AGN models of Groves et al. (gro04 (2004)), and with the fast shock models of Allen et al. (allen08 (2008)). Among the data points, we identify objects with compact nuclear X-ray and/or radio source detections, likely hosting an AGN, and objects with equivalent width in H Å , compatible with sole ionization from PAGBs. We notice that three galaxies (NGC 777, NGC 4552, and NGC 3557) present evidence for AGN activity from X ray or radio observations, and at the same time have EW(H). Comparing dusty models with reddening-corrected data is not completely self-consistent; however the effect of extinction in the BPT diagram is negligible.
Both the AGN and shock models were developed using the code MAPPINGS III (Dopita et al. dop82 (1982); Sutherland & Dopita sudo93 (1993)), implemented with dust and radiation pressure (Groves et al. gro04 (2004)). The AGN models were developed for different metallicities, and assuming a power law with slope between and for the ionizing spectrum. For the AGN models in Fig. 17, , and 2 , =1000 cm-3, and between and 0. LINERs and Seyferts are both explainable with being AGNs, provided that the formers have much lower ionization parameters than the latters. According to these models, the galaxies in our sample should have gas metallicities much above solar. This is in disagreement with the oxygen metallicities derived in Section 5 with the Storchi-Bergmann et al. (Storchi98 (1998)) calibration. The discrepancy arises from the use of a power law in the Groves et al. (gro04 (2004)) models compared to the typical AGN continuum of Mathews & Ferland (mat87 (1987)) adopted by SB98. SB98 noticed in fact that models obtained with power-law ionizing continua yield systematically larger (up to 0.5 dex) metallicities than models that adopt a typical AGN continuum.
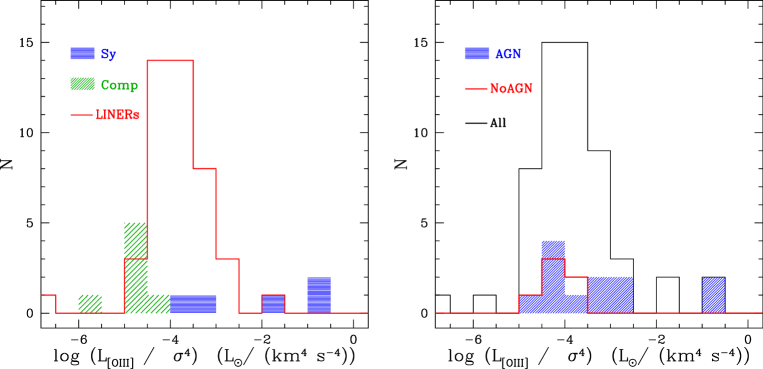
Under the assumption that all the central LINERs activity is powered by a sub-Eddington accretion AGN, we can attempt a determination of the accretion rate from the ratio (where is the extinction corrected [OIII] luminosity), proportional to (Heckman et al. heck04 (2004)). The result is shown in Fig. 18. The accretion rate increases systematically along the sequence Composite LINERs Seyferts (left panel) in agreement with recent findings by Ho (2009a ). Also, galaxies with compact nuclear X-ray/ radio sources, likely hosting an AGN, tend to have larger accretion rates than non -AGN galaxies (right panel). Notice that since , and in the sub-Eddington accretion regime, the AGN luminosity can vary significantly for a fixed depending on the accretion . This implies that it is necessary to assume a maximum, sub-Eddington, accretion rate to reproduce the observed trend between the emission strength and .
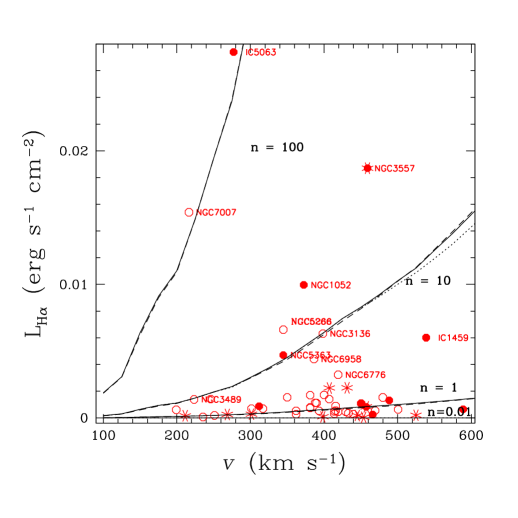
The Allen et al. (allen08 (2008)) shock models are dust free, and were computed for different chemical abundances, pre-shock densities from 0.01 to 1000 cm-3, velocities up to 1000 km s-1, and magnetic parameters from 10-4 to 10 G cm3/2, where B is the pre-shock transverse magnetic field. In Fig. 17, we plotted the models with solar metallicity and B. With these parameters, the bulk of LINERs in our sample is well reproduced by pre-shock densities cm-3, and shock velocities km . Using a higher magnetic field implies larger densities for our sample. For instance, for B10 G, our data are consistent with pre-shock densities as high as cm-3. This range in B is typical of the ISM (e.g., Rand & Kulkarni rk89 (1989)).
Are these densities consistent with those derived from the observed [SII](6717)/[SII](6731) ratios? As shown in Table 5, the majority of our galaxies have ratios , implying n 600 cm-3 for an assumed T10,000 K. A significant fraction of galaxies have ratios around 1.45, which is the saturation limit for n 0. These values are consistent with pre-shock densities as low as n10 cm-3. Indeed, as the density of the material passing through the shock increases, the density indicated by the [SII] ratio also increases. However, the amount of compression depends critically upon the magnetic parameter (Dopita & Sutherland dosu95 (1995)). In the Allen et al. (allen08 (2008)) models, [SII](6717)/[SII](6731) 0.7 and 1 for a pre-shock density n10 cm-3, and B1 and 10 G, respectively.
In the fast shock scenario, where does the mechanical energy come from? Dopita & Sutherland (dosu95 (1995)) distinguish between two possible types of gas dynamical flows: jet-driven and accretion-driven flows. Evidence for jets in LINERs comes from observations revealing the presence of low-luminosity AGNs associated with radio sources with a high brightness temperature and/or elongated radio morphology (e.g., Nagar et al. nag01 (2001)). In accretion-driven flows, the shock is either the result of the collision of cool clouds which have dropped out of a cooling flow into the potential of the galaxy (e.g. Crawford & Fabian crfa92 (1992)) or have been accreted from a companion galaxy. Shocks may also occur in the outer accretion disk about the central object either trough the dissipation of turbulence, dynamical intsabilities, or spiral shocks. (e.g. Dopita et al. dop97 (1997)). We suppose that the mechanical energy could also come from turbulent motion of gas clouds, injected by stellar mass loss or accreted, within the potential well of the galaxy. Fig. 17 shows that the shock velocities required to reproduce the distribution of LINERs in the BPT diagram range between 200 and 500 km/s. Are the mentioned mechanisms able to account for such high shock velocities? It seems that jet driven flows or accretion into a central massive BH can well do the job (e.g., Nagar et al. nag05 (2005), Dopita et al. dop97 (1997)). On the other hand, it is not straightforward to establish if, in absence of these sources, pure gravitational motion of clouds within the potential well of the galaxy can produce collision at the required velocities. Close to the center of a relaxed stellar system, the gas should quickly relax into a disk-like configuration and orbit at a velocity close to the circular one, even though not necessarily in the same direction of stars. Indeed, this is confirmed by observations, showing regular gaseous disk structures and coherent gas motions (see e.g. Zeilinger et al. zei96 (1996), Sarzi et al. sar06 (2006)). If most of the clouds rotate in the same direction, it would be then rather difficult for them to collide at the high speed required. On the other hand, observations detect an additional gaseous component of high gas velocity dispersion, in the range 150-250 km/s (Bertola et al. ber95 (1995); Zeilinger et al. zei96 (1996); Emsellem et al Emsellem03 (2003)). Sarzi et al. (sar06 (2006)) found that is generally smaller than the stellar velocity dispersion , but in some cases , either only in the central regions or over most of the field. For a sample of 345 galaxies, with Hubble type from E to Sbc, Ho 2009b found that the gas dispersions strongly correlate with the stellar dispersions over the velocity range of 30-350 km s-1, such that /, with an average value of 0.80. All these observations suggest that random motions are crucial for the dynamical support of the gas. Projected velocity dispersions in the range 150-250 km/s translate, under the assumption of isotropy, into intrinsic 3D velocity dispersions in the range 260-430 km/s. 444The total 3D velocity dispersion satisfies , because of the Pythagoras theorem and basic statistics of the second moments. If the dispersion is isotropic, by definition, and . This is a crude estimate of the intrinsic velocity dispersions since studies indicate deviation from isotropy (e.g. Merrifield et al. merri01 (2001)). Given these values, collisions at a speed between 200 and 500 km/s can not be excluded.
We compare the shock models of Allen et al. (allen08 (2008)) with our data in a luminosity vs velocity plane in Fig. 19. For the data, we adopted a velocity of , which is a first-order approximation for the shock velocity under the assumption that the shocks are due to motions of gas clouds in the galaxy potential well. The models are plotted for four density values ( cm-3), and for three values of the transverse magnetic field ( G). The shock luminosity increases significantly with the shock velocity and with the gas density. The dependence on the magnetic parameter is almost null in H (and modest in [NII]). The observed nuclear H luminosities were corrected for reddening through the values derived in Table 2. Some galaxies have very large reddening, associated to large uncertainties, and display quite high luminosities once corrected for extinction (NGC 777, NGC 1521, NGC 7007, NGC 3557). Their should be taken with caution. Fig. 19 shows that, for almost all the galaxies in our sample, the observed luminosities are well reproduced by models with pre-shock densities cm-3. This does not proof that shocks are the excitation mechanism in LINERs, but show that such a scenario is compatible with the data. We notice that shocks could provide a natural explanation for the observed half-cone-shaped distribution in the line luminosity/EW vs plane (see also Fig.9). They could also explain the observed [NII]/H vs correlation (Fig.9).The shock models predict in fact an increase of the [NII]/H line ratio with the shock velocity. This is because higher velocity shocks result in harder and more luminous ionizing spectra. It is interesting that the weak emission galaxies in our sample, compatible with pure photoionization by PAGB stars at their center, are those deviating from the [NII]/H vs relation in Fig.9. Phillips et al. (ph86 (1986)) also found that the [NII]/H ratio increases with the galaxy absolute magnitude in a sample of LINERs. They interpreted this behavior as due to differences in metallicities or to due to differing ionization conditions.
7 Summary and Conclusions
Optical emission lines are detected in 89% of our sample. This large fraction is somehow expected, since our sample was selected among a compilation of galaxies showing traces of ISM, and it is thus biased toward the presence of emission lines. This fraction is higher than that derived by Phillips et al. (ph86 (1986)) (55%-60%), Macchetto et al. (mac96 (1996)); (72% - 85%), Sarzi et al. (sar06 (2006)) (75%), Yan et al. (yan06 (2006)) ( 52%), and Serra et al. (serra08 (2008)) (60%), for other samples of early-type galaxies. If we consider only the galaxies in our sample with EW(H [NII]6584)3 Å, the detection fraction drops to 57%.
The incidence and the strength of emission in our sample is independent on the elliptical or lenticular morphological classes. These results are in agreement with Phillips et al. (ph86 (1986)), while on the other hand Macchetto et al. (mac96 (1996)) and Sarzi et al. (sar06 (2006)) found a higher incidence of emission in lenticular than in elliptical galaxies. Following the studies of Cappellari et al. (capp07 (2007)) and Emsellem et al. (Emsellem07 (2007)), we attempted a classification between fast and slow rotators in our sample. Fast and slow rotators account for 70% and 30% of the sample, respectively. This is interesting given the fact that the sample is composed of 70% ellipticals and 30% lenticulars. Emission does not depend on the fast and slow rotator classification in our sample.
The EW of the lines tends to decrease from the center outwards. The [NII] line presents a steeper decrease than the H. However, given the uncertainties, we consider significant only the decrease from the center to 0.1 re. Deeper observations are needed to trace with higher confidence the EW out to larger radii. Some galaxies deviate from the general trend, either because they have a flatter emission profile (NGC 3489, NGC 7007, NGC 7377, NGC 5898), or because their emission is nuclear concentrated (IC 4296, NGC 4374, NGC 5090). Previous narrowband imaging and integral field spectroscopy studies have revealed extended distribution for the ionized gas (Caldwell cal84 (1984); Goudfrooij et al. 1994b ; Macchetto et al. mac96 (1996); Sarzi et al. sar06 (2006, 2009)).
Extinction was derived from the observed H/H flux ratio, assuming an intrinsic value of 3.1 for AGN-like objects (Osterbrock Osterbrock89 (1989)). This choice was driven by the fact that our galaxies show AGN-like [NII]/H ratios. For the majority of the galaxies, the derived values are lower than 0.3. Some galaxies display however very large reddenings, up to or even more. Since the observed continuum is incompatible with such large values, our result suggests that in these galaxies the dust has a patchy distribution. This is consistent with narrowband imaging studies revealing the presence of dust lanes and patches in early-type galaxies (e.g. Goudfrooij et al. 1994b ).
We performed a spectral classification for our sample through the classical [OIII]/H versus [NII]/H diagnostic diagram (BPT diagram). The classification based on the central rre/16 emission lines is provided in Table 4. About 72% of the galaxies present a central LINERs emission activity. Seyferts account for 9% of the emission sample. However, only IC 5063 can be classified as a bona fide Seyfert galaxy. The other 4 Seyferts (NGC 3489, NGC 777, NGC 7007, and NGC 6958), have very large errors in [OIII]/H (because of the faint emission in H), and the classification is less robust. We notice however that NGC 3489 and NGC 777 were classified as Seyferts also by other authors (Ho et al. 1997b , Sarzi et al. sar06 (2006)). 7 galaxies ( 12% of the emission line sample) are “Composites” (or Transition objects): NGC 3258, NGC 4552, NGC 5193, NGC 5328, NGC 6721, NGC 6876, and IC 2006. They have [NII]/H ratios intermediate between HII regions and LINERs/Seyferts. In our sample, these galaxies display the weakest emission lines. For the remaining 7% of the emission line galaxies we can not provide a classification, either because the lines are too weak, or because the spectra are too noisy.
We derive spatial trends in the emission line ratios: moving from the center toward annuli of increasing galacto-centric distance, we detect a clear decrease in the [NII]/H ratio. The decrease in [OIII]/H is less clear. It results that galaxies classified as LINERs from to their nuclear line ratios, shift toward the region of “Composites” if one consider the emission from more external regions. This could be interpreted either with a decrease in the nebular metallicity, or with a progressive “softening” of the ionizing spectrum.
We have investigated possible relations between the central line emission properties and the host galaxy properties. The main results are:
-
1.
Seyferts have young luminosity weighted ages ( 5 Gyr), and are on average younger than LINERs. LINERs span a wide age range, from a few Gyrs to a Hubble time. “Composite” have ages older than 5 Gyr, at variance with the idea that they may originate from a combined contribution of AGN and star formation.
-
2.
Excluding the Seyferts, the spread in the emission equivalent width ([NII], H or [OIII]) increases with the galaxy central velocity dispersion. Low- galaxies have weak emission lines, while high- galaxies show both weak and strong emission lines. Equivalent widths in [NII]6584 larger than 5 Å are found only in galaxies with 200 km s-1.
-
3.
If we consider only the high emission subsample (H) (see Table 4), where the emission line ratios are more reliable, a positive correlation exists between the [NII]/H ratio and .
-
4.
Excluding the Seyferts, which have larger [OIII]/H and younger ages, no relation between the emission line ratios and the galaxy age, metallicity, or /Fe enhancement is found.
7.1 The AGN-starburst connection in Seyferts
The first result is in agreement with previous findings that LINERs are older than Seyferts (e.g., Kewley et al. kew06 (2006)), and supports the idea that the star formation and the AGN phenomena co-exist (Terlevich et al. terl90 (1990); Cid Fernandes & Terlevich cf95 (1995); Heckman et al. heck97 (1997); González Delgado et al. gd01 (2001); Kauffmann et al. Kauff03 (2003); Cid Fernandes at al. cf05 (2005); Davies et al. davies07 (2007); Riffel et al. riff09 (2009)). The young luminosity weighted ages in the Seyferts of our sample are likely the result of recent star formation episodes superimposed to a several Gyrs old stellar population (see Paper III). Davies et al. (davies07 (2007)) provide evidence for a delay of 50-100 Myr between the onset of star formation and the subsequent fueling of the black hole. Given the short duration of the AGN phenomenon ( 100 Myr), this suggests that star formation has occurred a few hundreds Myrs ago in the Seyfert galaxies of our sample. Because of the short duration of the AGN phase, we also expect to observe galaxies with relatively young luminosity-weighted ages but no signatures of current Seyfert activity. This is in agreement with the fact that LINERs span a wide luminosity-weighted age range, from a few Gyrs up to a Hubble time.
7.2 The ionization mechanism in LINERs
Several studies have demonstrated that a minimum level of ionizing photons are produced in any evolved stellar systems. Thus, if cold gas is present, some level of nebular emission is always expected in early-type galaxies. However, the critical question is: can PAGB stars provide all the ionization observed in early-type galaxies? In answering this question, we should first of all distinguish between the central LINERs activity, and the more extended LINERs-like emission. Indeed, through the BPT classification carried out in annuli of increasing galacto-centric distance, we have demonstrated that ETGs have both a central and an extended LINERs-like emission. When comparing the stronger nuclear rre/16 emission with the results of the photoionization models from Binette et al. (bin94 (1994)), we obtain that only 11 out of the 49 galaxies classified as LINERs/Composites in our sample (i.e. in 22% of the LINERs/Comp sample) can be explained with photoionization by old stars alone. Of these 11 galaxies, 6 are classified as LINERs and 5 as Composites.
For the other 78% of LINERs/Composites, some mechanism different than photoionization by PAGB stars must be at work. We warn however that this fraction is very uncertain, since there is no precise description yet for the evolution and number of PAGB stars (e.g., Brown et al. br08 (2008)).
On the other hand, we can not rule out the importance of hot old stars as a photoionization source at larger radii. Indeed, the emission strength progressively decreases toward larger galacto-centric distances, so that and an increasing number of LINERs become compatible with pure PAGB stars photoionization.
Summarizing, we can not exclude a scenario in which more than a source of ionizing photons are present, with different roles at different radii. We can think of a transition region from the center, where PAGB stars fail in accounting alone for the ionizing photon budget, to more extended regions, where they may do well the job, in agreement with recent findings (Sarzi et al. sar09 (2009), Eracleous et al. era10 (2010)).
Studies of LINERs based on large sample, such as the SDSS, have been recently presented (Stasińska et al. (sta08 (2008), Cid Fernandes et al. (cf09 (2009)). However, we warn against direct comparisons of our findings with the results from SDSS for at least two reasons: the 3”-wide aperture of the SDSS usually encompasses large Kpc-scale regions where diffuse emission contribute to the nebular fluxes; and our sample is biased toward the presence of emission lines.
Once ascertained the limited role of PAGB stars in the nuclear LINERs region, we investigated other possible scenarios, more specifically photoionization by sub-Eddington accretion rate AGN and fast shocks. Direct evidence for the presence of AGNs comes from the detection of compact nuclear X-ray/ radio sources. High resolution X-ray and/or radio data are available for 18 galaxies in our sample, 16 of which are classified as LINERs. Among the 16 LINERs, evidence of an AGN is found in 10. Even if the statistics are small, this result suggests the presence of low accretion rate AGNs in 62% of LINERs. However, the presence of an AGN does not exclude the coexistence of shock heating: indeed, jet driven flows and dissipative accretion disks in active galaxies with strongly sub-Eddington accretion have ben proposed as possible sources of shocks (Dopita & Sutherland (dosu95 (1995)), Dopita et al. dop97 (1997)), and bubbles likely produced by an AGN outburst have been observed in LINERs (e.g. Baldi et al. bald09 (2009)).
Both AGN and shock models reproduce the central emission line ratios in our sample. In the dusty AGN models of Groves et al. (gro04 (2004)), LINERs require a ionization parameter , significantly lower than for Seyferts. This is consistent with a scenario in which LINERs are AGNs accreting at a much lower rate than Seyferts. LINERs can also be modeled in terms of fast shocks (200-500 km s-1) in a relatively gas poor environment (pre-shock densities cm-3, depending on the magnetic field), with gas metallicity solar. These low pre-shock densities are consistent with the observed [SII]6717/[SII]6731 ratios. A critical point concerns the high shock velocities required to explain the emission line spectrum in LINERs. Jet driven flows or accretion into a massive BH can well do the job (Nagar et al. nag05 (2005), Dopita et al. dop97 (1997)). We suppose that an alternative source of mechanical energy comes from turbulent motion of gas clouds within the potential well of the galaxy. This scenario can not be excluded since several studies revealed a gaseous component of high velocity dispersion, in the range 150- 250 Km/s, in the center of early-type galaxies (e.g. Bertola et al. ber95 (1995); Zeilinger et al. zei96 (1996), Sarzi et al. sar06 (2006)), which translates into higher intrinsic 3D velocity dispersions. This scenario is very appealing since it would naturally explain the observed trends between the emission strength, and the [NII]/H ratio, with the galaxy stellar central velocity dispersion.
A solid result from our study is that the [NII]/H ratio decreases with increasing galacto-centric distance. This trend may reflect metallicity gradients in the gas, similarly to what observed for the stars. However, this is difficult to fit in a scenario in which the gas has an external origin (see Section 7.3). If not due to metallicity variations, the [NII]/H gradient should reflect variations in the properties of the ionization mechanism. In the shock scenario, this requires decreasing shock velocities with increasing galacto-centric distances. Unfortunately, we lack the spectral resolution necessary to determine the gas velocity dispersion and, ultimately, to ascertain the presence of a radial gradient in the shock velocity.
A large fraction (40/65) of our sample was observed with Spitzer-IRS. In a forthcoming paper, we will use MIR ionic and molecular emission lines, and Polycyclic Aromatic Hydrocarbon features, to further investigate the powering mechanism in LINERs, and better disentangle the contributions from AGN photoionization and shock heating.
7.3 Origin of the gas
We derived the oxygen abundance using two calibrations present in the literature: the Kobulnicky et al. (Kobulnicky99 (1999)) calibration, valid for HII regions, and the Storchi-Bergmann et al. (Storchi98 (1998)) calibration, derived in the assumption of photoionization by a typical AGN continuum (Mathews & Ferland mat87 (1987)). The first approach was also adopted by Athey & Bregman (ab09 (2009)) to derive nebular metallicities in 7 early-type galaxies, and is probably reasonable in the case of photoionization by PAGB stars. The second calibration is valid in the case of AGN excitation, and may be reasonable if LINERs are low-accretion rate AGNs. Our result is the following: irrespective of the adopted calibration, the nebular oxygen metallicities are significantly lower than the stellar ones. The main caveat is that power-law ionizing spectra tend to provide abundances up to 0.5 dex larger compared to a typical AGN continuum. A calibration in the case of shock heating is not available in the literature. However, we can see that shock models indicate nebular metallicities not higher than solar in our sample, in agreement with the results obtained with the Kobulnicky et al. (Kobulnicky99 (1999)) and Storchi-Bergmann et al. (Storchi98 (1998)) calibrations.
Our result has an important implication for the origin of the gas, suggesting that it may have at least in part an external origin (e.g., from a cooling flow or from accretion from a companion galaxy). This is in agreement with photometric and kinematical studies in ETGs showing in many cases gas/star misalignment and gas/star angular momentum decoupling (Bertola et al. ber92 (1992); van Dokkum & Franx vdf95 (1995); Caon et al. caon00 (2000); Sarzi et al. sar06 (2006)). Indeed, kinematical and morphological peculiarities are present in 50% of our sample, suggesting that accretion is frequent. Accretion of fresh gas can feed the central supermassive BH, and activate the AGN emission. This is consistent with the fact that a major fraction of our galaxies studied in the X-ray and/or radio show nuclear compact sources.
Finally, we can not exclude that the low oxygen abundance is unrelated to the gas origin, and reflects the fact that oxygen does not vary on lockstep with the other -elements. In a survey of 27 Milky Way bulge giants, Fulbright, McWilliam, & Rich (fulbr06 (2006)) found that, although Mg appears to be enhanced at all [Fe/H], [O/Fe] declines with increasing [Fe/H] and is solar or mildly sub-solar at [Fe/H] . Also, X -ray studies have derived subsolar [O/Fe] values, but supersolar [Mg/Fe] values, in the hot gas of elliptical galaxies (e.g., Humphrey & Buote hb06 (2006); Ji et al. ji09 (2009)). This may be the evidence of an overestimate of O yield by SNII models, which do not consider significant mass loss at the late stage of massive progenitor stars (Ji et al. ji09 (2009)).
Acknowledgements.
We acknowledge a financial contribution from contract ASI-INAF I/016/07/0. F. A. thanks R. van der Marel for useful suggestions. We thank the anonymous referee for having carefully read the manuscript, and for his/her useful comments and suggestions that helped to improve significantly the paper.References
- (1) Allen, M. G., Groves, B. A., Dopita, M. A., Sutherland, R. S., & Kewley, L. J. 2008, ApJS, 178, 20
- (2) Annibali, F., Bressan, A., Rampazzo, R., & Zeilinger, W. W. 2006, A&A, 445, 79
- (3) Annibali, F., Bressan, A., Rampazzo, R., Zeilinger, W. W., & Danese, L. 2007, A&A, 463, 455
- (4) Arimoto, N., Matsushita, K., Ishimaru, Y., Ohashi, T., & Renzini, A. 1997, ApJ, 477, 128
- (5) Athey, A. E., & Bregman, J. N. 2009, ApJ, 696, 681
- (6) Baldi, A., Forman, W., Jones, C., Kraft, R., Nulsen, P., Churazov, E., David, L., & Giacintucci, S. 2009, arXiv:0909.2942
- (7) Baldwin, J. A., Phillips, M. M., Terlevich, R. 1981, PASP, 93, 5
- (8) Balmaverde, B., & Capetti, A. 2006, A&A, 447, 97
- (9) Bertelli, G., Bressan, A., Chiosi, C., Fagotto, F., Nasi, E. 1994, A&AS, 106, 275
- (10) Bertola, F., Buson, L. M., & Zeilinger, W. W. 1992, ApJ, 401, L79
- (11) Bertola, F., Cinzano, P., Corsini, E. M., Rix, H.-W., & Zeilinger, W. W. 1995, ApJ, 448, L13
- (12) Binette, L., Magris, C. G., Stasińska, G., & Bruzual, A. G. 1994, A&A, 292, 13
- (13) Blanton, E. L., Sarazin, C. L., & Irwin, J. A. 2001, ApJ, 552, 106
- (14) Bregman, J. N., Hogg, D. E., & Roberts, M. S. 1992, ApJ, 387, 484
- (15) Bressan, A., Granato, G. L., Silva, L. 1998, A&A, 332, 135
- (16) Bressan, A., et al. 2006, ApJ, 639, L55
- (17) Brown, T. M., Smith, E., Ferguson, H. C., Sweigart, A. V., Kimble, R. A., & Bowers, C. W. 2008, ApJ, 682, 319
- (18) Buote, D. A., Lewis, A. D., Brighenti, F., & Mathews, W. G. 2003, ApJ, 595, 151
- (19) Buson, L. M., et al. 1993, A&A, 280, 409
- (20) Caffau, E., Ludwig, H.-G., Steffen, M., Ayres, T. R., Bonifacio, P., Cayrel, R., Freytag, B., Plez, B. 2008, A&A, 488, 1031
- (21) Caffau, E., Maiorca, E., Bonifacio, P., Faraggiana, R., Steffen, M., Ludwig, H.-G., Kamp, I., & Busso, M. 2009, A&A, 498, 877
- (22) Caldwell, N. 1984, PASP, 96, 287
- (23) Caon, N., Macchetto, D., & Pastoriza, M. 2000, ApJS, 127, 39
- (24) Cappellari, M., Emsellem, E., Bacon, R., Bureau, M., Davies, R.L. 2008, MNRAS, 379, 418
- Cardelli et al. (1989) Cardelli, J. A., Clayton, G. C., & Mathis, J. S. 1989, ApJ, 345, 245
- (26) Cecil, G., et al. 2000, ApJ, 536, 675
- (27) Chavez, M., Bertone, E., Morales-Hernandez, J., Bressan, A. 2009, ApJ, 700, 694
- (28) Cid Fernandes, R. J., & Terlevich, R. 1995, MNRAS, 272, 423
- (29) Cid Fernandes, R., González Delgado, R. M., Storchi-Bergmann, T., Martins, L. P., & Schmitt, H. 2005, MNRAS, 356, 270
- (30) Cid Fernandes, R., Schlickmann, M., Stasinska, G., Asari, N. V., Gomes, J. M., Schoenell, W., Mateus, A., & Sodré, L., Jr. 2009, Astronomical Society of the Pacific Conference Series, 408, 122
- (31) Clemens, M. S., Bressan, A., Nikolic, B., Rampazzo, R. 2009, MNRAS, 392, L35
- (32) Corsini, E.M., Bertola, F. 1998, Journal of the Korean Physical Society, 33, 574
- (33) Crawford, C. S., & Fabian, A. C. 1992, MNRAS, 259, 265
- (34) Davies, R. L., Efstathiou, G., Fall, S. M., Illingworth, G., Schechter, P. L. 1983, ApJ, 266, 41
- (35) Davies, R. I., Sánchez, F. M., Genzel, R., Tacconi, L. J., Hicks, E. K. S., Friedrich, S., & Sternberg, A. 2007, ApJ, 671, 1388
- (36) de Jong, T., Norgaard-Nielsen, H. U., Jorgensen, H. E., & Hansen, L. 1990, A&A, 232, 317
- (37) Demoulin-Ulrich, M.-H., Butcher, H. R., & Boksenberg, A. 1984, ApJ, 285, 527
- (38) de Vaucouleurs, G., de Vaucouleurs, A., Corwin, H. G., Jr., Buta, R. J., Paturel, G., & Fouque, P. 1991, S&T, 82, 621
- (39) Domingue, D.L., Sulentic, J.W., Xu, C., Mazzarella, J., Gao, Y. Rampazzo, R., 2003, AJ, 125, 555
- (40) Dopita, M. A., Binette, L., & Schwartz, R. D. 1982, ApJ, 261, 183
- (41) Dopita, M. A., Evans, I. N. 1986, ApJ, 307, 431
- (42) Dopita, M. A., & Sutherland, R. S. 1995, ApJ, 455, 468
- (43) Dopita, M. A., Koratkar, A. P., Allen, M. G., Tsvetanov, Z. I., Ford, H. C., Bicknell, G. V., & Sutherland, R. S. 1997, ApJ, 490, 202
- (44) Edmunds, M. G., Pagel, B. E. J. 1984, MNRAS, 211, 507
- (45) Emsellem, E., Goudfrooij, P., & Ferruit, P. 2003, MNRAS, 345, 1297
- (46) Emsellem, E., Cappellari, M. Peletier, R. F., McDermid, R. M., Bacon, R. 2004, MNRAS, 352, 721
- (47) Emsellem, E., Cappellari, M., Krajnović, D., van de Ven, G., Bacon, R., et al. 2007, MNRAS, 379, 401.
- (48) Eracleous, M., Hwang, J. A., & Flohic, H. M. L. G. 2010, arXiv:1001.2926
- (49) Fabbiano, G., Kim, D.-W., & Trinchieri, G. 1992, ApJS, 80, 531
- (50) Filho, M. E., Fraternali, F., Markoff, S., Nagar, N. M., Barthel, P. D., Ho, L. C., & Yuan, F. 2004, A&A, 418, 429
- (51) Filho, M. E., Barthel, P. D., & Ho, L. C. 2006, A&A, 451, 71
- (52) Forman, W., & Jones, C. 1985, BAAS, 17, 586
- (53) Fosbury, R. A. E., Mebold, U., Goss, W. M., & Dopita, M. A. 1978, MNRAS, 183, 549
- (54) Flohic, H. M. L. G., Eracleous, M., Chartas, G., Shields, J. C., & Moran, E. C. 2006, ApJ, 647, 140
- (55) Fulbright, J. P., Rich, R. M., & McWilliam, A. 2006, Chemical Abundances and Mixing in Stars in the Milky Way and its Satellites, ESO ASTROPHYSICS SYMPOSIA. ISBN 978-3-540-34135-2. Springer-Verlag, 2006, p. 93, 93
- (56) Gastaldello, F., & Molendi, S. 2002, ApJ, 572, 160
- (57) González Delgado, R. M., Heckman, T., & Leitherer, C. 2001, ApJ, 546, 845
- (58) Gonzalez-Martin, O., Masegosa, J., Marquez, I., Guainazzi, M., & Jimenez-Bailon, E. 2009, arXiv:0905.2973
- (59) Goudfrooij, P., Hansen, L., Jorgensen, H. E., Norgaard-Nielsen, H. U., de Jong, T., & van den Hoek, L. B. 1994, A&AS, 104, 179
- (60) Goudfrooij, P., Hansen, L., Jorgensen, H. E., & Norgaard-Nielsen, H. U. 1994, A&AS, 105, 341
- (61) Goudfrooij, P., de Jong, T., Hansen, L., & Norgaard-Nielsen, H. U. 1994, MNRAS, 271, 833
- (62) Goudfrooij, P., & de Jong, T. 1995, A&A, 298, 784
- (63) Goudfrooij, P., & Emsellem, E. 1996, A&A, 306, L45
- (64) Goudfrooij, P. 1999, Star Formation in Early Type Galaxies, 163, 55
- (65) Groves, B. A., Dopita, M. A., & Sutherland, R. S. 2004, ApJS, 153, 9
- (66) Grützbauch, R., Trinchieri, G., Rampazzo, R., Held, E. V., Rizzi, L., Sulentic, J. W., & Zeilinger, W. W. 2007, AJ, 133, 220
- (67) Heckman, T. M. 1980, A&A, 87, 152
- (68) Heckman, T. M., Gonzalez-Delgado, R., Leitherer, C., Meurer, G. R., Krolik, J., Wilson, A. S., Koratkar, A., & Kinney, A. 1997, ApJ, 482, 114
- (69) Heckman, T. M., Kauffmann, G., Brinchmann, J., Charlot, S., Tremonti, C., & White, S. D. M. 2004, ApJ, 613, 109
- (70) Helmboldt, J. F. 2007, MNRAS, 379, 1227
- (71) Ho, L. C., Filippenko, A. V., Sargent, W. L. W., & Peng, C. Y. 1997a, ApJS, 112, 391
- (72) Ho, L. C., Filippenko, A. V., & Sargent, W. L. W. 1997b, ApJS, 112, 315
- (73) Ho, L. C., Filippenko, A. V., & Sargent, W. L. W. 1997c, ApJ, 487, 591
- (74) Ho, L. 1999a, Observational Evidence for the Black Holes in the Universe, 234, 157
- (75) Ho, L. C. 1999b, Advances in Space Research, 23, 813
- (76) Ho, L. C., & Ulvestad, J. S. 2001, ApJS, 133, 77
- (77) Ho, L. C. 2009, ApJ, 699, 626
- (78) Ho, L. C. 2009, ApJ, 699, 638
- (79) Humphrey, P. J., & Buote, D. A. 2006, ApJ, 639, 136
- (80) Ji, J., Irwin, J. A., Athey, A., Bregman, J. N., & Lloyd-Davies, E. J. 2009, ApJ, 696, 2252
- (81) Jones, C., Forman, W., Vikhlinin, A., Markevitch, M., David, L., Warmflash, A., Murray, S., & Nulsen, P. E. J. 2002, ApJ, 567, L115
- (82) Kauffmann, G., Heckman, T. M., Tremonti, C., Brinchmann, J., Charlot, S. et al. 2003, MNRAS, 346, 1055
- (83) Kewley, L. J., Dopita, M. A., Sutherland, R. S., Heisler, C. A., Trevena, J. 2001, ApJ, 556, 121
- (84) Kewley, L. J., Groves, B., Kauffmann, G., & Heckman, T. 2006, MNRAS, 372, 961
- (85) Kim, D.-W. 1989, ApJ, 346, 653
- (86) Kobulnicky, H. A., Kennicutt, R. C., Jr., Pizagno, James L. 1999, ApJ, 514, 544 (Kob99)
- (87) Kormendy, J. 2004, Coevolution of Black Holes and Galaxies, 1
- (88) Koski, A. T., & Osterbrock, D. E. 1976, ApJ, 203, L49
- (89) Koyama, K., Awaki, H., Iwasawa, K., & Ward, M. J. 1992, ApJ, 399, L129
- (90) Lípari, S., et al. 2004, MNRAS, 355, 641
- (91) Macchetto, F., Pastoriza, M., Caon, N., Sparks, W. B., Giavalisco, M., Bender, R., & Capaccioli, M. 1996, A&AS, 120, 463
- (92) Machacek, M. E., Nulsen, P., Stirbat, L., Jones, C., & Forman, W. R. 2005, ApJ, 630, 280
- (93) Magorrian, J., et al. 1998, AJ, 115, 2285
- (94) Malin, D.F., Carter, D. 1983, ApJ, 274, 534
- (95) Maoz, D., Nagar, N. M., Falcke, H., & Wilson, A. S. 2005, ApJ, 625, 699
- (96) Martel, A. R., et al. 2004, AJ, 128, 2758
- (97) Mathews, W. G., & Ferland, G. J. 1987, ApJ, 323, 456
- (98) McCall, M. L., Rybski, P. M., Shields, G. A. 1985, ApJS, 57, 1
- (99) McGaugh, S.S. 1991, ApJ, 380, 140
- (100) Merrifield, M. R., Gerssen, J., & Kuijken, K. 2001, Galaxy Disks and Disk Galaxies, 230, 221
- (101) Morganti, R., et al. 2006, MNRAS, 371, 157
- (102) Nagar, N. M., Wilson, A. S., & Falcke, H. 2001, ApJ, 559, L87
- (103) Nagar, N. M., Falcke, H., Wilson, A. S., & Ulvestad, J. S. 2002, A&A, 392, 53
- (104) Nagar, N. M., Falcke, H., & Wilson, A. S. 2005, A&A, 435, 521
- (105) Osterbrock, D. E. 1989, ST, 78, 491
- (106) Oosterloo, T. A., Morganti, R., Sadler, E. M., van der Hulst, T., & Serra, P. 2007, A&A, 465, 787
- (107) O’Sullivan, E., Forbes, D. A., & Ponman, T. J. 2001, MNRAS, 328, 461
- (108) Pagel, B. E. J., Edmunds, M. G., Blackwell, D. E., Chun, M. S., Smith, G. 1979, MNRAS, 189, 95
- (109) Panuzzo, P., et al. 2007, ApJ, 656, 206
- (110) Pellegrini, S., Venturi, T., Comastri, A., Fabbiano, G., Fiore, F., Vignali, C., Morganti, R., & Trinchieri, G. 2003, ApJ, 585, 677
- (111) Phillips, M. M., Jenkins, C. R., Dopita, M. A., Sadler, E. M., & Binette, L. 1986, AJ, 91, 1062
- (112) Pian, E., Romano, P., Maoz, D., Cucchiara, A., Pagani, C., & Parola, V. L. 2010, MNRAS, 401, 677
- (113) Pierfederici, F., Rampazzo, R. 2004, AN, 325, 359
- (114) Quataert, E. 2001, Probing the Physics of Active Galactic Nuclei, 224, 71
- (115) Rampazzo, R., Annibali, F., Bressan, A., Longhetti, M., Padoan, F., & Zeilinger, W. W. 2005, A&A, 433, 497
- (116) Rand, R. J., & Kulkarni, S. R. 1989, ApJ, 343, 760
- (117) Riffel, R. A., Storchi-Bergmann, T., Dors, O. L., & Winge, C. 2009, MNRAS, 393, 783
- (118) Roberts, M. S., Hogg, D. E., Bregman, J. N., Forman, W. R., & Jones, C. 1991, ApJS, 75, 751
- (119) Sadler, E. M., & Gerhard, O. E. 1985, MNRAS, 214, 177
- (120) Sadler, E. M., Oosterloo, T., & Morganti, R. 2002, The Dynamics, Structure & History of Galaxies: A Workshop in Honour of Professor Ken Freeman, ASP Conference Proceedings, Vol. 273. Edited by G.S. Da Costa and Helmut Jerjen
- (121) Sánchez-Blázquez, P., et al. 2006, MNRAS, 371, 703
- (122) Sandage, A., & Tammann, G. A. 1987, Carnegie Institution of Washington Publication, Washington: Carnegie Institution, 1987, 2nd ed.,
- (123) Sage, L. J., & Welch, G. A. 2006, ApJ, 644, 850
- Saraiva et al. (2001) Saraiva, M. F., Bica, E., Pastoriza, M. G., & Bonatto, C. 2001, A&A, 376, 43
- (125) Sarzi, M., et al. 2006, MNRAS, 366, 1151
- (126) Sarzi, M., et al. 2009, arXiv:0912.0275
- (127) Serra, P., Trager, S. C., Oosterloo, T. A., & Morganti, R. 2008, A&A, 483, 57
- (128) Shaw, R. A., Dufour, R. J. 1995, PASP, 107, 896
- (129) Sparks, W. B., Macchetto, F., & Golombek, D. 1989, ApJ, 345, 153
- (130) Stasińska, G., Cid Fernandes, R., Mateus, A., Sodré, L., & Asari, N. V. 2006, MNRAS, 371, 972
- (131) Stasińska, G., Vale Asari, N., Cid Fernandes, R., Gomes, J. M., Schlickmann, M., Mateus, A., Schoenell, W., & Sodré, L., Jr. 2008, MNRAS, 391, L29
- (132) Storchi-Bergmann, T., Schmitt, H. R., Calzetti, D., Kinney, A. L. 1998, AJ, 115, 909 (SB98)
- (133) Sutherland, R. S., & Dopita, M. A. 1993, ApJS, 88, 253
- (134) Tal, T. van Dokkum, P.G., Nelan, J., Bezanson, R. 2009, AJ, 138 1417
- (135) Tamura, T., Kaastra, J. S., Makishima, K., & Takahashi, I. 2003, A&A, 399, 497
- (136) Temi, P., Brighenti, F., Mathews, W. G., & Bregman, J. D. 2004, ApJS, 151, 237
- (137) Terashima, Y. 1999, Advances in Space Research, 23, 851
- (138) Terashima, Y., Ho, L. C., & Ptak, A. F. 2000, ApJ, 539, 161
- (139) Terlevich, E., Díaz, A. I., & Terlevich, R. 1990, Revista Mexicana de Astronomia y Astrofisica, vol. 21, 21, 218
- (140) Thomas, D., Maraston, C., Bender, R., & Mendes de Oliveira, C. 2005, ApJ, 621, 673
- (141) Tran, H. D., Tsvetanov, Z., Ford, H. C., Davies, J., Jaffe, W., van den Bosch, F. C., & Rest, A. 2001, AJ, 121, 2928
- (142) Trinchieri, G., & di Serego Alighieri, S. 1991, AJ, 101, 1647
- (143) Tully, R. B. 1988, Nearby Galaxy Catalog, Cambridge University Press
- (144) Yan, R., Newman, J. A., Faber, S. M., Konidaris, N., Koo, D., & Davis, M. 2006, ApJ, 648, 281
- (145) Zaritsky, D., Kennicutt, R. C. Jr., Huchra, J. P. 1994, ApJ, 420, 87
- (146) Zeilinger, W. W., et al. 1996, A&AS, 120, 257
- (147) van Dokkum, P. G., & Franx, M. 1995, AJ, 110, 2027
- (148) Wang, J., & Wei, J. Y. 2008, ApJ, 679, 86
2
| Galaxy | Reg555Reg 1 r re/16; Reg 2 re/16 r re/8; Reg 3 re/8 r re/4; Reg 4 re/4 r re/2. | E(B-V) | [O II]666Negative emission values are consistent with no emission. | [Ne III] | H | [O III] | [O III] | [O I] | [N II] | H | [N II] | [S II] | [S II ] |
| NGC128 | 1 | 0.26 0.29 | 6.77 0.55 | 0.40 0.55 | 1.76 0.50 | 1.35 0.20 | 2.71 0.25 | 0.99 0.06 | 2.96 0.16 | 7.13 0.34 | 8.72 0.10 | 2.70 0.23 | 1.51 0.18 |
| NGC128 | 2 | 0.03 0.28 | 5.87 0.49 | 0.07 0.44 | 1.68 0.45 | 0.85 0.15 | 1.96 0.19 | 0.51 0.09 | 2.29 0.17 | 5.26 0.30 | 6.02 0.04 | 2.16 0.19 | 1.64 0.18 |
| NGC128 | 3 | 0.15 0.41 | 2.96 0.34 | -0.06 0.31 | 0.74 0.30 | 0.48 0.08 | 1.02 0.11 | -0.67 0.06 | 1.09 0.11 | 2.68 0.20 | 2.99 0.04 | 1.07 0.12 | 0.98 0.12 |
| NGC128 | 4 | 0.03 0.46 | 0.62 0.15 | -0.09 0.15 | 0.39 0.17 | 0.22 0.05 | 0.35 0.06 | 0.57 0.03 | 0.46 0.05 | 0.76 0.10 | -0.12 0.01 | 0.36 0.07 | 0.39 0.07 |
| NGC777 777The continuum was fitted with 2 SSPs | 1 | 2.81 3.53 | 0.89 0.16 | 0.13 0.23 | 0.03 0.12 | -0.03 0.00 | 1.14 0.07 | 0.81 0.02 | 1.13 0.12 | 1.71 0.05 | 1.51 0.02 | 7.44 0.13 | |
| NGC777 5 | 2 | 0.52 0.71 | 0.46 0.10 | -0.21 0.15 | 0.16 0.12 | -0.09 0.05 | 0.67 0.08 | 0.15 0.03 | 0.65 0.09 | 0.85 0.04 | 0.58 0.01 | 3.82 0.09 | |
| NGC7775 | 3 | 0.05 0.24 | 0.20 0.04 | -0.14 0.04 | 0.14 0.03 | -0.00 0.00 | 0.23 0.02 | 0.16 0.02 | 0.09 0.01 | 0.35 0.01 | 0.17 0.00 | 1.74 0.01 | |
| NGC7775 | 4 | 0.05 0.94 | 0.13 0.04 | -0.01 0.05 | -0.04 0.04 | 0.02 0.01 | 0.06 0.02 | 0.13 0.01 | 0.04 0.01 | 0.07 0.02 | 0.00 0.00 | 0.43 0.01 | |
| NGC1052 | 1 | 0.22 0.04 | 88.41 0.87 | 10.79 1.11 | 29.21 1.18 | 15.98 0.55 | 73.78 0.64 | 53.41 0.45 | 49.57 0.94 | 112.80 0.94 | 109.76 0.55 | 67.68 1.16 | 60.98 0.99 |
| NGC1052 | 2 | 0.38 0.09 | 30.98 0.76 | 2.71 0.54 | 7.68 0.65 | 8.54 0.56 | 19.70 0.39 | 13.29 0.20 | 15.98 0.42 | 34.57 0.53 | 32.99 0.18 | 23.96 0.44 | 17.44 0.32 |
| NGC1052 | 3 | 0.24 0.20 | 6.71 0.32 | 0.53 0.28 | 1.37 0.27 | 0.74 0.09 | 2.52 0.13 | 1.59 0.07 | 1.98 0.13 | 5.38 0.18 | 4.67 0.04 | 3.62 0.15 | 2.62 0.12 |
| NGC1052 | 4 | 0.03 0.45 | 0.60 0.14 | 0.04 0.19 | 0.29 0.13 | 0.07 0.06 | 0.31 0.08 | 0.00 0.01 | 0.34 0.04 | 0.71 0.08 | 0.35 0.01 | 0.25 0.05 | 0.21 0.03 |
| NGC1209 | 1 | 0.04 0.23 | 12.74 0.96 | -0.39 0.96 | 3.74 0.85 | 2.04 0.30 | 4.82 0.37 | 1.10 0.17 | 5.46 0.28 | 9.39 0.46 | 14.21 0.09 | 4.69 0.36 | 3.94 0.31 |
| NGC1209 | 2 | 0.04 0.24 | 7.80 0.71 | -0.57 0.84 | 3.10 0.71 | 1.72 0.22 | 3.52 0.29 | 0.91 0.13 | 3.43 0.19 | 6.34 0.36 | 9.02 0.11 | 2.41 0.25 | 2.36 0.22 |
| NGC1209 | 3 | 0.04 0.25 | 2.83 0.47 | -0.63 0.63 | 1.79 0.43 | 0.80 0.22 | 1.21 0.28 | 0.53 0.04 | 1.08 0.11 | 2.63 0.21 | 3.07 0.05 | 0.73 0.14 | 0.75 0.11 |
| NGC1209 | 4 | 0.04 0.52 | 0.14 0.18 | -0.13 0.26 | 0.35 0.17 | 0.31 0.10 | 0.31 0.18 | 0.13 0.03 | 0.26 0.04 | 0.42 0.09 | 0.43 0.02 | -0.04 0.05 | -0.00 0.04 |
| NGC1297 | 1 | 0.52 0.52 | 3.74 0.43 | 0.16 0.51 | 0.67 0.34 | 0.64 0.19 | 1.35 0.24 | 0.64 0.06 | 1.38 0.10 | 3.49 0.23 | 3.04 0.04 | 2.07 0.15 | 1.91 0.11 |
| NGC1297 | 2 | 0.06 0.44 | 1.30 0.17 | -0.01 0.25 | 0.40 0.17 | 0.34 0.10 | 0.74 0.15 | 0.41 0.04 | 0.59 0.04 | 1.33 0.10 | 1.08 0.02 | 0.77 0.06 | 0.64 0.04 |
| NGC1297 | 3 | 0.03 0.50 | 0.42 0.08 | 0.07 0.10 | 0.18 0.09 | 0.19 0.05 | 0.19 0.05 | 0.04 0.02 | 0.19 0.02 | 0.36 0.05 | 0.24 0.01 | 0.14 0.03 | 0.11 0.01 |
| NGC1297 | 4 | 1.00 1.83 | 0.08 0.02 | 0.03 0.04 | 0.03 0.05 | 0.03 0.02 | 0.07 0.02 | 0.09 0.01 | 0.14 0.01 | 0.22 0.02 | -0.03 0.00 | 0.18 0.01 | 0.04 0.01 |
| NGC1380 | 1 | 0.25 0.35 | 3.20 0.84 | -0.58 0.86 | 2.31 0.80 | 1.23 0.25 | 3.41 0.39 | 1.85 0.16 | 5.32 0.31 | 9.21 0.47 | 12.32 0.11 | 3.49 0.37 | 3.55 0.40 |
| NGC1380 | 2 | 0.51 0.47 | 2.86 0.70 | 0.00 0.73 | 1.45 0.68 | 0.76 0.20 | 2.13 0.29 | 0.94 0.15 | 3.09 0.22 | 7.44 0.37 | 8.29 0.10 | 2.73 0.29 | 1.98 0.25 |
| NGC1380 | 3 | 0.44 0.49 | 1.52 0.45 | -0.10 0.50 | 0.91 0.44 | -0.02 0.06 | 1.02 0.22 | 0.59 0.11 | 1.69 0.14 | 4.38 0.26 | 4.66 0.05 | 1.80 0.18 | 1.16 0.16 |
| NGC1380 | 4 | 0.02 0.44 | 0.47 0.23 | 0.01 0.32 | 0.61 0.26 | 0.03 0.10 | 0.62 0.15 | 0.01 0.02 | 0.93 0.07 | 1.64 0.13 | 1.63 0.03 | 0.55 0.09 | 0.26 0.07 |
| NGC1453 | 1 | 0.11 0.19 | 10.06 0.51 | 0.08 0.42 | 2.72 0.52 | 1.72 0.24 | 3.93 0.27 | 1.42 0.12 | 4.37 0.23 | 9.21 0.31 | 12.56 0.05 | 6.28 0.29 | 4.89 0.26 |
| NGC1453 | 2 | 0.11 0.21 | 5.37 0.39 | -0.14 0.38 | 1.88 0.38 | 1.35 0.13 | 2.59 0.17 | 0.59 0.07 | 2.45 0.14 | 4.96 0.23 | 6.10 0.04 | 2.65 0.18 | 2.40 0.20 |
| NGC1453 | 3 | 0.11 0.23 | 1.39 0.16 | -0.17 0.21 | 0.75 0.17 | 0.54 0.06 | 0.98 0.09 | 0.09 0.02 | 0.58 0.06 | 1.34 0.10 | 1.43 0.02 | 0.40 0.06 | 0.59 0.07 |
| NGC1453 | 4 | 0.11 0.29 | 0.43 0.06 | -0.03 0.09 | 0.21 0.06 | 0.09 0.03 | 0.36 0.07 | -0.00 0.02 | 0.15 0.02 | 0.44 0.03 | 0.40 0.01 | 0.14 0.02 | 0.08 0.02 |
| NGC15215 | 1 | 1.22 1.51 | 0.80 0.40 | 0.04 0.63 | 0.24 0.36 | 0.51 0.12 | 0.49 0.23 | -0.00 0.03 | 1.16 0.14 | 2.54 0.25 | 3.27 0.06 | 0.56 0.22 | 0.46 0.19 |
| NGC15215 | 2 | 0.30 1.20 | 0.54 0.37 | 0.05 0.59 | 0.30 0.36 | 0.07 0.18 | 0.17 0.28 | -0.01 0.02 | 0.33 0.09 | 1.26 0.19 | 1.40 0.05 | 0.48 0.09 | 0.28 0.07 |
| NGC15215 | 3 | 0.04 8.66 | 0.32 0.17 | -0.29 0.27 | -0.02 0.18 | -0.01 0.10 | 0.14 0.15 | 0.00 0.01 | 0.42 0.04 | 0.29 0.09 | 0.52 0.03 | 0.10 0.04 | 0.09 0.04 |
| NGC15215 | 4 | 0.04 0.77 | 0.04 0.05 | -0.06 0.08 | 0.08 0.06 | 0.08 0.04 | 0.22 0.06 | 0.03 0.01 | -0.01 0.01 | 0.14 0.04 | 0.10 0.01 | 0.01 0.01 | 0.01 0.01 |
| NGC1533 | 1 | 0.01 0.24 | 9.45 1.24 | 0.43 0.76 | 4.77 1.13 | 2.71 0.40 | 7.99 0.47 | 3.88 0.19 | 6.02 0.32 | 12.56 0.63 | 13.90 0.09 | 4.66 0.42 | 3.82 0.38 |
| NGC1533 | 2 | 0.01 0.23 | 4.99 0.70 | -0.42 0.80 | 2.94 0.65 | 1.31 0.23 | 3.54 0.30 | 1.23 0.13 | 2.06 0.17 | 4.71 0.36 | 4.70 0.08 | 1.62 0.24 | 1.34 0.20 |
| NGC1533 | 3 | 0.01 0.30 | 2.54 0.32 | 0.01 0.39 | 1.01 0.28 | 0.83 0.12 | 1.90 0.18 | 0.29 0.06 | 0.56 0.07 | 1.72 0.15 | 1.37 0.03 | 0.88 0.10 | 0.65 0.08 |
| NGC1533 | 4 | 0.01 0.45 | 0.62 0.11 | -0.01 0.14 | 0.18 0.08 | 0.17 0.05 | 0.30 0.04 | 0.01 0.01 | 0.16 0.02 | 0.50 0.05 | 0.39 0.01 | 0.33 0.03 | 0.17 0.02 |
3
| Galaxy | Reg888Reg 1 r re/16; Reg 2 re/16 r re/8; Reg 3 re/8 r re/4; Reg 4 re/4 r re/2. | [O II]999Negative emission values are consistent with no emission. | [Ne III] | H | [O III] | [O III] | [O I] | [N II] | H | [N II] | [S II] | [S II ] |
| NGC128 | 1 | 7.25 0.59 | 0.59 0.81 | 0.57 0.16 | 0.43 0.06 | 0.87 0.08 | 0.27 0.02 | 0.74 0.04 | 1.78 0.09 | 2.18 0.03 | 0.73 0.06 | 0.41 0.05 |
| NGC128 | 2 | 7.13 0.59 | 0.13 0.75 | 0.64 0.17 | 0.32 0.05 | 0.73 0.07 | 0.17 0.03 | 0.69 0.05 | 1.58 0.09 | 1.81 0.01 | 0.71 0.06 | 0.54 0.06 |
| NGC128 | 3 | 5.00 0.58 | -0.15 0.74 | 0.40 0.16 | 0.25 0.04 | 0.54 0.06 | -0.31 0.03 | 0.48 0.05 | 1.18 0.09 | 1.32 0.02 | 0.51 0.06 | 0.47 0.06 |
| NGC128 | 4 | 1.92 0.48 | -0.41 0.68 | 0.39 0.17 | 0.22 0.05 | 0.34 0.06 | 0.51 0.03 | 0.38 0.04 | 0.62 0.08 | -0.10 0.01 | 0.32 0.06 | 0.34 0.06 |
| NGC777101010The continuum was fitted with 2 SSPs | 1 | 1.36 0.24 | 0.27 0.50 | 0.01 0.04 | -0.01 0.00 | 0.42 0.03 | 0.27 0.01 | 0.36 0.04 | 0.54 0.02 | 0.47 0.01 | 2.53 0.05 | |
| NGC7778 | 2 | 1.16 0.25 | -0.71 0.50 | 0.11 0.08 | -0.06 0.03 | 0.47 0.06 | 0.09 0.02 | 0.37 0.05 | 0.49 0.02 | 0.33 0.01 | 2.38 0.06 | |
| NGC7778 | 3 | 1.10 0.20 | -1.04 0.28 | 0.23 0.05 | -0.00 0.00 | 0.39 0.04 | 0.24 0.03 | 0.12 0.02 | 0.49 0.02 | 0.24 0.01 | 2.64 0.02 | |
| NGC7778 | 4 | 2.34 0.74 | -0.31 1.10 | -0.22 0.20 | 0.09 0.05 | 0.33 0.12 | 0.66 0.03 | 0.17 0.04 | 0.33 0.08 | 0.02 0.01 | 2.09 0.07 | |
| NGC1052 | 1 | 56.64 0.56 | 9.73 1.00 | 4.44 0.18 | 2.32 0.08 | 10.71 0.09 | 6.84 0.06 | 5.73 0.11 | 13.03 0.11 | 12.68 0.06 | 8.54 0.15 | 7.69 0.12 |
| NGC1052 | 2 | 31.55 0.78 | 3.89 0.77 | 2.03 0.17 | 2.23 0.14 | 5.14 0.10 | 2.96 0.04 | 3.23 0.09 | 6.98 0.11 | 6.66 0.04 | 5.23 0.10 | 3.81 0.07 |
| NGC1052 | 3 | 13.17 0.64 | 1.47 0.77 | 0.81 0.16 | 0.43 0.05 | 1.48 0.08 | 0.83 0.04 | 0.94 0.06 | 2.56 0.09 | 2.22 0.02 | 1.85 0.08 | 1.34 0.06 |
| NGC1052 | 4 | 2.69 0.63 | 0.24 1.14 | 0.43 0.19 | 0.10 0.08 | 0.46 0.11 | 0.01 0.01 | 0.42 0.05 | 0.87 0.09 | 0.43 0.02 | 0.33 0.07 | 0.28 0.05 |
| NGC1209 | 1 | 6.97 0.53 | -0.30 0.73 | 0.67 0.15 | 0.37 0.05 | 0.87 0.07 | 0.19 0.03 | 0.85 0.04 | 1.47 0.07 | 2.22 0.01 | 0.80 0.06 | 0.67 0.05 |
| NGC1209 | 2 | 5.42 0.50 | -0.55 0.82 | 0.73 0.17 | 0.41 0.05 | 0.84 0.07 | 0.21 0.03 | 0.73 0.04 | 1.35 0.08 | 1.91 0.02 | 0.55 0.06 | 0.54 0.05 |
| NGC1209 | 3 | 3.49 0.58 | -1.06 1.07 | 0.78 0.19 | 0.35 0.10 | 0.53 0.12 | 0.23 0.02 | 0.43 0.04 | 1.05 0.08 | 1.22 0.02 | 0.31 0.06 | 0.32 0.05 |
| NGC1209 | 4 | 0.43 0.55 | -0.55 1.08 | 0.39 0.19 | 0.35 0.11 | 0.35 0.20 | 0.15 0.04 | 0.27 0.04 | 0.43 0.09 | 0.44 0.02 | -0.04 0.06 | -0.00 0.05 |
| NGC1297 | 1 | 7.88 0.90 | 0.47 1.46 | 0.40 0.21 | 0.38 0.11 | 0.81 0.14 | 0.33 0.03 | 0.66 0.05 | 1.67 0.11 | 1.46 0.02 | 1.07 0.08 | 0.99 0.06 |
| NGC1297 | 2 | 4.66 0.59 | -0.04 1.17 | 0.45 0.19 | 0.37 0.11 | 0.82 0.17 | 0.38 0.04 | 0.51 0.03 | 1.15 0.08 | 0.93 0.02 | 0.71 0.06 | 0.59 0.04 |
| NGC1297 | 3 | 3.22 0.64 | 0.63 0.99 | 0.45 0.22 | 0.48 0.12 | 0.47 0.13 | 0.09 0.04 | 0.38 0.04 | 0.72 0.10 | 0.47 0.02 | 0.29 0.06 | 0.25 0.03 |
| NGC1297 | 4 | 1.43 0.31 | 0.75 0.82 | 0.17 0.31 | 0.19 0.10 | 0.47 0.10 | 0.54 0.03 | 0.71 0.05 | 1.17 0.12 | -0.17 0.02 | 1.02 0.08 | 0.22 0.05 |
| NGC1380 | 1 | 1.88 0.50 | -0.46 0.69 | 0.42 0.15 | 0.23 0.05 | 0.64 0.07 | 0.32 0.03 | 0.86 0.05 | 1.48 0.08 | 1.98 0.02 | 0.60 0.06 | 0.61 0.07 |
| NGC1380 | 2 | 1.95 0.47 | 0.00 0.67 | 0.32 0.15 | 0.18 0.05 | 0.49 0.07 | 0.21 0.03 | 0.62 0.04 | 1.50 0.07 | 1.67 0.02 | 0.59 0.06 | 0.43 0.05 |
| NGC1380 | 3 | 1.43 0.42 | -0.13 0.64 | 0.30 0.14 | -0.01 0.02 | 0.34 0.07 | 0.19 0.04 | 0.50 0.04 | 1.30 0.08 | 1.38 0.01 | 0.58 0.06 | 0.37 0.05 |
| NGC1380 | 4 | 0.79 0.38 | 0.02 0.71 | 0.36 0.15 | 0.02 0.06 | 0.37 0.09 | 0.01 0.01 | 0.50 0.04 | 0.88 0.07 | 0.88 0.02 | 0.32 0.05 | 0.15 0.04 |
| NGC1453 | 1 | 10.44 0.53 | 0.12 0.61 | 0.82 0.16 | 0.52 0.07 | 1.20 0.08 | 0.36 0.03 | 1.02 0.05 | 2.14 0.07 | 2.93 0.01 | 1.57 0.07 | 1.22 0.06 |
| NGC1453 | 2 | 7.87 0.57 | -0.28 0.77 | 0.82 0.17 | 0.58 0.06 | 1.12 0.07 | 0.22 0.03 | 0.84 0.05 | 1.70 0.08 | 2.09 0.01 | 0.97 0.07 | 0.88 0.07 |
| NGC1453 | 3 | 4.15 0.49 | -0.70 0.88 | 0.69 0.15 | 0.51 0.06 | 0.91 0.09 | 0.08 0.01 | 0.44 0.04 | 1.01 0.07 | 1.08 0.02 | 0.33 0.05 | 0.48 0.06 |
| NGC1453 | 4 | 3.90 0.51 | -0.33 1.07 | 0.62 0.17 | 0.26 0.10 | 1.05 0.21 | -0.00 0.04 | 0.35 0.05 | 1.05 0.08 | 0.96 0.02 | 0.36 0.06 | 0.20 0.04 |
| NGC15218 | 1 | 0.82 0.41 | 0.06 0.90 | 0.09 0.13 | 0.19 0.04 | 0.18 0.08 | -0.00 0.01 | 0.36 0.04 | 0.78 0.08 | 1.00 0.02 | 0.18 0.07 | 0.15 0.06 |
| NGC15218 | 2 | 0.76 0.51 | 0.09 1.14 | 0.15 0.18 | 0.03 0.09 | 0.08 0.14 | -0.00 0.01 | 0.14 0.04 | 0.55 0.08 | 0.61 0.02 | 0.23 0.04 | 0.13 0.03 |
| NGC15218 | 3 | 0.88 0.48 | -1.06 0.99 | -0.02 0.18 | -0.01 0.10 | 0.14 0.16 | 0.00 0.01 | 0.38 0.04 | 0.27 0.08 | 0.47 0.02 | 0.10 0.04 | 0.09 0.04 |
| NGC15218 | 4 | 0.33 0.42 | -0.61 0.82 | 0.25 0.18 | 0.23 0.11 | 0.67 0.19 | 0.09 0.02 | -0.02 0.02 | 0.39 0.11 | 0.27 0.03 | 0.03 0.04 | 0.02 0.02 |
| NGC1533 | 1 | 4.51 0.59 | 0.29 0.52 | 0.75 0.18 | 0.43 0.06 | 1.26 0.07 | 0.55 0.03 | 0.77 0.04 | 1.60 0.08 | 1.77 0.01 | 0.64 0.06 | 0.53 0.05 |
| NGC1533 | 2 | 3.80 0.53 | -0.45 0.88 | 0.77 0.17 | 0.35 0.06 | 0.94 0.08 | 0.31 0.03 | 0.46 0.04 | 1.06 0.08 | 1.06 0.02 | 0.39 0.06 | 0.33 0.05 |
| NGC1533 | 3 | 4.38 0.56 | 0.03 0.96 | 0.64 0.18 | 0.53 0.08 | 1.22 0.11 | 0.17 0.04 | 0.31 0.04 | 0.94 0.08 | 0.75 0.02 | 0.52 0.06 | 0.38 0.05 |
| NGC1533 | 4 | 3.53 0.64 | -0.11 1.15 | 0.40 0.17 | 0.36 0.12 | 0.64 0.08 | 0.02 0.02 | 0.30 0.04 | 0.94 0.09 | 0.73 0.02 | 0.68 0.06 | 0.35 0.04 |
Appendix A Short description of morphological and kinematic characteristics and peculiarities of the galaxy sample (Paper I+Paper II)
We collect in Table A1 the morphological and kinematic characteristics, as well as the peculiarities, of the complete R05A06 sample. The morphological and kinematic properties in Table A1 are derived from the literature, and were in part already described in the Appendix (provided as on-line material) of Paper I and Paper II.
We list in Cols. 3 and 4 the galaxy ellipticity, , and the (V/)scaled. The latter is computed from slit spectroscopy measurements through the relation provided by Cappellari et al. (capp07 (2007)), (V/)0.57(V/. It should be a reasonable approximation of the (V/)e, computed on a luminosity weighted spectrum within . For the eight galaxies in common with the SAURON sample, i.e. NGC 2974, NGC 3489, NGC 4374, NGC 4552, NGC 5813, NGC 5831, NGC 5846 and NGC 7332, the and V/ values are those derived through integral field spectroscopy. Cappellari et al. (capp07 (2007)) noticed that there is a good agreement between values derived in the literature with different methods.
Emsellem et al. (Emsellem07 (2007)) defined a new parameter, =, where is the galacto-centric distance, and and are luminosity weighted averages over the two-dimensional kinematic field. This parameter is a proxy to quantify the observed projected stellar angular momentum per unit mass, and can be used to classify ETGs into slow or fast rotators. In the vs. (V/)e plane, Cappellari et al. (capp07 (2007)) identified a region (0.00.3, 0.00.13) where slow- rotators are generally found. Lacking the 2D V and information for most of our galaxies, we used (V/)scaled to identify in the vs. (V/)e plane the fast and slow rotators. The derived classification is provided in Col. 5 of Table A1 (Ffast rotator; Sslow rotator). We obtain that 68% (36/53) of our sample is fast rotator (to be compared with 75% fast rotators in the SAURON sample). Less than 1/3 of our galaxies are slow rotators (vs 25% in the SAURON sample).
In Col. 6 and 7 of Table A1 we provide the kinematic and morphological peculiarities, respectively. A large fraction, approximately 50% of our ETGs, displays kinematic peculiarities, like counter-rotation, or peculiar faint features, like shells, tails, or decoupled gas distributions with respect to the stars.
| Table A1. kinematic and morphological overview | ||||||
| ident | RSA | (V/)scaled | Rot. | Gas vs. stars kinematic | Gas vs. stars morphological | |
| class | peculiarities | peculiarities | ||||
| NGC 128 | S02(8) pec | 0.67 | 0.44 | F | CR g-s (1) | g- d and g-maj t23∘ (5) |
| NGC 777 | E1 | 0.21 | 0.06 | S | ||
| NGC 1052 | E3/S0 | 0.28 | 0.27 | F | CR g-g (1,5) | |
| NGC 1209 | E6 | 0.52 | 0.50 | F | X- like struct.; NW linear feature (2) | |
| NGC 1297 | S02/3(0) | 0.13 | ||||
| NGC 1366 | E7/S01(7) | 0.56 | ||||
| NGC 1380 | S03(7)/Sa | 0.41 | 0.59 | F | ||
| NGC 1389 | S01(5)/SB01 | 0.37 | ||||
| NGC 1407 | E0/S01(0) | 0.07 | 0.11 | S | rotat. min. axis (5) | |
| NGC 1426 | E4 | 0.34 | 0.40 | F | ||
| NGC 1453 | E0 | 0.17 | g-d and g-maj t (5) | |||
| NGC 1521 | E3 | 0.35 | 0.54 | F | ||
| NGC 1533 | SB02(2)/SBa | 0.19 | ||||
| NGC 1553 | S01/2(5)pec | 0.38 | 0.68 | F | shells (3) | |
| NGC 1947 | S03(0) pec | 0.11 | 0.23 | F | rotat. min. axis (5) | dust-lane min. axis (5) |
| NGC 2749 | E3 | 0.07 | 0.21 | F | rotat. min. axis (5) | |
| NGC 2911 | S0p or S03(2) | 0.32 | ||||
| NGC 2962 | RSB02/Sa | 0.37 | 0.51 | F | ||
| NGC 2974 | E4 | 0.37 | 0.70 | F | shells (2); g-d and g-maj t20∘ (5) | |
| NGC 3136 | E4 | 0.24 | 0.67 | F | CR s-s (5) | |
| NGC 3258 | E1 | 0.13 | 0.08 | S | CR g-s (1) | |
| NGC 3268 | E2 | 0.24 | 0.53 | F | ||
| NGC 3489 | S03/Sa | 0.37 | 0.29 | F | gas rot. min. axis (5) | |
| NGC 3557 | E3 | 0.21 | 0.30 | F | SW fan; asym. outer isophotes (2) | |
| NGC 3607 | S03(3) | 0.11 | 0.28 | F | ||
| NGC 3818 | E5 | 0.36 | 0.27 | F | ||
| NGC 3962 | E1 | 0.22 | 0.23 | F | gas disk+outer arc-like struct. (5) | |
| NGC 4374 | E1 | 0.13 | 0.03 | S | ||
| NGC 4552 | S01(0) | 0.06 | 0.05 | S | shells (3) | |
| NGC 4636 | E0/S01(6) | 0.24 | 0.07 | S | gas irr. motion (5) | |
| NGC 4696 | (E3) | 0.34 | 0.18 | F | Faint outer shells (2) | |
| NGC 4697 | E6 | 0.32 | 0.39 | F | Non spherical inner isophotes (2) | |
| NGC 5011 | E2 | 0.15 | 0.11 | S | ||
| NGC 5044 | E0 | 0.11 | 0.13 | F | CR s-s; gas irr.motion (5) | gas fil. shape (5) |
| NGC 5077 | S01/2(4) | 0.15 | 0.06 | S | CR s-s (5); g-d and g-maj t90∘ (5) | |
| NGC 5090 | E2 | 0.15 | 0.17 | F | ||
| NGC 5193 | S01(0) | 0.07 | ||||
| NGC 5266 | S03(5) pec | 0.31 | 0.12 | S | stellar rot. min. axis (5) | dust-lane and gas along min. axis (5) |
| NGC 5328 | E4 | 0.31 | ||||
| NGC 5363 | [S03(5)] | 0.34 | 0.39 | F | dust -lane along min. axis (5) | |
| NGC 5638 | E1 | 0.11 | 0.21 | F | ||
| NGC 5812 | E0 | 0.13 | 0.11 | S | Tidal tail (2) | |
| NGC 5813 | E1 | 0.15 | 0.14 | S | CR s-s; gas irr. motion (5) | gas fil. shape (5) |
| NGC 5831 | E4 | 0.15 | 0.08 | S | CR s-s (6,7) | |
| NGC 5846 | S01(0) | 0.07 | 0.03 | S | gas irr. motion (5) | Faint outer shells (2) |
| NGC 5898 | S02/3(0) | 0.07 | 0.21 | F | CR g-s (1) | Three spiral arm-like tidal tails (2) |
| NGC 6721 | E1 | 0.15 | 0.26 | F | ||
| NGC 6758 | E2 (merger) | 0.22 | 0.12 | S | CR g-s (5) | |
| NGC 6776 | E1 pec | 0.17 | 0.24 | F | shell or loops NE (3,4); gas fil. shape (5) | |
| NGC 6868 | E3/S02/3(3) | 0.19 | 0.14 | F | CR g-s (5) | |
| NGC 6875 | S0/a(merger) | 0.41 | ||||
| NGC 6876 | E3 | 0.13 | ||||
| NGC 6958 | R?S01(3) | 0.15 | 0.20 | F | Shells (2,3) | |
| NGC 7007 | S02/3/a | 0.42 | CR g-s (1) | g-d and g- maj t30∘ (5) | ||
| NGC 7079 | SBa | 0.32 | 0.96 | F | CR g-s + s-s (1) | |
| NGC 7097 | E4 | 0.29 | 0.10 | S | CR s-s (1) | |
| NGC 7135 | S01 pec | 0.31 | 0.20 | F | jet-like debris and shells (3) | |
| NGC 7192 | S02(0) | 0.15 | 0.04 | S | CR s-s (5) | Shell (2) |
| NGC 7332 | S02/3(8) | 0.42 | 0.32 | F | CR g-g (1) | |
| NGC 7377 | S02/3/Sa pec | 0.19 | ||||
| IC 1459 | E4 | 0.28 | 0.10 | S | CR g-g (1) | shells (2) |
| IC 2006 | E1 | 0.15 | 0.16 | F | CR g-s (1) | |
| IC 3370 | E2 pec | 0.21 | 0.28 | F | X-like struct.; broad N fan (2); polar ring ? (5) | |
| IC 4296 | E0 | 0.17 | 0.13 | F | CR s-s (5) | |
| IC 5063 | S03(3)pec/Sa | 0.28 | 0.26 | F | ||
Cols. 4 and 5 list respectively (V/=0.57(V/, and the rotation class (F=fast rotator; S=slow rotator). Legenda: CR g-s: counter rotation gas vs. stars; CR s-s: counter rotation stars vs. stars; CR g-g: counter rotation gas vs. gas; stars rotat. min. axis: stars rotate along the galaxy minor axis; g-d and g-maj t: gas disk and galaxy major axis are tilted by the reported angle, if provided in the literature. References: (1) Corsini & Bertola Corsini98 (1998); (2) Tal et al. Tal09 (2009); (3) Malin & Carter MC83 (1983); (4) Pierfederici & Rampazzo Pierfederici04 (2004); (5) the description of the kinematic and morphological peculiarities of the galaxies and full references are reported in the on-line notes of Paper I and Paper II; (6) Davies et al. Davies83 (1983); (7) Emsellem et al. Emsellem04 (2004).
Appendix B Emission line ratios for the total sample in annuli of increasing galacto-centric distance.


