A Very Large Telescope imaging and spectroscopic survey of the Wolf-Rayet population in NGC 7793 ††thanks: Based on observations made with ESO telescopes at the Paranal observatory under program ID 081.B-0289 and archival NASA/ESA Hubble Space Telescope datasets, obtained from the ESO/ST-ECF Science Archive Facility.
Abstract
We present a VLT/FORS1 imaging and spectroscopic survey of the Wolf-Rayet (WR) population in the Sculptor group spiral galaxy NGC 7793. We identify 74 emission line candidates from archival narrow-band imaging, from which 39 were observed with the Multi Object Spectroscopy (MOS) mode of FORS1. 85% of these sources displayed WR features. Additional slits were used to observe H ii regions, enabling an estimate of the metallicity gradient of NGC 7793 using strong line calibrations, from which a central oxygen content of (O/H) + 12 = 8.6 was obtained, falling to 8.25 at R25. We have estimated WR populations using a calibration of line luminosities of Large Magellanic Cloud stars, revealing 27 WN and 25 WC stars from 29 sources spectroscopically observed. Photometric properties of the remaining candidates suggest an additional 27 WN and 8 WC stars. A comparison with the WR census of the LMC suggests that our imaging survey has identified 80% of WN stars and 90% for the WC subclass. Allowing for incompleteness, NGC 7793 hosts 105 WR stars for which N(WC)/N(WN)0.5. From our spectroscopy of H ii regions in NGC 7793, we revise the global H star formation rate of Kennicutt et al. upward by 50% to 0.45 M⊙ yr-1. This allows us to obtain N(WR)/N(O) 0.018, which is somewhat lower than that resulting from the WR census by Schild et al. of another Sculptor group spiral NGC 300, whose global physical properties are similar to NGC 7793. Finally, we also report the fortuitous detection of a bright ( = 20.8 mag) background quasar Q2358-32 at resulting from C iv 1548-51 redshifted to the 4684 passband.
keywords:
stars: Wolf-Rayet - galaxies: individual: NGC 7793 - galaxies: stellar content - galaxies: ISM - ISM: HII regions1 Introduction
Classical Wolf-Rayet (WR) stars are helium burning stars descended from massive O stars. Their strong stellar winds produce a unique broad emission-line spectrum, making WR stars easily identifiable in both Local Group (Massey & Johnson, 1998) and more distant star-forming galaxies (Conti & Vacca, 1990). WR stars contribute significantly to the chemical evolution of the interstellar medium (ISM) via stellar winds and core-collapse supernova (ccSNe, Dray & Tout 2003). Indeed WR stars are believed to be the progenitors of Type Ib/c supernova and some long Gamma-Ray Bursts (GRBs), however a direct observational link is yet to be established (Woosley & Bloom, 2006).
Wolf-Rayet stars can be divided into subtypes that are nitrogen-rich (WN) or carbon-rich (WC). Metal-rich environments are observed to favour WC stars due to stronger, metal-driven winds during both the WR phase (Crowther et al., 2002) and the progenitor O star phase (Mokiem et al., 2007), while we expect to find a higher fraction of WN stars in metal-poor environments (Massey & Johnson, 1998). We can investigate the distribution of WR subtypes with respect to metallicity by studying galaxies spanning a range of metallicities. Indeed, many spiral galaxies possess a super-solar nuclei and sub-solar outer regions (eg. Pagel & Edmunds 1981; Magrini et al. 2007).
It is thought that WN and WC stars are the progenitors of Type Ib and Ic SNe, respectively. The advent of 8-m class telescopes has allowed searches for WR populations to move beyond the Local Group (Schild et al., 2003). The identification of a Type Ib/c supernova progenitor is the long-term aim of our survey. The survey consists of 10 nearby star-forming galaxies, and one dwarf irregular galaxy, which were largely chosen based on criteria such as distance, star-formation rate and orientation. To date five galaxies in our sample have been completed (Schild et al. 2003; Hadfield et al. 2005; Hadfield & Crowther 2007; Crowther & Bibby 2009 & this work), whilst three are underway, and three are in the preliminary stages.
By surveying 10 galaxies within 10 Mpc, our overall aim is to produce a complete catalogue of 104 WR stars which can be referred to when a Type Ib/c supernova occurs. O stars have lifetimes of 3–10 Myr, of which 0.5 Myr is spent in the WR phase (Crowther, 2007). Given this short lifetime, statistically we would expect at least one of the stars in our sample to undergo core-collapse producing a Type Ib (H-poor) or Type Ic (H, He-poor) SNe within the next few decades. Kelly et al. (2008) investigate the location of different classes of supernovae relative to the light distribution of the host galaxy which supports different progenitors for Type Ib and Ic SNe. Leloudas et al. (2010) extend this investigation to the distribution of WR subtypes with respect to the light distribution of two galaxies (M83 and NGC 1313) in our sample. They find WC stars to favour the brighter regions, consistent with the prediction that WC stars are progenitors of Type Ic SNe. Moreover, early-type WN (WNE) stars are found to be more consistent with the distribution of Type Ib SNe, and are ruled out as Type Ic SNe progenitors.
NGC 7793 is a SA(s)d galaxy (de Vaucouleurs et al., 1991) that is part of the Sculptor group of galaxies at a distance of 3.91 Mpc (Karachentsev et al., 2003). Despite its relatively low star-formation rate (0.3 M⊙yr-1, Kennicutt et al. 2008) its low distance and favourable orientation make it an appropriate addition to our galaxy survey. Previous spectroscopic observations (using the Anglo-Australian 4m telescope) of 4 H ii regions within NGC 7793 have detected weak, broad He ii 4686 emission (Chun, 1983). However no comprehensive WR survey has been undertaken to date. Previous, albeit few, observations of H ii regions within NGC 7793 suggest that it has a shallow metallicity gradient (Webster & Smith, 1983).
In this paper we use Very Large Telescope (VLT) optical imaging and spectroscopy, combined with archival VLT and Hubble Space Telescope (HST) images to determine the massive stellar content of NGC 7793. Details of observations of NGC 7793 are presented in Section 2, including details of WR candidate selection. In Section 3 we discuss the properties of the nebular, whilst stellar properties and WR subtypes are determined in Section 4. Section 5 provides a comparison between ground and space-based observations and addresses the completeness of our survey in relation to WR stars in the Large Magellanic Cloud (LMC). A discussion of Giant H ii regions follows in Section 6, whilst Section 7 reports the serendipitous detection of a background quasar Q2358-32. Section 8 discusses the global WR population of NGC 7793 and is compared with the WR content of NGC 300, another Sculptor group spiral, and other nearby galaxies. The paper concludes with a brief summary in Section 9.
2 Observations & Data Reduction
Imaging and spectroscopy of NGC 7793 were obtained in July and September 2008 using the Focal Reduced/Low Dispersion Spectrograph #1 (FORS1) mounted at the European Southern Observatory (ESO) VLT. In addition, archival VLT/FORS1 images were used and supplemented with Hubble Space Telescope (HST) Advanced Camera for Surveys (ACS) optical images.
| Date | Filter/ | Proposal ID/ | Exposure | Seeing | |
| mask ID | () | PI | time (s) | (arcsec) | |
| Imaging | |||||
| 2002-11-01 | He ii | 4684 | 70.D-0137(A) | 800 | 1.3 |
| [O iii]/6000 | 5100 | / Royer | 800 | 1.1 | |
| 2008-07-05 | H | 6563 | 081.B-0289(D) | 270 | 0.75 |
| H /4500 | 6665 | / Crowther | 270 | 0.75 | |
| B high | 4440 | 270 | 0.75 | ||
| V high | 5570 | 270 | 0.75 | ||
| MOS Spectroscopy | |||||
| 2008-07-09 | MASK 1 | 5850 | 081.B-0289(E) | 1650 | 1.25 |
| MASK 2 | 5850 | / Crowther | 1650 | 1.25 | |
| 2008-09-23 | MASK 3 | 5850 | 1650 | 1.25 | |
2.1 VLT/FORS1 Imaging
Broad-band B- and V-high throughput images plus narrow-band H and continuum images were obtained in July 2008 (270 seconds exposure) under good conditions (FWHM = 0.75 ) using the two E2V blue-sensitive chips on FORS1 with a 6.8 6.8 arcminute field of view and a pixel scale of 0.25 arcsec pixel-1. A log of the observations is shown in Table 1. These images were reduced using standard procedures (bias subtraction & flat fielding) within IRAF (Tody, 1986).
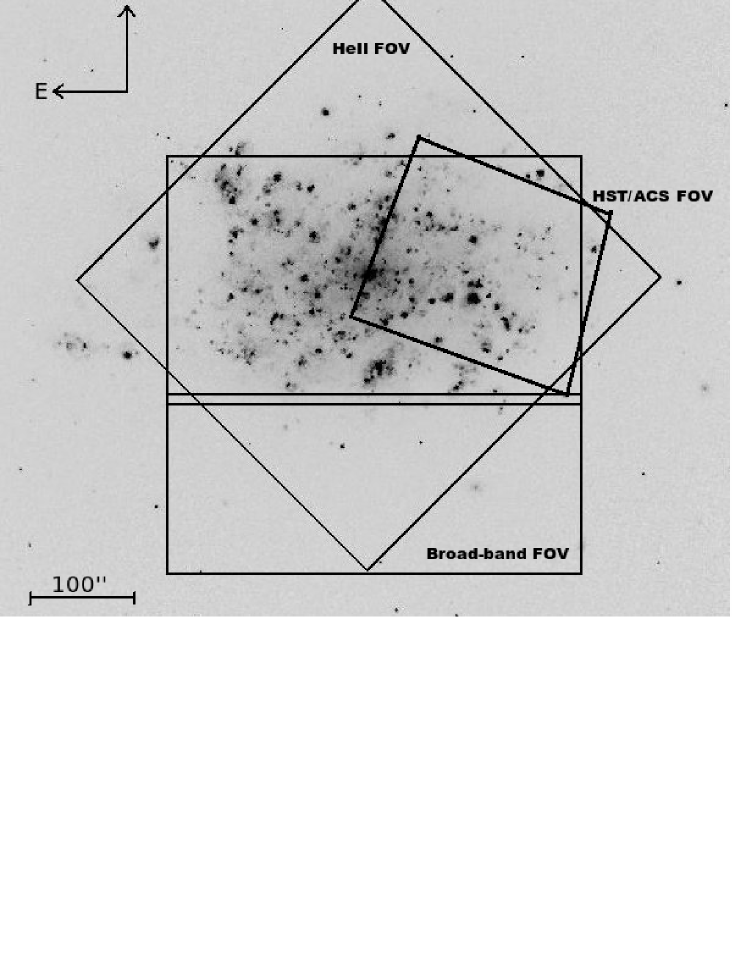
In addition, archival narrow-band He ii =4684 imaging of NGC 7793 were available via the ESO archive along with [O iii] continuum (=5100) images, offset from the [O iii]5007 line by 6000 km/s. These were taken with VLT/FORS1 (program ID 70.D–0137(A)) under average seeing conditions (1.1–1.3 ). The 6.8 6.8 arcminutes (0.2 arcsec pixel-1) field of view was covered by one 2k 2k Tektronix CCD. Due to the different detectors used on FORS1 the archival images have a different field of view to our own images, as shown in Figure 1.
2.2 HST/ACS Imaging
Ground-based data were supplemented with high resolution archival HST/ACS imaging taken from program 9774 (PI: Larsen, Mora et al. 2009). These images were obtained with the Wide Field Channel (WFC) using the F555W filter with an exposure time of 680 seconds. The much improved spatial resolution allows us to accurately locate the source of the He ii emission identified from FORS1 imaging in some instances (see Section 5.2). Other regions of NGC 7793 are covered by numerous HST pointings, however V-band images are only available using the F555W filter of the region highlighted in Figure 1.
2.3 FORS1 Photometry & Zero Points
Aperture photometry was performed using the daophot routine within iraf. The photometric errors for objects within the narrow-band image range from 0.03 mag for bright (m4684 = 20 mag) sources to 0.34 mag for the faintest (m4684 = 25 mag) sources. For the broad-band images typical photometric errors range from 0.04 to 0.25 mag for bright (mv = 20 mag) and faint (mv = 25 mag) sources respectively. Zero points for the broad-band images were determined by comparing aperture photometry, obtained using the starlink package gaia (Draper et al., 2009), of standard stars within the TPhe and PG1323-086 fields (Stetson, 2000). The zero point for the narrow-band H image was obtained in a similar way using the spectrophotometric standard star LTT 377 (Hamuy et al., 1992, 1994). The systematic error on the zero point is 0.15 mag.
The calibration of the archival 4684 and 5100 images proved more challenging as standard stars were not obtained together with the NGC 7793 images. Given the central wavelength of the 5100 filter we assumed that the 5100 magnitude corresponds to the average of the B and V magnitudes from which a zero point was obtained. To calculate the zero point for the 4684 images we adopted m4684-m5100=0 mag on average. The formal error on the overall zero point applied to the 5100 and 4684 images was 0.18 mag.
With the exposure times shown in Table 1 the archival VLT/FORS1 He ii 4684 imaging are complete to m4684 = 22.85 mag corresponding to M4684 = –5.760.18 mag for a distance of 3.91 Mpc (Karachentsev et al., 2003) and an average extinction of E(B-V) = 0.1790.024 mag (see Section 3.1). Similar values were obtained for the = 5100 continuum images.
2.4 Source Selection
From our archival narrow-band imaging we identified 74 emission line sources using the “blinking” method pioneered by Moffat & Shara (1983) and Massey & Conti (1983). daophot photometry revealed that 25% of our sources had multiple components. All sources and sub-regions are listed in Table 2 together with the corresponding photometry, we label the brightest components ‘a’, followed by ‘b’ etc. In 63 of the WR candidate regions, at least one of the multiple components showed an excess at 4684 (He ii/C iii emission) with respect to the 5100 continuum emission up to 2.43 mag. An additional 10 regions could only be detected in the 4684 filter. daophot could not achieve photometry of one candidate (#14) identified from the “blinking” method due to the spatially extended nature of the 4684 emission.
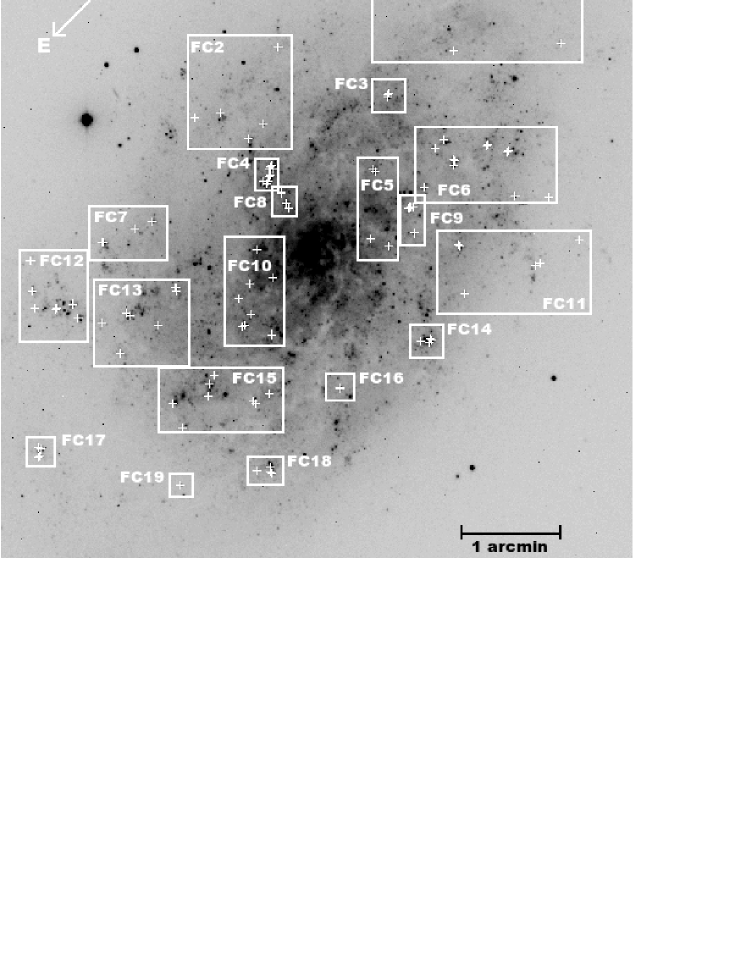
Higher spatial resolution broad-band VLT imaging, obtained at the same time as the spectroscopy, enabled B-V colours to be determined. A colour-cut of E(B-V)0.4 mag was applied for all sources that lay within the field of view of the broad-band image (recall Figure 1) to exclude very red sources. The spatial location of the WR candidates in NGC 7793 is shown in Figure 2, with the corresponding finding chart ID listed in Table 2. More detailed finding charts are available electronically (Appendix B). The deprojected distance from the centre of the galaxy, r/R25, was calculated using an inclination of i=53.7∘ and position angle of the major axis PA=99.3∘ (Carignan & Puche, 1990), with R25=4.65 arcmin (de Vaucouleurs et al., 1991; Corwin et al., 1994).
| ID | RA | Dec | r/ | mV | mB–mV | m4684 | m4684–m5100 | E(B-V) | MV | M4684 | Spectral | H ii | Finding | ||||
|---|---|---|---|---|---|---|---|---|---|---|---|---|---|---|---|---|---|
| J2000 | J2000 | mag | mag | mag | mag | mag | mag | mag | Type | region | Chart | ||||||
| 1 | 23:57:31.543 | -32:35:00.29 | 0.88 | n/a | n/a | 20.28 | 0.02 | –0.11 | 0.07 | 0.18 | n/a | –8.33 | HII region | D1 | 1 | ||
| 2 | 23:57:33.067 | -32:35:45.77 | 0.76 | 20.96 | 0.07 | –0.15 | 0.08 | 20.69 | 0.03 | –0.13 | 0.07 | 0.18 | –7.56 | –7.92 | (not WR?) | – | 1 |
| 3 | 23:57:35.837 | -32:33:43.87 | 0.95 | 20.40 | 0.09 | –0.01 | 0.09 | 20.12 | 0.05 | –0.28 | 0.06 | 0.18 | –8.12 | –8.49 | HII region | D2 | 1 |
| 4 | 23:57:37.240 | -32:35:00.03 | 0.62 | 22.48 | 0.07 | –0.12 | 0.08 | 21.19 | 0.02 | –1.40 | 0.08 | 0.13 | –5.88 | –7.24 | WC4–6 | – | 1 |
| 5b | 23:57:38.858 | -32:36:11.06 | 0.53 | 20.41 | 0.07 | –0.25 | 0.12 | 20.15 | 0.03 | –0.01 | 0.07 | 0.18 | –8.11 | –8.45 | (not WR?) | D8 | 6 |
| 5a | 23:57:38.942 | -32:36:11.27 | 0.53 | 19.53 | 0.08 | 0.14 | 0.10 | 19.45 | 0.03 | –0.02 | 0.04 | 0.18 | –8.99 | –9.16 | (not WR?) | D8 | 6 |
| 6 | 23:57:39.049 | -32:36:50.94 | 0.65 | 20.11 | 0.06 | 0.43 | 0.10 | 20.23 | 0.03 | –0.06 | 0.07 | 0.18 | –8.41 | –8.38 | HII region | – | 6 |
| 7a | 23:57:39.381 | -32:35:58.98 | 0.49 | 20.25 | 0.06 | –0.28 | 0.11 | 20.00 | 0.03 | –0.15 | 0.07 | 0.18 | –8.27 | –8.61 | HII region | D10 | 6 |
| 7b | 23:57:39.450 | -32:35:59.03 | 0.48 | 20.81 | 0.06 | –0.16 | 0.17 | 21.01 | 0.06 | –0.23 | 0.18 | 0.18 | –7.71 | –7.60 | HII region | D10 | 6 |
| 8 | 23:57:39.532 | -32:37:24.42 | 0.79 | 20.97 | 0.01 | –0.21 | 0.21 | 20.72 | 0.01 | –0.43 | 0.03 | 0.18 | –7.55 | –7.89 | WN10 | – | 11 |
| 9 | 23:57:40.257 | -32:36:35.08 | 0.55 | 21.12 | 0.01 | –0.22 | 0.03 | 20.29 | 0.01 | –0.79 | 0.14 | 0.00 | –6.84 | –7.67 | WN8 | D11 | 6 |
| 10 | 23:57:40.827 | -32:35:36.48 | 0.40 | 20.17 | 0.07 | 0.03 | 0.13 | 19.29 | 0.05 | –0.65 | 0.30 | 0.133 | –8.18 | –9.14 | WN2–4b | D12 | 6 |
| 11c | 23:57:41.105 | -32:34:50.26 | 0.47 | 20.73 | 0.07 | 0.06 | 0.11 | 20.21 | 0.05 | –0.35 | 0.09 | 0.00 | –7.75 | HII region | D14 | 3 | |
| 11b | 23:57:41.197 | -32:34:50.34 | 0.47 | 20.12 | 0.10 | –0.06 | 0.13 | 20.15 | 0.08 | –0.24 | 0.09 | 0.00 | –7.84 | –7.81 | (WN?) | D14 | 3 |
| 11a | 23:57:41.250 | -32:34:51.19 | 0.46 | 19.20 | 0.08 | 0.07 | 0.13 | 19.38 | 0.04 | –0.22 | 0.06 | 0.00 | –8.76 | –8.58 | HII region | D14 | 3 |
| 12b | 23:57:41.158 | -32:35:50.17 | 0.40 | 20.17 | 0.06 | 0.11 | 0.11 | 20.011 | 0.041 | 0.18 | –8.35 | –8.601 | (not WR?) | D13 | 6 | ||
| 12a | 23:57:41.165 | -32:35:51.11 | 0.40 | 19.57 | 0.09 | –0.09 | 0.12 | 19.08 | 0.05 | –0.31 | 0.11 | 0.18 | –8.95 | –9.53 | (WN?) | D13 | 6 |
| 13 | 23:57:41.340 | -32:35:52.79 | 0.39 | 19.32 | 0.05 | 0.11 | 0.17 | 19.20 | 0.03 | –0.10 | 0.03 | 0.18 | –9.20 | –9.41 | (Not WR?) | D13 | 6 |
| 14 | 23:57:41.417 | -32:35:35.97 | 0.37 | 21.27 | 0.07 | 0.05 | 0.07 | – | – | 0.30 | –7.61 | WC4 | D15 | 6 | |||
| 15 | 23:57:41.738 | -32:37:17.16 | 0.71 | 22.28 | 0.02 | –0.06 | 0.18 | 21.49 | 0.02 | –0.76 | 0.03 | 0.18 | –6.24 | –7.12 | (WN?) | D17 | 11 |
| 16 | 23:57:42.040 | -32:37:15.88 | 0.70 | 21.35 | 0.06 | –0.21 | 0.08 | 20.55 | 0.04 | –0.64 | 0.04 | 0.26 | –7.43 | –8.36 | WN2–4 | D17 | 11 |
| 17 | 23:57:43.254 | -32:35:49.49 | 0.31 | 19.84 | 0.08 | –0.07 | 0.10 | 19.63 | 0.04 | –0.24 | 0.04 | 0.18 | –8.68 | –8.98 | (WN?) | D20 | 6 |
| 18 | 23:57:43.434 | -32:33:38.17 | 0.74 | 22.05 | 0.07 | –0.01 | 0.07 | 21.54 | 0.04 | –0.37 | 0.09 | 0.18 | –6.47 | –7.07 | (WN?) | – | 2 |
| 19b | 23:57:44.072 | -32:36:31.77 | 0.44 | 20.38 | 0.06 | –0.27 | 0.08 | 19.68 | 0.04 | –0.43 | 0.14 | 0.18 | –8.14 | –8.93 | (WN?) | D23 | 11 |
| 19a | 23:57:44.092 | -32:36:32.53 | 0.44 | 19.82 | 0.03 | –0.01 | 0.07 | 19.36 | 0.04 | –0.66 | 0.05 | 0.18 | –8.70 | –9.25 | (WN?) | D23 | 11 |
| 20 | 23:57:44.329 | -32:35:53.13 | 0.27 | 22.50 | 0.05 | –0.04 | 0.18 | 20.98 | 0.02 | –1.51 | 0.03 | 0.18 | –6.02 | –7.63 | WC4 | D25 | 9 |
| 21a | 23:57:44.416 | -32:35:17.09 | 0.25 | 19.64 | 0.11 | 0.35 | 0.15 | 19.70 | 0.04 | –0.17 | 0.23 | 0.18 | –7.85 | –8.59 | (not WR?) | – | 5 |
| 21b | 23:57:44.416 | -32:35:19.87 | 0.24 | 20.89 | 0.04 | –0.10 | 0.01 | 20.02 | 0.07 | –0.17 | 0.18 | 0.18 | –7.63 | –8.11 | (not WR?) | – | 5 |
| 22b | 23:57:44.413 | -32:35:52.01 | 0.27 | 21.512 | 0.072 | 21.161 | 0.071 | 0.18 | –7.192 | –7.441 | HII region | D25 | 9 | ||||
| 22a | 23:57:44.491 | -32:35:51.87 | 0.26 | 20.10 | 0.06 | –0.11 | 0.11 | 19.85 | 0.04 | –0.32 | 0.10 | 0.18 | –8.42 | –8.76 | HII region | D25 | 9 |
| 22c | 23:57:44.588 | -32:35:51.56 | 0.26 | 21.432 | 0.102 | 21.261 | 0.051 | 0.18 | –7.272 | –7.351 | (WN?) | D25 | 9 | ||||
| 23 | 23:57:45.610 | -32:36:56.14 | 0.55 | 23.15 | 0.03 | –0.19 | 0.06 | 21.07 | 0.02 | –2.43 | 0.05 | 0.14 | –5.21 | –7.35 | WC4 | – | 11 |
| 24 | 23:57:46.647 | -32:36:00.28 | 0.24 | 21.90 | 0.02 | 0.11 | 0.03 | 21.18 | 0.02 | –0.77 | 0.05 | 0.18 | –6.62 | –7.43 | WC4 | D36 | 5 |
| 25 | 23:57:46.805 | -32:34:06.49 | 0.50 | 21.81 | 0.04 | –0.06 | 0.05 | 20.44 | 0.03 | –1.09 | 0.05 | 0.18 | –6.71 | –8.17 | WC4 | – | 2 |
| 26 | 23:57:47.049 | -32:35:48.11 | 0.17 | 22.49 | 0.06 | –0.16 | 0.09 | 21.44 | 0.03 | –1.01 | 0.10 | 0.173 | –5.99 | –7.12 | WC4–6 | – | 5 |
| 27 | 23:57:47.868 | -32:34:06.32 | 0.49 | 22.42 | 0.08 | –0.11 | 0.12 | 21.49 | 0.04 | –0.55 | 0.07 | 0.183 | –6.10 | –7.12 | WC4 | D51 | 2 |
| 28 | 23:57:47.933 | -32:33:41.44 | 0.63 | 21.22 | 0.07 | –0.10 | 0.54 | 20.74 | 0.03 | –0.28 | 0.07 | 0.18 | –7.31 | –7.87 | (WN?) | D50 | 2 |
| 29b | 23:57:48.064 | -32:34:29.28 | 0.35 | 19.53 | 0.05 | –0.14 | 0.30 | 19.12 | 0.03 | –0.08 | 0.19 | 0.18 | –8.99 | –9.42 | (not WR?) | D52 | 4 |
| 29a | 23:57:48.184 | -32:34:29.49 | 0.34 | 19.08 | 0.01 | 0.08 | 0.03 | 18.85 | 0.02 | –0.04 | 0.06 | 0.18 | –9.44 | –9.76 | (not WR?) | D52 | 4 |
| 29c | 23:57:47.943 | -32:34:29.45 | 0.35 | 20.43 | 0.07 | 0.09 | 0.13 | 19.90 | 0.05 | –0.16 | 0.09 | 0.18 | –8.09 | –8.71 | (not WR?) | D52 | 4 |
| 29d | 23:57:48.035 | -32:34:31.40 | 0.33 | 20.63 | 0.10 | 0.05 | 0.11 | 20.19 | 0.05 | –0.69 | 0.32 | 0.18 | –7.89 | –8.71 | (WN?) | D52 | 4 |
| 30b | 23:57:48.376 | -32:34:33.60 | 0.32 | 21.01 | 0.09 | –0.10 | 0.14 | 20.55 | 0.05 | –0.55 | 0.09 | 0.18 | –7.51 | –8.06 | (WN?) | D55 | 4 |
| 30a | 23:57:48.479 | -32:34:33.48 | 0.32 | 20.40 | 0.08 | –0.18 | 0.14 | 19.98 | 0.03 | –0.23 | 0.07 | 0.18 | –8.12 | –8.63 | (WN?) | D55 | 4 |
| 31b | 23:57:48.487 | -32:37:01.57 | 0.58 | 20.31 | 0.06 | –0.41 | 0.16 | 19.51 | 0.05 | –0.42 | 0.15 | 0.18 | –8.21 | –9.10 | (WN?) | D53 | 14 |
| 31a | 23:57:48.535 | -32:37:02.62 | 0.59 | 19.75 | 0.05 | –0.31 | 0.15 | 19.33 | 0.04 | –0.22 | 0.05 | 0.18 | –8.77 | –9.28 | (WN?) | D53 | 14 |
| 31c | 23:57:48.665 | -32:37:02.84 | 0.59 | 20.48 | 0.09 | –0.08 | 0.14 | 19.95 | 0.07 | –0.45 | 0.07 | 0.18 | –8.04 | –8.66 | (WN?) | D53 | 14 |
| 32b | 23:57:48.560 | -32:34:46.00 | 0.24 | – | – | 21.13 | 0.05 | –1.19 | 0.08 | 0.18 | –7.48 | (WC?) | D54 | 8 | |||
| 32a | 23:57:48.644 | -32:34:46.86 | 0.23 | 20.94 | 0.10 | 0.00 | 0.12 | 20.84 | 0.03 | +0.13 | 0.06 | 0.18 | –7.57 | –7.77 | (not WR?) | D54 | 8 |
| 33 | 23:57:48.791 | -32:34:35.37 | 0.30 | 19.56 | 0.04 | –0.16 | 0.07 | 19.15 | 0.02 | –0.25 | 0.09 | 0.18 | –8.96 | –9.21 | (WN?) | D55 | 4 |
| 34 | 23:57:48.816 | -32:34:53.27 | 0.19 | 18.07 | 0.01 | –0.21 | 0.01 | 17.72 | 0.01 | –0.18 | 0.24 | 0.323 | –10.88 | –11.39 | WN5–6:WC4 | GHR #3 | 8 |
| 35 | 23:57:48.855 | -32:34:32.86 | 0.31 | 21.57 | 0.09 | 0.01 | 0.46 | 20.61 | 0.04 | –0.59 | 0.16 | 0.093 | –6.66 | –7.66 | WC5–6 | D55 | 4 |
| 36 | 23:57:48.891 | -32:34:57.03 | 0.17 | 20.88 | 0.02 | 0.06 | 0.05 | 20.20 | 0.04 | –0.90 | 0.06 | 0.27 | –4.98 | –8.74 | WC6 | – | 8 |
| 37 | 23:57:48.958 | -32:36:58.16 | 0.56 | 21.22 | 0.08 | 0.00 | 0.12 | 20.43 | 0.08 | –0.74 | 0.10 | 0.13 | –7.16 | –8.00 | WC4–6 | D53 | 14 |
| 38 | 23:57:49.051 | -32:33:32.36 | 0.67 | 22.90 | 0.05 | –0.07 | 0.06 | 21.86 | 0.03 | –0.84 | 0.06 | 0.18 | –5.62 | –6.75 | (WN?) | – | 2 |
| 39 | 23:57:51.522 | -32:35:01.33 | 0.15 | – | – | 20.77 | 0.04 | –0.44 | 0.06 | 0.183 | –7.84 | WN2–4 | D75 | 10 | |||
Table 2 (continued)
ID
RA
Dec
r/
mV
mB–mV
m4684
m4684–m5100
E(B-V)
MV
M4684
Spectral
H ii
Finding
J2000
J2000
mag
mag
mag
mag
mag
mag
mag
Type
region
Chart
40
23:57:52.025
-32:35:21.30
0.12
19.70
0.04
–0.05
0.39
18.98
0.05
–0.56
0.23
0.18
–8.81
–9.63
(WN?)
D82
10
41
23:57:53.045
-32:35:13.44
0.17
21.43
0.05
–0.12
0.09
20.71
0.03
–0.48
0.10
0.18
–7.09
–7.90
(WN?)
D85
10
42b
23:57:53.540
-32:36:42.24
0.54
20.99
0.09
0.22
0.10
20.40
0.04
–0.57
0.07
0.29
–7.86
–8.60
WC4
D88
16
42a
23:57:53.621
-32:36:42.98
0.54
20.65
0.07
–0.03
0.13
20.34
0.03
–0.12
0.17
0.29
–8.20
–8.66
D88
16
43
23:57:53.975
-32:35:15.25
0.21
23.29
0.09
0.16
0.12
21.61
0.03
–1.39
0.12
0.18
–7.00
WC4–6
–
10
44
23:57:54.090
-32:35:46.91
0.28
–
–
22.39
0.11
–1.64
0.14
0.18
–6.22
(WC?)
D91
10
45
23:57:54.122
-32:35:27.83
0.22
–
–
22.11
0.06
–
0.18
–6.50
WC4–6
–
10
46
23:57:54.325
-32:34:00.33
0.51
20.10
0.07
–0.02
0.08
19.48
0.02
–0.78
0.06
0.17
–8.38
–9.09
WC4
D95
7
47
23:57:54.704
-32:35:30.35
0.25
21.04
0.03
–0.32
0.12
19.92
0.03
–0.73
0.06
0.173
–7.44
–8.65
WC6
D97
10
48
23:57:54.849
-32:35:29.64
0.26
20.02
0.02
–0.05
0.12
19.56
0.05
–0.34
0.08
0.18
–8.50
–9.05
(WN?)
D97
10
49
23:57:55.219
-32:33:55.78
0.55
22.12
0.09
0.30
0.10
21.31
0.02
–1.01
0.09
0.18
–6.40
–7.30
WN3
D101
7
50c
23:57:55.838
-32:34:41.75
0.36
–
–
21.22
0.04
–
0.253
–6.41
(WC?)
D106
13
50a
23:57:55.880
-32:34:41.25
0.36
20.90
0.04
–0.04
0.11
20.76
0.03
+0.10
0.05
0.253
–7.84
–7.16
WC4
D106
13
50b
23:57:55.979
-32:34:43.09
0.36
21.22
0.06
–0.17
0.07
20.88
0.03
–0.06
0.05
0.253
–7.52
–7.98
(not WR?)
D106
13
51
23:57:56.310
-32:36:12.84
0.47
22.90
0.07
0.08
0.12
20.89
0.05
–1.19
0.23
0.18
–5.62
–7.72
(WC?)
D109
15
52a
23:57:56.875
-32:33:47.67
0.62
20.04
0.06
–0.04
0.08
19.75
0.03
–0.20
0.07
0.18
–8.48
–8.86
(WN?)
D111
7
52b
23:57:56.919
-32:33:46.60
0.63
20.19
0.05
0.04
0.08
20.05
0.03
–0.09
0.22
0.18
–8.33
–8.56
(not WR?)
D111
7
53
23:57:57.171
-32:36:08.72
0.49
19.70
0.05
–0.19
0.08
19.60
0.02
–0.10
0.35
0.18
–8.82
–9.01
(not WR?)
D110
15
54
23:57:57.205
-32:36:11.12
0.50
20.56
0.06
0.09
0.12
20.21
0.03
–0.40
0.03
0.18
–7.96
–8.40
(WN?)
D110
15
55
23:57:57.649
-32:35:39.16
0.41
23.84
0.08
–0.40
0.12
21.52
0.02
–
0.18
–4.68
–7.09
WC5–6
–
15
56
23:57:57.867
-32:34:50.81
0.41
23.46
0.06
–0.29
0.10
21.79
0.03
–
0.18
–5.06
–6.82
WN2–4
–
13
57
23:57:58.175
-32:35:40.98
0.44
21.96
0.10
0.12
0.10
20.78
0.03
–
0.18
–6.56
–7.83
(WC?)
–
15
58a
23:57:58.548
-32:34:32.92
0.48
20.12
0.07
–0.04
0.14
19.71
0.04
–0.12
0.51
0.18
–8.40
–8.90
(not WR?)
D115
13
58b
23:57:58.602
-32:34:30.72
0.49
20.41
0.07
–0.05
0.11
20.14
0.04
+0.01
0.09
0.18
–8.11
–8.47
(not WR?)
D115
13
59
23:57:58.635
-32:35:46.19
0.47
23.21
0.06
–0.35
0.08
21.50
0.03
–
0.00
–4.75
–6.46
WC6
D116
15
60
23:57:58.929
-32:36:46.90
0.72
–
–
19.02
0.03
–1.35
0.13
0.18
–9.59
(WC?)
D117
18
61a
23:57:59.098
-32:36:50.32
0.74
19.72
0.04
–0.06
0.06
19.52
0.02
–0.09
0.06
0.18
–8.80
–9.09
(not WR?)
D118
18
61b
23:57:59.098
-32:36:48.96
0.74
19.96
0.05
0.00
0.07
19.74
0.03
–0.01
0.04
0.18
–8.56
–8.87
(not WR?)
D118
18
62
23:57:59.560
-32:36:42.42
0.72
22.16
0.05
0.28
0.06
21.41
0.02
–1.11
0.07
0.07
–6.02
–6.81
WN2–4
–
18
63
23:57:59.822
-32:34:23.47
0.55
23.382
0.192
22.04
0.04
–0.50
0.10
0.18
–5.322
–6.57
WN2–4
–
13
64
23:58:00.161
-32:35:33.11
0.51
20.03
0.03
–0.26
0.13
19.41
0.03
–0.09
0.12
0.18
–7.81
–9.20
(not WR?)
D121
15
65
23:58:00.186
-32:33:22.03
0.81
–
–
22.47
0.08
–
0.18
–6.14
(WC?)
–
12
66
23:58:00.222
-32:34:01.40
0.64
–
–
20.26
0.07
–0.27
0.12
0.18
–8.35
(WN?)
–
12
67
23:58:00.239
-32:34:46.21
0.52
21.07
0.06
0.09
0.11
20.66
0.03
–0.23
0.08
0.18
–7.45
–7.95
(WN?)
D127
13
68
23:58:00.511
-32:34:10.54
0.62
20.52
0.06
0.03
0.12
20.12
0.04
–0.21
0.05
0.18
–8.00
-8.49
(WN?)
D124
12
69
23:58:00.718
-32:35:48.95
0.57
20.92
0.05
–0.17
0.05
20.06
0.04
–0.78
0.06
0.15
–7.49
–8.43
WN2–4
–
15
70b
23:58:00.933
-32:33:56.59
0.68
20.63
0.04
–0.21
0.17
20.15
0.04
–0.14
0.08
0.18
–8.36
–8.81
WN2–4
D129
12
70a
23:58:00.984
-32:33:56.22
0.69
20.16
0.04
–0.12
0.14
19.80
0.02
–0.18
0.16
0.18
–7.89
–8.46
D129
12
71
23:58:01.194
-32:33:37.19
0.77
20.31
0.06
–0.06
0.15
20.04
0.05
–0.37
0.08
0.18
–8.21
–8.57
(WN?)
D130
12
72
23:58:01.720
-32:33:46.37
0.75
22.37
0.10
–0.23
0.10
21.17
0.03
–0.77
0.45
0.13
–7.24
WN2–4
D131
12
73a
23:58:06.631
-32:34:53.44
0.79
n/a
n/a
20.21
0.08
–0.25
0.40
0.12
n/a
–8.18
WC4
D132
17
73b
23:58:06.666
-32:34:51.68
0.80
n/a
n/a
19.53
0.04
–1.37
0.05
0.12
n/a
–8.86
(WC?)
D132
17
74a
23:58:06.898
-32:34:56.17
0.81
n/a
n/a
20.82
0.04
–0.39
0.06
0.18
n/a
–7.79
(WN?)
D132
17
74b
23:58:07.005
-32:34:55.94
0.81
n/a
n/a
21.18
0.03
–0.12
0.03
0.18
n/a
–7.43
(not WR?)
D132
17
Q2358–32
23:58:02.881
-32:36:14.03
20.79
0.01
0.20
0.02
20.38
0.01
–0.62
0.08
QSO
–
19
1m5100 photometry
2mB photometry
3Upper limit since weak nebular H emission
2.5 Spectroscopy, Flux Calibration & Slit losses
VLT/FORS1 Multi Object Spectroscopy (MOS) was undertaken in July 2008 with the standard resolution collimator and the 300V grism (dispersion of 3 pixel-1) at a central wavelength of 5850. Spectra were obtained using 0.8 slits resulting in a spectral resolution of 8 , with seeing conditions between 1 and 1.25 . The typical wavelength range of each slit was 3600-9200 however fringing effects made data longward of 7000 unreliable.
Each of the MOS masks that were designed contained 19 slits with lengths ranging from 22 to 26 and used exposure times of 1650 seconds. Due to the spatial distribution of our candidates only 13 slits per mask could be placed on our primary sources. The remaining slits were used to obtain either multiple spectra of a candidate or a HII region. Out of the 74 candidates we obtained spectra of 39 of our WR candidates in Table 2, some containing multiple sub-regions.
Spectroscopic data were bias subtracted and extracted using iraf whilst wavelength and flux calibration were achieved with figaro. Wavelength calibration was achieved from an He HgCdAr arc lamp. Spectrophotometric standard stars LTT 377 (masks #1 & #2) and LTT 1788 (mask #3) (Hamuy et al., 1994, 1992) were used to produce a relative flux calibration whilst an absolute flux calibration was determined from comparison between the synthetic magnitudes and photometry. The sythetic magnitudes were obtained from the convolution of spectra with appropriate filters. This factor corrects our spectroscopic magnitudes for slit losses, which we determine to be 1.490.3.
3 Nebular Analysis
In this section we determine the nebular properties of individual H ii regions in NGC 7793 and determine an average extinction and metallicity. We compare our results to previous work, and discuss the presence of a metallicity gradient in NGC 7793.
| () | ID | 1 | 3 | 4 | 5 | 7a–b | 9 | ||||||
|---|---|---|---|---|---|---|---|---|---|---|---|---|---|
| 3727 | [O ii] | 254 | 306 | 251 | 287 | 547 | 612 | 171 | 199 | 296 | 335 | 154 | 154 |
| 4343 | H | 38 | 42 | 44 | 47 | 43 | 53 | 40 | 43 | 41 | 43 | 53 | 53 |
| 4861 | H | 100 | 100 | 100 | 100 | 100 | 100 | 100 | 100 | 100 | 100 | 100 | 100 |
| 4959 | [O iii] | 45 | 44 | 74 | 73 | 73 | 72 | 92 | 91 | 29 | 29 | 22 | 22 |
| 5007 | [O iii] | 138 | 135 | 221 | 217 | 239 | 236 | 272 | 266 | 86 | 84 | 66 | 66 |
| 6563 | H | 365 | 290 | 340 | 288 | 331 | 288 | 352 | 290 | 338 | 289 | 232 | 192 |
| 6583 | [N ii] | 40 | 31 | 34 | 29 | 72 | 63 | 21 | 17 | 56 | 48 | 41 | 41 |
| 6716 | [S ii] | 27 | 21 | 28 | 23 | 42 | 36 | 15 | 12 | 38 | 32 | 18 | 18 |
| 6731 | [S ii] | 19 | 15 | 20 | 17 | 34 | 29 | 10 | 8 | 27 | 23 | 7 | 7 |
| 4681 | H | 0.901 | 1.85 | 2.92 | 4.89 | 0.104 | 0.161 | 2.08 | 3.80 | 4.39 | 7.15 | 0.308 | 0.308 |
3.1 Interstellar Extinction
70% of the 42 MOS spectra reveal nebular Balmer line emission which we can use to derive the interstellar extinction of the region. Examples are presented in Figure 3. We used the Emission Line Fitting (elf) routine within the starlink package dipso to fit Gaussian profiles to the Balmer lines in the extracted spectra. Using Case B recombination theory (Hummer & Storey, 1987) we assumed an electron density of ne100 cm-3 and temperature Te104K together with a standard Galactic extinction law (Seaton, 1979) to estimate the interstellar extinction from the observed H/H line ratio. Observed and extinction corrected nebular line fluxes are shown for six H ii regions in Table 3, while a complete catalogue of the 29 H ii regions (including the nucleus) is avaliable online.
We note that we do not formally correct for the underlying stellar Balmer line absorption, quantified by McCall (1982) to be of order 2 for H and H. This results in a larger percentage error for nebular lines with a small equivalent width (EW). Mazzarella & Boroson (1993) conclude that the underlying absorption causes their extinction to be overestimated by 15-20%. Our nebular lines have an EW(H) in the range 10-100 so we estimate errors of 2-20% (0.01-0.1 mag) on our E(B-V) values. Sources with larger errors are highlighted in Table 2 with quoted E(B-V) values representing upper limits.
Excluding a few outliers with unphysical extinction measurements, derived values range from the Galactic foreground extinction of E(B-V) = 0.019 mag (Schlegel et al., 1998) to 0.319 magnitudes. The average is E(B-V) = 0.1790.024 magnitudes. Our values are much lower than those found by Chun (1983) who find extinctions in the range E(B-V) = 0.56-0.88 mag. However, they are more consistent with Webster & Smith (1983) who measure c(H)= E(B-V)/0.7 = 0.23–0.61. Unfortunately there are no H ii regions common to all three samples so a direct comparison cannot be made.

3.2 Metallicity
Elemental abundances are best determined from the weak line method described in Osterbrock (1989). This method relies on accurate determination of the temperature of the region from the weak [O iii] 4363 line and is preferable to strong line methods. Unfortunately, the [O iii] 4363 line is marginally detected in only four of the H ii regions observed in our MOS spectra, and moreover the detection is below the 3 level. As a result the errors associated with the derived temperatures are too high to allow reliable abundance determinations and so we resort to strong line methods.
By calculating both the I([N ii] 6584)/I(H) and I([O iii] 5007)/I(H) ratios we can use the N2 and O3N2 indicies derived in Pettini & Pagel (2004) to determine the abundance of H ii regions within NGC 7793 to 0.2 dex. Metallicities of the H ii regions ranges from log(O/H)+12 = 8.19–8.69 with an average value of log(O/H)+12 = 8.440.24 (See Table 4). This is consistent with previous estimates of log(O/H)+12 = 8.54 for NGC 7793 by Pilyugin et al. (2004), but is somewhat lower than log(O/H)+12 = 8.7 quoted in O’Halloran et al. (2006). This difference may be explained by the presence of metallicity gradient of approximately
as shown in Figure 4. Webster & Smith (1983) also found evidence of a metallicity gradient in NGC 7793 with 12+log(O/H) = 8.23–8.96.
| Source | r/R25 | I([NII]) | log(O/H) | I([OIII]) | log(O/H) | log(O/H) |
|---|---|---|---|---|---|---|
| ID | I(H) | + 12 1 | I(H) | + 12 2 | + 12 mean | |
| 1 | 0.88 | 0.109 | 8.35 | 1.35 | 8.38 | 8.37 |
| 3 | 0.95 | 0.100 | 8.33 | 2.18 | 8.30 | 8.32 |
| 4 | 0.62 | 0.218 | 8.52 | 2.36 | 8.40 | 8.46 |
| 6 | 0.65 | 0.059 | 8.20 | 2.66 | 8.20 | 8.20 |
| 7ab | 0.49 | 0.165 | 8.45 | 0.84 | 8.50 | 8.48 |
| 9 | 0.55 | 0.176 | 8.47 | 0.64 | 8.55 | 8.51 |
| 10 | 0.40 | 0.115 | 8.36 | 3.82 | 8.25 | 8.30 |
| 11a-c | 0.46 | 0.164 | 8.45 | 1.46 | 8.43 | 8.44 |
| 14 | 0.37 | 0.067 | 8.23 | 2.24 | 8.24 | 8.24 |
| 16 | 0.70 | 0.088 | 8.30 | 4.18 | 8.19 | 8.25 |
| 20 | 0.27 | 0.399 | 8.67 | – | – | 8.67 |
| 22a-c | 0.27 | 0.116 | 8.37 | 1.56 | 8.37 | 8.37 |
| 23 | 0.55 | 0.166 | 8.46 | 3.26 | 8.32 | 8.39 |
| 26 | 0.17 | 0.459 | 8.71 | 0.68 | 8.68 | 8.69 |
| 27 | 0.49 | 0.220 | 8.53 | 1.42 | 8.47 | 8.50 |
| 34 | 0.19 | 0.256 | 8.56 | 0.97 | 8.55 | 8.55 |
| 35 | 0.31 | 0.280 | 8.58 | 0.94 | 8.56 | 8.57 |
| 36 | 0.17 | 0.233 | 8.54 | 0.74 | 8.57 | 8.56 |
| 37 | 0.56 | 0.145 | 8.42 | 1.37 | 8.42 | 8.42 |
| 39 | 0.15 | 0.158 | 8.44 | – | – | 8.44 |
| 42ab | 0.54 | 0.234 | 8.54 | 1.80 | 8.45 | 8.49 |
| 46 | 0.51 | 0.175 | 8.47 | 1.42 | 8.44 | 8.45 |
| 47 | 0.25 | 0.231 | 8.54 | 0.70 | 8.58 | 8.56 |
| 49 | 0.55 | 0.178 | 8.47 | 5.45 | 8.25 | 8.36 |
| 50a-c | 0.35 | 0.548 | 8.56 | 1.28 | 8.61 | 8.58 |
| 62 | 0.72 | 0.139 | 8.41 | 3.33 | 8.29 | 8.35 |
| 69 | 0.57 | 0.082 | 8.28 | 4.11 | 8.19 | 8.23 |
| Average | 0.19 | 8.440.24 | ||||
| 1 N2 | ||||||
| 2 O3N2 | ||||||

4 The Wolf-Rayet Population of NGC 7793
Wolf-Rayet stars are relatively straightforward to identify and classify from optical spectra due to their strong, broad emission lines. Nitrogen-rich (WN) stars are dominated by He ii 4686, while carbon-rich (WC) stars are dominated by C iii 4650 and C iv 5801–12 and oxygen rich (WO) stars by O vi 3811–34. Individual WC stars possess much larger equivalent widths than WN stars, therefore, allowing for dilution by neighbouring stars (see Section 5.2), this can result in an observational bias towards WC stars (Massey & Johnson, 1998; Crowther et al., 2003).
From our 74 candidate WR regions regions identified from the continuum subtracted 4684 image we obtained spectra of 39. For these sources the He ii/C iii excess ranged from +0.1 to –1.5 mag. From the 39 spectra, 33 revealed WR features ( 3), while 6 showed solely nebular lines. This 85% detection rate is consistent with spectroscopy of NGC 1313 by Hadfield & Crowther (2007) who found 70 of their 82 candidates to exhibit WR features. The sources in NGC 7793 that do not contain WR emission have m4684-m5100= –0.220.1 mag. It is likely that these false candidates arise from the formal photometric errors of 0.1-0.2 mag (see Section 2.3). We note that from the subregions found using higher spatial resolution broad-band imaging we obtained spectra in 43 cases, 35 of which have WR features.
Figure 5 compares the photometric He ii excess to the spectroscopic excess for all of our spectroscopic sources. The spectroscopic excess was calculated from the convolution of sythetic spectra with appropriate narrow band filters. Outliers from the trend indicate that the magnitude derived from photometry is unreliable. There is reasonable agreement with the exception of sources # 50a owing to severe crowding.

Using the dipso emission line fitting (elf) routine, the flux and FWHM of the emission lines could be measured these are presented in Table 5. Typical errors on the line flux measurements were 5% for strong lines such as HeII 4686 and CIV 5808, but were significantly higher, 20%, for weaker lines such as NV 4603 and HeII 5411. Given the similar metallicity of NGC 7793 to the LMC we use line fluxes of LMC WR stars found in Crowther & Hadfield (2006) as a comparison to assess the number of WR stars in each source. A larger WR population would be inferred from SMC WR line luminosities, while the reverse would be the case using Milky Way templates.

4.1 WN Subtypes
Using the classification scheme derived by Smith et al. (1996) we can divide WN stars into early (WNE, WN2–4), mid (WN5–6) and late (WNL, WN7–9) categories, which are dominated by N v 4603–20, N iv 4058 + N iii 4636–4641 and N iii 4634–41 respectively. If only HeII 4686 was detected we assumed a WNE subtype based on the broad line emission (FWHM(WNE)=20–60), relative to narrower emission line (FWHM(WNL)20) seen in late-type WR stars (Crowther & Smith, 1997). From comparison with WR luminosities in the LMC (Crowther & Hadfield, 2006) we can estimate the number of WN stars that are responsible for the HeII 4686 emission. Figure 6 a) and b) show examples of WNE and WNL stars in NGC 7793, respectively, together with the spectra of template stars in the LMC. From all our spectra we estimate 27 WN stars present within 13 regions (14 subregions), of which the majority (80%) are WNE stars, which is a similar fraction to the LMC (Breysacher et al., 1999).
4.2 WC Subtypes
The larger equivalent width of emission lines in WC stars make them easier to detect compared to WN stars (Massey & Johnson, 1998). Smith et al. (1990) produced a quantitative classification scheme for WC stars based on the de-reddened line flux ratio of C iv 5808/C iii 5696 and C iii 5696/O v 5590. This was further refined by Crowther et al. (1998) whose subtype classification we use here. For sources #36, #47 and #59 we determine a WC6 subtype, for other sources where C iii 5696 is present the detection is below the 3 level. Hence we cannot determine a more accurate subtype than WC4–6 in such cases. No late type WC stars are found in NGC 7793, again consistent with the LMC (Breysacher et al., 1999) and other metal-poor galaxies.
Figures 6 c) and d) show examples of a WC4 and WC6 spectra respectively, and are again compared to LMC template WR stars from Crowther & Hadfield (2006). The WC stars lie within bright regions arising from unrelated OB stars in the source. We estimate a total of 25 WC stars from 20 sources spectroscopically observed.
4.3 Composite WN and WC spectra
Of the 33 regions displaying WR signatures only source #34 displays the spectral signature of both WN and WC stars. In view of the large H flux of this region, which corresponds to 20 O7V stars (GHR #3; Table 7), we shall assume the WN stars present are WN5-6 stars since this subtype is seen to dominate in young bright H ii regions (Crowther & Dessart, 1998). From spectral line fitting, using LMC template stars we estimate that 3 WN5–6 and 3 WC4 stars are located in this region as shown in Figure 7. In total, from spectroscopy we find 52 WR stars in NGC 7793, 10% of which are located within the region of candidate #34 (See Section 8).
4.4 WC Line Widths
Schild et al. (1990) have studied the WC content of M33 revealing a correlation between line width (C iv 5808 FWHM) and galactocentric distance (r/R25), supported by results of CFHT spectroscopy in Abbott et al. (2004). In Figure 8 we re-produce figure 6 from Abbott et al. (2004) together with unpublished M33 WHT/WYFFOS data taken in August 1998, plus our own NGC 7793 observations. Indeed, there is a deficit of broad-lined WC4–6 stars at low galactocentric distances.
The combined sample of WC stars, in M33 and NGC 7793, possess stronger winds in the moderately metal-rich inner, compared to the metal-poor outer regions. Crowther et al. (2002) argued that the difference between WC subtypes in metal-poor and metal-rich galaxies was metallicity-dependent winds. Metal-poor regions in galaxies exhibit (broad-lined) WC4 stars while metal-rich regions possess (narrow-lined) WC8–9 stars. In between these extremes the dominant subtype would naturally be WC6 subtypes as is the case for the inner regions of NGC 7793 and M33. We would expect broad line sources to have fast winds which is not consistent with their metal-poor location. The physical explanantion behind this apparent anti-correlation of metallicity and wind velocity is not understood.
For the WCE stars, there appears to be a correlation between the FWHM of C iv 5808 and the relative strength of the C iv 5808/C iii 4650 lines, with narrower lines having weaker C iv 5808. The WC4–6 stars in NGC 7793 appear to span a larger range than the WC4 stars in the LMC (Crowther & Hadfield, 2006). This is presented in Figure 9 and would be a natural consequence of somewhat later (WC5–6) subtypes for most NGC 7793 WC stars.
| Fλ( erg s-1 cm-2) | Lλ( erg s-1 ) | |||||||||
| Source | F(N v/N iii) | F(C iii) | F(He ii) | F(He ii) | F(C iii) | F(C iv) | L(He ii) | L(C iv) | WR Subtype | N(WR) |
| 4603-4641 | 4647-4651 | 4686 | 5411 | 5696 | 5808 | 4686 | 5808 | |||
| # 4 | – | 8.95 | – | – | – | 4.54 | – | 1.17 | WC4–6 | 1 |
| # 8 | – | 2.46 | – | – | – | 0.84 | – | WN10 | 1 | |
| # 9 | 4.07 | – | 8.00 | 0.70 | – | – | 2.72 | – | WN8 | 4 |
| # 10 | 1.52 | – | 12.7 | 1.78 | – | – | 4.14 | – | WN2–4b | 4 |
| # 14 | – | 5.73 | – | – | – | 4.51 | – | 1.82 | WC4 | 1 |
| # 16 | – | – | 6.03 | – | – | – | 2.77 | – | WN2–4 | 3 |
| # 20 | – | 12.04 | – | – | – | 7.56 | – | 2.22 | WC4 | 1 |
| # 23 | – | 11.59 | – | – | – | 5.81 | – | 1.49 | WC4 | 1 |
| # 24 | – | 11.2 | – | – | (0.84) | 3.46 | – | 0.97 | WC4 | 1 |
| # 25 | – | 2.27 | – | – | – | 1.55 | – | 0.46 | WC4 | 1 |
| # 26 | – | 4.14 | – | – | (0.30) | 1.52 | – | 0.43 | WC4–6 | 1 |
| # 27 | – | 4.53 | – | – | – | 3.77 | – | 1.11 | WC4 | 1 |
| # 34 | (5.87) | 19.0 | – | – | 19.8 | 10.5 | 8.43 | WN5–6:WC4 | 3:3 | |
| # 35 | – | 4.43 | – | – | – | 2.08 | – | 0.48 | WC5–6 | 1 |
| # 36 | – | 14.21 | – | – | 0.98 | 7.15 | – | 2.68 | WC6 | 1 |
| # 37 | – | 15.43 | – | – | (0.30) | 7.87 | – | 2.03 | WC4–6 | 1 |
| # 39 | – | – | 3.17 | – | – | – | 1.08 | – | WN2–4 | 2 |
| # 42ab | – | 13.90 | – | – | – | 11.7 | – | 4.59 | WC4 | 2 |
| # 43 | – | 7.25 | – | – | (0.20) | 3.25 | – | 0.95 | WC4–6 | 1 |
| # 45 | – | 4.38 | – | – | (0.37) | 2.17 | – | 0.64 | WC4–6 | 1 |
| # 46 | – | 35.56 | – | – | – | 12.7 | – | 3.22 | WC4 | 2 |
| # 47 | – | 18.94 | – | – | 0.38 | 7.23 | – | 2.03 | WC6 | 1 |
| # 49 | 0.62 | – | 4.73 | 6.06 | – | – | 1.61 | – | WN3 | 2 |
| # 50a | – | 6.85 | – | – | – | 3.62 | – | 1.28 | WC4 | 1 |
| # 55 | – | 6.57 | 2.35 | – | – | 3.67 | – | 1.08 | WC5–6 | 1 |
| # 56 | 1.39 | – | 1.27 | 0.66 | – | – | 0.43 | – | WN2–4 | 1 |
| # 59 | – | 5.76 | – | – | 0.33 | 4.14 | – | 1.21 | WC6 | 1 |
| # 62 | – | – | 6.10 | 0.69 | – | – | 1.43 | – | WN2–4 | 2 |
| # 63 | – | – | 2.65 | 0.34 | – | 0.87 | 0.18 | 0.26 | WN2–4 | 1 |
| # 69 | 0.87 | – | 4.77 | – | – | – | 1.44 | – | WN2–4 | 2 |
| # 70ab | – | – | 1.56 | – | – | – | 0.53 | – | WN2–4 | 1 |
| # 72 | 0.36 | – | 1.33 | – | – | – | 0.74 | – | WN2–4 | 1 |
| # 73a | – | 13.93 | – | – | – | 4.44 | – | 1.11 | WC4 | 1 |


5 Comparison of VLT and HST data
In this section we consider the advantages of space-based observations in identifying WR sources in galaxies beyond the Local Group. We consider the case of the LMC to assess what fraction of known LMC WR stars would have been detected at the distance of NGC 7793.
5.1 Spatial Resolution
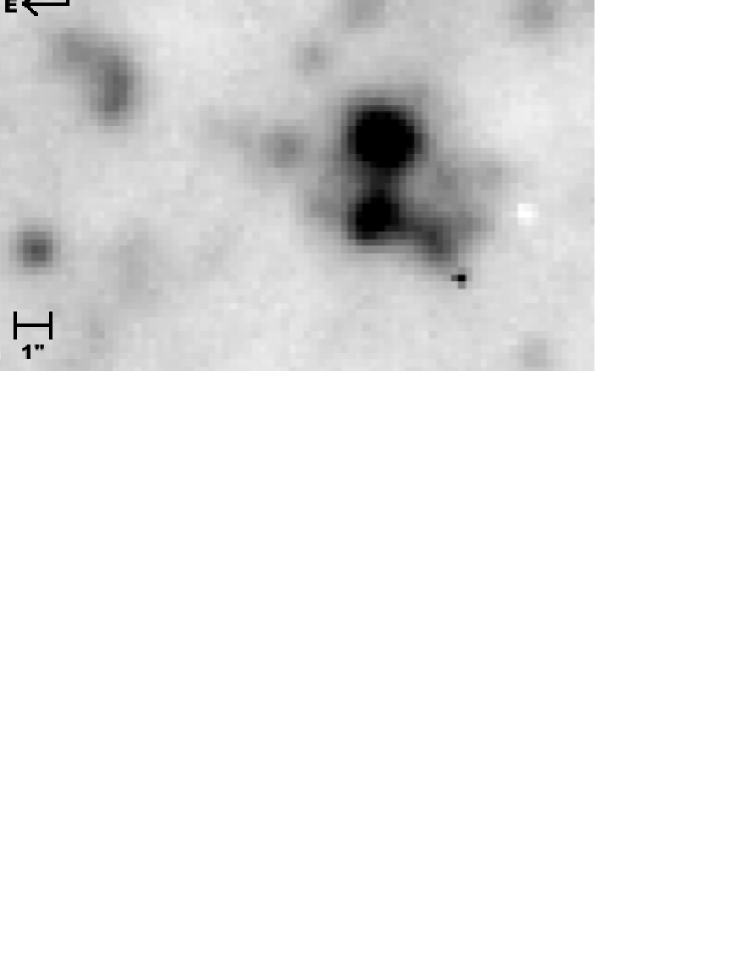
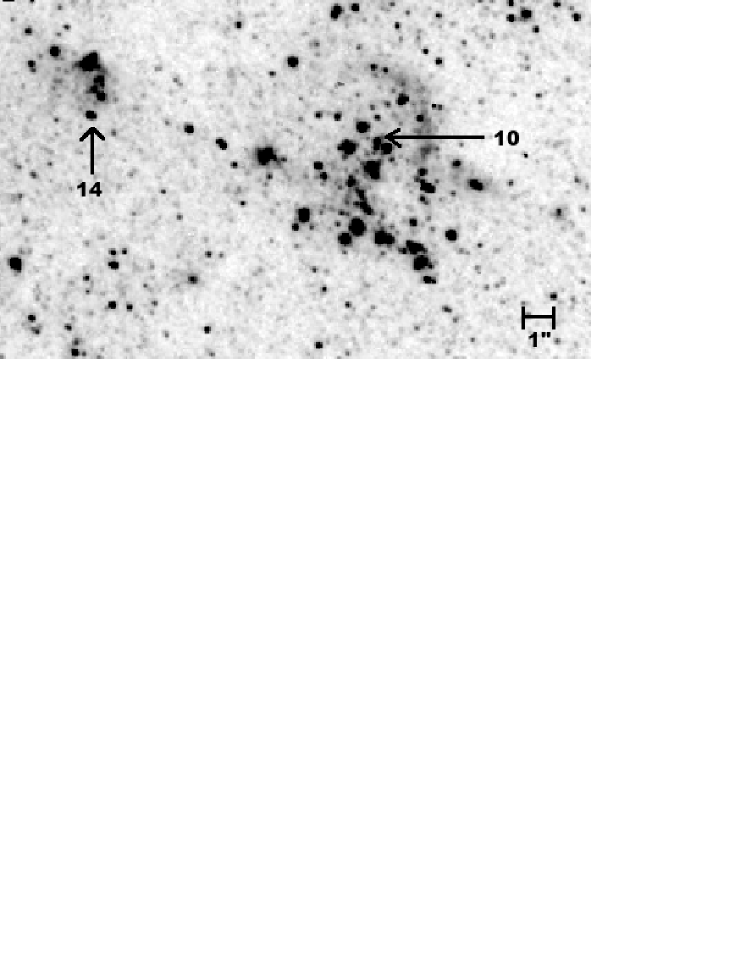
33 of our 39 spectra showed WR features for which we have obtained photometry from ground-based VLT images. However, crowding and the spatial resolution of He ii ground-based images cause these sources to be contaminated by stars along similar lines of sight, or stars within the same cluster. For NGC 7793 at a distance of 3.91 Mpc (Karachentsev et al., 2003) the spatial resolution of our ground-based He ii images is 1.3 corresponding to a physical scale of 25pc compared to 0.1 resolution, or 2pc, with HST. The dramatic improvement of space-based images is demonstrated in Figure 10. We can take advantage of archival HST imaging of NGC 7793 (Section 2.2) to more accurately locate the WR source and determine a more robust magnitude. Unfortunately, not all of NGC 7793 has been observed with ACS/WFC using the F555W filter. 10 of our candidates lie within the ACS pointing (recall Figure 1).
We are able to spatially resolve the WR source for 6 of the 10 cases using offsets from nearby point sources to the peak of the He ii emission identified from the archival VLT images. Two examples are shown in Figure 10. Table 6 shows that the measured HST magnitudes for 5 WR soruces are 0.4-1.4 magnitudes fainter, arising from severe crowding in the VLT images. Source #36 was not identified by daophot in the VLT V-band image, although a HST magnitude can be determined. Sources #8 and #34 can only be partially resolved from the compact host cluster in the HST image, making little difference to the observed magnitude. The final two WR sources (#24 and #26) are located in dense clusters, so despite the superior spatial resolution of HST, we cannot identify the individual WR source. If HST/ACS F555W imaging were available for all 74 sources in NGC 7793, magnitudes would typically be 10.5 mag fainter than those quoted in Table 2.
| ID | RA | Dec | mV | mF555W | mF555W-mV |
| J2000 | J2000 | mag | mag | mag | |
| # 4 | 23:57:37.133 | -32:35:01.33 | 22.48 | 23.91 | 1.43 |
| # 8 | 23:57:39.550 | -32:37:24.32 | 20.97 | 20.78 | –0.19* |
| # 10 | 23:57:40.809 | -32:35:36.21 | 20.18 | 21.43 | 1.25 |
| # 14 | 23:57:41.421 | -32:35:35.49 | 21.27 | 22.28 | 1.01 |
| # 20 | 23:57:45.325 | -32:36:05.17 | 22.50 | 22.90 | 0.4 |
| # 24 | 23:57:46.647 | -32:36:00.28 | 21.99 | – | – |
| # 25 | 23:57:46.787 | -32:34:05.80 | 21.81 | 22.60 | 0.79 |
| # 26 | 23:57:47.049 | -32:35:48.11 | 22.49 | – | – |
| # 34 | 23:57:48.830 | -32:34:53.10 | 18.07 | 18.09 | 0.02* |
| # 36 | 23:57:49.037 | -32:34:57.41 | – | 23.10 | – |
| * WR source only partially resolved from host cluster | |||||
| WR source is not resolved from host cluster | |||||


5.2 Completeness compared to the LMC
We can investigate the completeness of our NGC 7793 survey by degrading observations of a nearby galaxy, that has been completely surveyed for WR stars, to the required resolution. We use ground-based DSS 111The Digitized Sky Surveys were produced at the Space Telescope Science Institute under U.S. Government grant NAG W-2166. The images of these surveys are based on photographic data obtained using the Oschin Schmidt Telescope on Palomar Mountain and the UK Schmidt Telescope. The plates were processed into the present compressed digital form with the permission of these institutions. images of the LMC, which lies at a distance of 50 kpc (Gibson, 2000), to assess the role played by nearby sources on the detection limit for WR stars for a sample of the LMC WR stars listed in Breysacher et al. (1999).
Figure 11 shows the distribution of M4684 and m4781-m4684 for WR stars in the LMC. Typical broad-band magnitudes of single LMC WR stars are MV = –3 to –7 mag.We have obtained synthetic narrow-band magnitudes for LMC WR stars from spectrophotometric observations of Crowther & Hadfield (2006) and Torres-Dodgen & Massey (1988). We find m4781-m4684 = 0.1–1.8 mag for WN stars and 0.4–2.4 mag for WC stars. WR sources exceeding M4684 = –9 mag are clusters containing both O stars and WR stars. For example R136 (Brey 82) is the youngest, brightest cluster in the LMC (Massey & Hunter, 1998), Brey 34 is a WN star with a B supergiant companion (Dopita et al., 1994), whilst Brey 65 is a star cluster hosting a WN star (Walborn et al., 1999). The He ii emission from the WR stars within these clusters/binaries has been severely diluted by the companion stars, hence a relatively small excess is detected. Nevertheless, the majority of the WR stars detected in the LMC can be resolved into single stars.
However, if the LMC were located at a similar distance to NGC 7793, then a higher percentage of the WR sources would be blended with the surrounding stars if they were observed at the same spatial resolution as our archival VLT/FORS imaging. Would the WR emission still be observed, or would it be diluted by surrounding stars to the point that it was no longer detectable?
To address this question we consider the location of a representative sample of 15 WR stars in the LMC to investigate the effect of a degraded resolution. 1 arcsecond corresponds to a spatial scale of 0.25pc at the distance of the LMC versus 20pc for NGC 7793. We have used DSS images to determine how the photometric properties would alter if the surrounding stars were combined with the WR star.
Figure 11 shows the resulting photometry of the He ii excess and absolute magnitude of this subset of WR stars in the LMC at a distance of 4 Mpc. The solid lines indicate the shift of the WR stars to the lower right of the figure. Taking into account our formal completeness limit of M–5.8 mag for NGC 7793, and assuming that we include only sources with M4781-M46840.1 mag we would detect at least 80% of the WR stars in the LMC in our VLT imaging survey. Moreover, our 50% detection limit includes all but one of the LMC WR stars in our sample. Figure 11 also shows that there is a bias towards WC stars (Massey & Johnson, 1998), such that we would most likely have detected the overwhelmingly majority of the LMC WC stars at 4 Mpc (See Section 8). Figure 11 shows the photometric absolute magnitude and He ii excess emission for the WR sources in NGC 7793, with the diagonal line representing the 50% and 100% completeness limits (recall Section 2.3).
6 Giant H ii regions
NGC 7793 contains 132 catalogued H ii regions (Davoust & de Vaucouleurs, 1980). Using appropriate aperture radii (rap), we have measured the net H flux for the brightest H ii regions, limiting our sample to those which exceed Q1050 photon s-1, formally defined as giant H ii regions (GHR) in Conti et al. (2008). From comparison with the CTIO images used in Kennicutt et al. (2008) there are 4 additional giant H ii regions in NGC 7793 beyond the field of view of our VLT imaging (recall Figure 1). Two of these are listed in the Davoust & de Vaucouleurs (1980) catalogue as D47 and D132, while the other two have not been discussed. We add the location of the two other four GHRs to Table 7 as GHR A, B, C and D.
H fluxes estimated from observations using the H narrow-band filter are contaminated by the [N ii] 6583 emission, and to a lesser degree by [N ii] 6548. To correct for this we have determined the [N ii] 6583 contribution from our spectroscopic data, or adopt an average value of I([N ii] 6583)/I(H)=0.19 otherwise. 97% of our I([N ii] 6583)/I(H) values are within 1 (0.2) of the mean value. Webster & Smith (1983) obtain a mean value I[N ii] 6583/I(H) = 0.23 from spectroscopy of H ii regions, while McCall et al. (1985) find a higher mean value of I([N ii] 6583)/I(H)=0.35 from the average of only 3 H ii regions. After subtracting the continuum, observed fluxes were extinction corrected. Table 7 lists values of E(B-V) and I([N ii] 6583)/I(H) for each source.
We have calculated a H luminosity of 3.301040erg s-1 or a Star Formation Rate (SFR)0.26 M⊙yr-1 (using equation 2 in Kennicutt 1998) for the region surveyed with FORS1 (recall Figure 1). A more accurate value for the whole galaxy can be made by applying our mean values of E(B-V) and I([N ii] 6583)/I(H) to the observed (H+[N ii] 6583) flux of Kennicutt et al. (2008). The revised SFR = 0.45 M⊙yr-1, 50% larger than their SFR0.30 M⊙yr-1, suggesting that emission beyond our H survey contributes 40% of the total. We note that young H ii regions could be visibly obscured, increasing the global SFR. However, NGC 7793 is included in the SINGS survey (Kennicutt et al., 2003), for which Prescott et al. (2007) concluded that NGC 7793 has no highly obscured bright H ii regions. Therefore, the H–derived SFR should reflect the true value.
| ID | RA | Dec | r | E(B-V) | I[N ii]/I(H) | F(H) | L(H) | log Q0 | N(O7V) | HII | WR |
| J2000 | J2000 | arcsec | mag | erg s-1 cm-2 | erg s-1 | s-1 | region | ||||
| GHR | 23:57:41.166 | -32:35:50.89 | 6.25 | 0.179 | 0.19 | 1.8010-13 | 5.001038 | 50.57 | 37 | D13 | 12ab |
| GHR | 23:57:41.237 | -32:34:51.45 | 3.75 | 0.179 | 0.16 | 1.4010-13 | 3.891038 | 50.46 | 29 | D14 | 11a–c |
| GHR | 23:57:48.889 | -32:34:53.13 | 3.00 | 0.319 | 0.26 | 8.2410-14 | 3.171038 | 50.37 | 23 | – | 343 |
| GHR | 23:57:54.250 | -32:33:59.78 | 4.75 | 0.242 | 0.18 | 9.6010-14 | 3.091038 | 50.36 | 23 | D95 | 463 |
| GHR | 23:57:43.271 | -32:35:49.90 | 4.75 | 0.179 | 0.19 | 1.0310-13 | 2.861038 | 50.33 | 21 | D20 | 17 |
| GHR | 23:57:46.711 | -32:36:06.69 | 3.50 | 0.179 | 0.19 | 9.2710-14 | 2.581038 | 50.28 | 19 | D36 | – |
| GHR | 23:57:57.041 | -32:36:08.62 | 4.50 | 0.179 | 0.19 | 8.5510-14 | 2.381038 | 50.25 | 18 | D110 | 53 |
| GHR | 23:57:56.968 | -32:33:48.35 | 4.25 | 0.179 | 0.19 | 8.0810-14 | 2.251038 | 50.22 | 17 | D111 | 52ab |
| GHR | 23:57:50.798 | -32:34:17.55 | 4.25 | 0.179 | 0.19 | 7.7210-14 | 2.151038 | 50.20 | 16 | D73 | – |
| GHR | 23:57:41.416 | -32:35:34.74 | 2.75 | 0.298 | 0.07 | 5.1510-14 | 1.891038 | 50.15 | 14 | D15 | 143 |
| GHR | 23:57:48.209 | -32:36:15.03 | 2.50 | 0.179 | 0.19 | 6.6410-14 | 1.851038 | 50.14 | 14 | D49 | – |
| GHR | 23:57:51.194 | -32:36:48.75 | 2.75 | 0.179 | 0.19 | 5.7610-14 | 1.601038 | 50.07 | 12 | D74 | – |
| GHR | 23:57:44.744 | -32:34:24.99 | 2.75 | 0.179 | 0.19 | 5.6810-14 | 1.581038 | 50.07 | 12 | D27 | – |
| GHR | 23:57:44.494 | -32:35:52.03 | 3.00 | 0.119 | 0.12 | 6.5010-14 | 1.571038 | 50.07 | 12 | D25 | 22a–c |
| GHR | 23:57:48.391 | -32:34:34.25 | 3.00 | 0.179 | 0.19 | 4.9310-14 | 1.371038 | 50.01 | 10 | D55 | 30ab |
| GHR A | 23:57:48.000 | -32:33:04.10 | D47 | – | |||||||
| GHR B | 23:58:06.730 | -32:34:58.00 | D132 | 73ab | |||||||
| GHR C | 23:57:59.967 | -32:33:23.84 | – | ||||||||
| GHR D | 23:58:08.807 | -32:36:47.68 | – | ||||||||
| H survey (This study) | 205.7 | 0.179 | 0.19 | 1.1810-11 | 3.301040 | 52.39 | 2440 | SFR = 0.26 M⊙yr-1 | |||
| H survey (Kennicutt et al. 2008) | 0.179 | 0.19 | 2.0410-11 | 5.651040 | 52.62 | 4180 | SFR = 0.45 M⊙yr-1 | ||||
| 1 Aperture radius | |||||||||||
7 A background quasar: Q2358-32
Follow-up MOS spectroscopy of one candidate emission line source displaying a large excess of m4684-m5100 = –0.62 mag failed to match that expected for a WR star. This source, for which mV=20.79 mag, was revealed instead to be a background quasar at 2.02 in which C iv 1548–51 has been redshifted into the 4684 narrow-band filter. The quasar spectrum is presented in Fig. 12, which we name Q2358-32.
NGC 7793 has been observed with the X-ray telescope aboard ROSAT (Read & Pietsch, 1999). From this survey the published coordinates of X-ray point source P11 lies 20 arcsec from Q2358-32. Although this source has a formal positional error of only 13 arcsec, P11 could plausibly arise from Q2358-32 from inspection of figure 1 in Read & Pietsch (1999).
A number of quasars located behind nearby spiral galaxies are known, including a = 2.55 quasar towards NGC 1365 by Bresolin et al. (2005). These have previously been used to investigate the nature of the interstellar medium of the spiral galaxy using the Ca ii H and K lines - see Pettini & Boksenberg (1985) and Hintzen et al. (1990). Unfortunately, in the case of Q2358-32 these lines fall on the redshifted Lyman QSO emission line, hence we are unable to calculate the column density of the absorbing gas in this instance (Bowen, 1991).

8 Global WR population of NGC 7793 with Comparison to NGC 300.
8.1 Global WR population of NGC 7793
We confirm the presence of 27 WN and 25 WC stars in NGC 7793 from spectroscopic observations (Table 2). However to estimate the global number of WR stars in NGC 7793 we may use (a) our narrow-band photometry of remaining candidates and (b) our comparison with the LMC WR population.
We photometrically classify remaining WR candidates in NGC 7793 as follows, on the basis of the distribution of LMC WR stars in Figure 11. We shall assume that sources with m5100-m4684+1 mag are WC subtypes, those for which +0.2m5100-m+1 mag are WN stars, with the remainder either foreground or weak emission-line sources. In reality there will be instances of WC, WN and spurious candidates in different magnitude bins, but outliers should be relatively few in number. In addition, we uniformly assume that photometric sources host a solitary WR star. A total of 27 WN and 8 WC candidates are added to the census in this way, listed in parentheses in Table 2, suggesting 54 WN and 33 WC stars in total.
Finally, we need to consider the completeness limit of our imaging survey. We estimate that 90% of the WC stars in the region of NGC 7793 surveyed would have been detected, plus 80% of the WN stars, on the basis that their intrinsic properties are similar to those in the LMC. Adjusting the WR populations for this effect, we arrive at a total of 68 WN and 37 WC stars, with N(WC)/N(WN)0.5 and N(WR)=105 in total. Our spectroscopic survey has therefore recovered 67% of the estimated WC population and 40% of the estimated WN population. Using the revised global star formation rate from Sect. 6 we obtain N(WR)/N(O7 V)0.025.
8.2 Comparison between WR populations of NGC 7793 and NGC 300
Wolf-Rayet surveys have been conducted within both Local Group galaxies (Massey & Johnson, 1998) and beyond. Of those non-Local Group spiral galaxies forming the basis of our supernova progenitor survey, M83 is metal-rich (Hadfield et al., 2005), NGC 1313 is metal-poor (Hadfield & Crowther, 2007), leaving the central region of NGC 300 surveyed by Schild et al. (2003) as the ideal comparison galaxy to the present survey of NGC 7793.
NGC 300 is another Sculptor group SA(s)d spiral galaxy, albeit a factor of two closer (Gieren et al., 2005). Basic global properties of NGC 300 and NGC 7793 are provided in Table LABEL:ngc300, indicating similar physical sizes and metallicity gradients, although NGC 7793 possesses a factor of four higher star formation rate (Sect. 6). We also provide a comparison between the WR census of the central region of NGC 300 and the present study. 30 of the 58 WR candidates identified by Schild et al. (2003) have been spectroscopically confirmed by references therein or Crowther et al. (2007). In addition, Crowther et al. (2010) have recently obtained additional MOS spectroscopy of NGC 300 from which 5 additional WR stars are revealed (#7, #10, #21, #37 and #54), to which we add the confirmation of a very late WN star discovered by Bresolin et al. (2009), bringing the total to 20 WN and 17 WC stars, including a couple of composite WN+WC systems (#11, #37). We set a slightly lower 4684 excess threshold of m4781-m4684 = +0.15 mag for the remaining photometric candidates in NGC 300 as a result of an improved photometric precision and slightly different continuum filter. Six additional photometric WN stars follow. These bring the total WR census of the inner disk of NGC 300 to N(WR)43, comprising 26 WN and 17 WC stars, or N(WC)/N(WN)0.65.
Regarding the O star content of the central region of NGC 300, Crowther et al. (2007) estimated that the WR survey region included 78% of the 0.12 yr-1 global star formation rate of NGC 300 (Kennicutt et al., 2008). Therefore, N(WR)/N(O7V)0.05, a factor of two higher than NGC 7793. Indeed the surface density of WR stars in the central region of NGC 300 is also a factor of two higher than the entire disk of NGC 7793. This difference may originate in part from the slightly higher metallicity of the inner region of NGC 300, namely (O/H) + 12 8.5, versus an average value of 8.4 for NGC 7793.
| Name | NGC 300 | NGC 7793 |
|---|---|---|
| Hubble Type | SA(s)d | SA(s)d |
| Distance (Mpc) | 1.88a | 3.91h |
| (arcmin) | 10.9b | 4.65b |
| R25 (kpc) | 5.3b | 5.3b |
| SFR (M⊙yr-1) | 0.12d | 0.45d,i |
| log(O/H) + 12 (centre) | 8.57e | 8.61i |
| Gradient∗ (dex kpc-1) | –0.08f | –0.07i |
| Survey region (kpc) | 3.7 3.7c | 9.3 7.3i |
| N(O7V) | 870i | 4200d,i |
| N(O) | 1300i | 6250d,i |
| (O/H)+12 (mean) | 8.5e | 8.4i |
| WR candidates | 58cf | 74i |
| N(WN) | 20 (26)cfgj | 27 (68)i |
| N(WC) | 17 (17)cfgj | 25 (37)i |
| N(WC)/N(WN) | 0.85 (0.65)i | 0.93 (0.55)i |
| N(WR)/N(O) | 0.028 (0.033)i | 0.008 (0.017)i |
| Surface density∗ (WR kpc-2) | 2.7 (3.1)i | 0.77 (1.6)i |
| a Gieren et al. (2005), b de Vaucouleurs et al. (1991), c Schild et al. (2003) | ||
| d Kennicutt et al. (2008), e Urbaneja et al. (2005), f Bresolin et al. (2009) | ||
| g Crowther et al. (2007), h Karachentsev et al. (2003), i This work | ||
| j Crowther et al. (2010) | ||
8.3 Comparison with evolutionary models
Observations of WR stars in the Local Group have revealed a strong correlation between the ratio of WC to WN stars and WR to O stars as a function of metallicity (Massey, 1996). In Figure 13 we provide an updated comparison of N(WC)/N(WN) including spectroscopic and photometry results from our galaxy surveys to date, plus the photometric results of Massey & Holmes (2002). Model predictions are shown from initially rotating (300 km s-1) single star models of Meynet & Maeder (2005) plus single and binary models incorporating metallicity-dependent WR winds from Eldridge & Vink (2006). The latter provides a reasonable match to empirical results, although highlights differences between the metal-poor dwarf spiral galaxies (including NGC 7793) and dwarf irregular galaxies (including the LMC).
In order to compare the ratio of WR to O stars with evolutionary predictions, it is necessary to first calculate the number of equivalent O7V stars from nebular H luminosities, and then attempt to convert this quantity into actual O stars. For the LMC and SMC we utilise nebular properties from Kennicutt et al. (1995), with H luminosities from Lee et al. (2009) used, with the exceptions of IC 10 (Gil de Paz et al., 2003), NGC 300 and NGC 7793 (recall Section 8.2). These are converted into the number of equivalent O7V stars using equation 2 from Kennicutt (1998) and = 1049 s-1 for O7V stars.


For an instantaneous burst of star formation, N(O)/N(O7V)0.7–2 for the first 4 Myr at LMC metallicity (Schaerer & Vacca, 1998). For continuous star formation, as is the case for galaxies in our sample, we have estimated the conversion factors in two ways. There are 1000 O stars in the SMC according to Evans et al. (2004), suggesting N(O)/N(O7V)2 from its global H derived star-formation rate. For the 30 Doradus region of the LMC, the recent VLT-FLAMES Tarantula survey (Evans et al., 2010) reveals 400 O stars excluding the central R136 ionizing cluster (Crowther & Dessart, 1998). 30 Doradus provides a total Lyman continuum ionizing flux of s-1, of which 40% is supplied by R136, suggesting N(O)/N(O7V)0.7 from 30 Doradus (omitting R136). Figure 13 compares the WR to O ratio for galaxies within our survey and results from the literature (Massey, 1996) applying a uniform correction of N(O)/N(O7V)1.5 for the whole sample. Once again, evolutionary predictions from Eldridge & Vink (2006) and Meynet & Maeder (2005) are included, with reasonable agreement found for both, albeit highlighting the relatively low WR to O ratio for NGC 7793.
9 Summary
We present the results of a VLT/FORS1 imaging and spectroscopic survey of the WR population of the Sculptor group spiral galaxy NGC 7793.
-
1.
From archival narrow-band imaging, we identify 74 candidate emission line regions, of which 39 have been spectroscopically observed with the Multi Object Spectroscopy (MOS) mode of FORS1. Of these, 85% of these sources exhibited WR features above a 3 level. Additional slits were used to observe H ii regions, enabling an estimate of the metallicity gradient of NGC 7793 using strong line calibrations, from which (O/H) + 12 = 8.61 0.05 - (0.36 0.10) r/R25 was obtained. We have estimated WR populations using a calibration of line luminosities of Large Magellanic Cloud stars, revealing 27 WN and 25 WC stars for sources spectroscopically observed.
-
2.
Photometric properties of the remaining candidates suggest an additional 27 WN and 8 WC stars. In addition, a comparison with LMC WR stars degraded to the spatial resolution achieved for NGC 7793 suggests that our imaging survey has identified 80% of WN stars and 90% for the WC subclass, from which a total of 68 WN and 37 WC stars are inferred within NGC 7793, i.e. N(WC)/N(WN)0.5
-
3.
Our H ii region spectroscopy permits an updated star formation rate of 0.45 yr-1 with respect to Kennicutt et al. (2008), from which N(WR)/N(O)0.017 is obtained, assuming N(O)/N(O7V)1.5. A comparison between the WR census of NGC 7793 and survey of the central region of NGC 300 by Schild et al. (2003) is carried out. This reveals somewhat higher N(WR)/N(O) and N(WC)/N(WN) ratios in NGC 300, in part anticipated owing to its slightly higher mean metallicity.
-
4.
NGC 7793 represents the fourth of ten star-forming spiral galaxies within 2–8 Mpc whose WR populations that we are surveying. Once completed, these will provide a database from which the nature of a future Type Ib/c supernova can be investigated.
-
5.
Therefore, we have considered biases arising from differences between the intrinsic line strengths of WN and WC stars plus ground-based spatial resolution limitations. Therefore, we consider (a) the LMC WR population degraded to that if it was located at a distance of 4 Mpc; (b) differences to the apparent magnitude to the subset of NGC 7793 sources resulting from higher spatial resolution HST/ACS imaging. Upcoming narrow-band WFC3 Hubble Space Telescope imaging of the grand-design spiral galaxy M101 (P.I. M. Shara) will therefore provide the ideal dataset with which to assess the nature of its future core-collapse SN. This complements both our ground-based studies and the WFPC2 survey of the nearby late-type spiral NGC 2403 by Drissen et al. (1999).
-
6.
Finally, we also report the fortuitous detection of a bright ( = 20.8 mag) background quasar Q2358-32 at resulting from C iv 1548-51 redshifted to the 4684 passband.
Acknowledgements
JLB acknowledges financial support from STFC. Some of the data presented in this paper were obtained from the Multimission Archive at the Space Telescope Science Institute (MAST). STScI is operated by the Association of Universities for Research in Astronomy, Inc., under NASA contract NAS5-26555. Support for MAST for non-HST data is provided by the NASA Office of Space Science via grant NAG5-7584 and by other grants and contracts. Support for some of this work, part of the Spitzer Space Telescope Legacy Science Programme, was provided by NASA through contract 1224769 issued by the Jet Propulsion Laboratory, California Institute of Technology under NASA contract 1407.
| () | ID | 10 | 11a+c | 14 | 16 | 22a–b | 23 | ||||||
|---|---|---|---|---|---|---|---|---|---|---|---|---|---|
| 3727 | [O ii] | 217 | 251 | 145 | 145 | 90 | 116 | 189 | 236 | 166 | 184 | 471 | 526 |
| 4343 | H | 25 | 27 | 42 | 42 | 42 | 47 | 33 | 37 | 40 | 42 | 49 | 51 |
| 4861 | H | 100 | 100 | 100 | 100 | 100 | 100 | 100 | 100 | 100 | 100 | 100 | 100 |
| 4959 | [O iii] | 126 | 125 | 60 | 60 | 76 | 74 | 147 | 143 | 53 | 53 | 108 | 107 |
| 5007 | [O iii] | 380 | 372 | 149 | 149 | 232 | 224 | 431 | 418 | 158 | 156 | 331 | 326 |
| 6563 | H | 345 | 289 | 231 | 231 | 400 | 291 | 386 | 292 | 327 | 288 | 331 | 288 |
| 6583 | [N ii] | 40 | 33 | 38 | 38 | 27 | 19 | 34 | 26 | 38 | 33 | 55 | 48 |
| 6716 | [S ii] | 27 | 22 | 17 | 17 | 7 | 5 | 45 | 34 | 18 | 16 | 44 | 38 |
| 6731 | [S ii] | 25 | 20 | 12 | 12 | 4 | 3 | 27 | 20 | 14 | 12 | 28 | 24 |
| 4681 | H | 0.423 | 0.740 | 12.2 | 12.2 | 0.265 | 0.718 | 0.299 | 0.713 | 2.08 | 3.10 | 0.111 | 0.170 |
| () | ID | 26 | 27 | 34 | 35 | 36 | 37 | ||||||
|---|---|---|---|---|---|---|---|---|---|---|---|---|---|
| 3727 | [O ii] | 579 | 662 | 417 | 473 | 267 | 352 | 490 | 528 | 187 | 234 | 295 | 330 |
| 4343 | H | 37 | 40 | 45 | 47 | – | – | 21 | 21 | 41 | 46 | 48 | 50 |
| 4861 | H | 100 | 100 | 100 | 100 | 100 | 100 | 100 | 100 | 100 | 100 | 100 | 100 |
| 4959 | [O iii] | 25 | 25 | 47 | 46 | 34 | 33 | 32 | 31 | 25 | 25 | 46 | 46 |
| 5007 | [O iii] | 70 | 68 | 145 | 142 | 100 | 96 | 95 | 94 | 76 | 74 | 139 | 137 |
| 6563 | H | 345 | 286 | 337 | 289 | 410 | 291 | 316 | 287 | 388 | 292 | 331 | 289 |
| 6583 | [N ii] | 158 | 131 | 74 | 64 | 103 | 74 | 88 | 80 | 91 | 68 | 48 | 42 |
| 6716 | [S ii] | 87 | 72 | 38 | 33 | 48 | 33 | 61 | 55 | 54 | 40 | 34 | 30 |
| 6731 | [S ii] | 56 | 46 | 32 | 27 | 32 | 22 | 52 | 47 | 32 | 23 | 22 | 19 |
| 4681 | H | 0.067 | 0.118 | 0.166 | 0.270 | 1.29 | 3.76 | 0.141 | 0.189 | 0.466 | 1.14 | 1.02 | 1.57 |
| () | ID | nucleus | 39 | 42a–b | 46 | 47 | 49 | ||||||
|---|---|---|---|---|---|---|---|---|---|---|---|---|---|
| 3727 | [O ii] | 154 | 179 | – | – | 349 | 444 | 345 | 399 | 267 | 307 | 332 | 388 |
| 4343 | H | 29 | 31 | 31 | 34 | 45 | 51 | 41 | 44 | 46 | 49 | 50 | 54 |
| 4861 | H | 100 | 100 | 100 | 100 | 100 | 100 | 100 | 100 | 100 | 100 | 100 | 100 |
| 4959 | [O iii] | 30 | 30 | 35 | 34 | 69 | 67 | 48 | 48 | 21 | 21 | 189 | 187 |
| 5007 | [O iii] | 84 | 82 | 107 | 104 | 211 | 180 | 145 | 142 | 71 | 70 | 558 | 546 |
| 6563 | H | 222 | 183 | 389 | 291 | 396 | 293 | 346 | 289 | 344 | 289 | 290 | 239 |
| 6583 | [N ii] | 88 | 72 | 62 | 46 | 93 | 68 | 61 | 50 | 80 | 67 | 52 | 43 |
| 6716 | [S ii] | 32 | 26 | 42 | 31 | 59 | 43 | 47 | 39 | 39 | 33 | 49 | 40 |
| 6731 | [S ii] | 22 | 18 | 30 | 22 | 39 | 28 | 34 | 28 | 26 | 22 | 34 | 28 |
| 4681 | H | 6.80 | 12.4 | 0.416 | 1.04 | 1.59 | 4.09 | 1.78 | 3.14 | 0.231 | 0.399 | 0.157 | 0.285 |
| () | ID | 50a | 62 | 69 | 72 | 73a | |||||
| 3727 | [O ii] | 203 | 247 | – | – | 130 | 147 | 37 | 41 | – | – |
| 4343 | H | 5 | 6 | 43 | 44 | 40 | 42 | 35 | 37 | – | – |
| 4861 | H | 100 | 100 | 100 | 100 | 100 | 100 | 100 | 100 | 100 | 100 |
| 4959 | [O iii] | – | – | 114 | 114 | 140 | 139 | 209 | 207 | 113 | 112 |
| 5007 | [O iii] | 60 | 58 | 334 | 332 | 417 | 410 | 608 | 599 | 314 | 310 |
| 6563 | H | 379 | 292 | 310 | 287 | 337 | 289 | 330 | 288 | 327 | 289 |
| 6583 | [N ii] | 94 | 72 | 43 | 40 | 28 | 24 | – | – | 21 | 19 |
| 6716 | [S ii] | 63 | 47 | 41 | 38 | 25 | 21 | – | – | 14 | 12 |
| 6731 | [S ii] | 60 | 45 | 22 | 20 | 17 | 14 | 43 | 37 | 11 | 9 |
| 4681 | H | 0.0316 | 0.0717 | 0.279 | 0.354 | 0.975 | 1.58 | 0.0776 | 0.118 | 1.35 | 1.98 |
References
- Abbott et al. (2004) Abbott J. B., Crowther P. A., Drissen L., Dessart L., Martin P., Boivin G., 2004, MNRAS, 350, 552
- Bowen (1991) Bowen D. V., 1991, MNRAS, 251, 649
- Bresolin et al. (2009) Bresolin F., Gieren W., Kudritzki R., Pietrzyński G., Urbaneja M. A., Carraro G., 2009, ApJ, 700, 309
- Bresolin et al. (2005) Bresolin F., Schaerer D., González Delgado R. M., Stasińska G., 2005, A&A, 441, 981
- Breysacher et al. (1999) Breysacher J., Azzopardi M., Testor G., 1999, A&AS, 137, 117
- Carignan & Puche (1990) Carignan C., Puche D., 1990, AJ, 100, 394
- Chun (1983) Chun M.-S., 1983, Journal of Korean Astronomical Society, 16, 1
- Conti et al. (2008) Conti P. S., Crowther P. A., Leitherer C., 2008, From Luminous Hot Stars to Starburst Galaxies. Cambridge University Press
- Conti & Vacca (1990) Conti P. S., Vacca W. D., 1990, AJ, 100, 431
- Corwin et al. (1994) Corwin Jr. H. G., Buta R. J., de Vaucouleurs G., 1994, AJ, 108, 2128
- Crowther (2007) Crowther P. A., 2007, ARA&A, 45, 177
- Crowther et al. (2010) Crowther P. A., Barnard R., Carpano S., Clark J. S., Dhillon V. S., Pollock A. M. T., 2010, MNRAS, pp L11+
- Crowther & Bibby (2009) Crowther P. A., Bibby J. L., 2009, A&A, 499, 455
- Crowther et al. (2007) Crowther P. A., Carpano S., Hadfield L. J., Pollock A. M. T., 2007, A&A, 469, L31
- Crowther et al. (1998) Crowther P. A., De Marco O., Barlow M. J., 1998, MNRAS, 296, 367
- Crowther & Dessart (1998) Crowther P. A., Dessart L., 1998, MNRAS, 296, 622
- Crowther et al. (2002) Crowther P. A., Dessart L., Hillier D. J., Abbott J. B., Fullerton A. W., 2002, A&A, 392, 653
- Crowther et al. (2003) Crowther P. A., Drissen L., Abbott J. B., Royer P., Smartt S. J., 2003, A&A, 404, 483
- Crowther & Hadfield (2006) Crowther P. A., Hadfield L. J., 2006, A&A, 449, 711
- Crowther & Smith (1997) Crowther P. A., Smith L. J., 1997, A&A, 320, 500
- Davoust & de Vaucouleurs (1980) Davoust E., de Vaucouleurs G., 1980, ApJ, 242, 30
- de Vaucouleurs et al. (1991) de Vaucouleurs G., de Vaucouleurs A., Corwin Jr. H. G., Buta R. J., Paturel G., Fouque P., 1991, Third Reference Catalogue of Bright Galaxies
- Dopita et al. (1994) Dopita M. A., Bell J. F., Chu Y., Lozinskaya T. A., 1994, ApJS, 93, 455
- Draper et al. (2009) Draper P. W., Berry D. S., Jenness T., Economou F., 2009, in D. A. Bohlender, D. Durand, & P. Dowler ed., Astronomical Society of the Pacific Conference Series Vol. 411 of Astronomical Society of the Pacific Conference Series, GAIA – Version 4. pp 575–+
- Dray & Tout (2003) Dray L. M., Tout C. A., 2003, MNRAS, 341, 299
- Drissen et al. (1999) Drissen L., Roy J., Moffat A. F. J., Shara M. M., 1999, AJ, 117, 1249
- Eldridge & Vink (2006) Eldridge J. J., Vink J. S., 2006, A&A, 452, 295
- Evans et al. (2010) Evans C. J., Bastian N., Beletsky Y., Brott I., Cantiello M., Clark J. S., Crowther P. A., et al 2010, in IAU Symposium Vol. 266 of IAU Symposium, The VLT-FLAMES Tarantula Survey. pp 35–40
- Evans et al. (2004) Evans C. J., Lennon D. J., Trundle C., Heap S. R., Lindler D. J., 2004, ApJ, 607, 451
- Gibson (2000) Gibson B. K., 2000, Memorie della Societa Astronomica Italiana, 71, 693
- Gieren et al. (2005) Gieren W., Pietrzyński G., Soszyński I., Bresolin F., Kudritzki R., Minniti D., Storm J., 2005, ApJ, 628, 695
- Gil de Paz et al. (2003) Gil de Paz A., Madore B. F., Pevunova O., 2003, ApJS, 147, 29
- Hadfield & Crowther (2007) Hadfield L. J., Crowther P. A., 2007, MNRAS, 381, 418
- Hadfield et al. (2005) Hadfield L. J., Crowther P. A., Schild H., Schmutz W., 2005, A&A, 439, 265
- Hamuy et al. (1994) Hamuy M., Suntzeff N. B., Heathcote S. R., Walker A. R., Gigoux P., Phillips M. M., 1994, PASP, 106, 566
- Hamuy et al. (1992) Hamuy M., Walker A. R., Suntzeff N. B., Gigoux P., Heathcote S. R., Phillips M. M., 1992, PASP, 104, 533
- Hintzen et al. (1990) Hintzen P., Maran S. P., Michalitsianos A. G., Foltz C. B., Chaffee Jr. F. H., Kafatos M., 1990, AJ, 99, 45
- Hummer & Storey (1987) Hummer D. G., Storey P. J., 1987, MNRAS, 224, 801
- Karachentsev et al. (2003) Karachentsev I. D., Grebel E. K., Sharina M. E., Dolphin A. E., Geisler D., Guhathakurta P., Hodge P. W., Karachentseva V. E., Sarajedini A., Seitzer P., 2003, A&A, 404, 93
- Kelly et al. (2008) Kelly P. L., Kirshner R. P., Pahre M., 2008, ApJ, 687, 1201
- Kennicutt (1998) Kennicutt Jr. R. C., 1998, ARA&A, 36, 189
- Kennicutt et al. (2003) Kennicutt Jr. R. C., Armus L., Bendo G., Calzetti D., Dale D. A., Draine B. T., Engelbracht C. W., et al 2003, PASP, 115, 928
- Kennicutt et al. (1995) Kennicutt Jr. R. C., Bresolin F., Bomans D. J., Bothun G. D., Thompson I. B., 1995, AJ, 109, 594
- Kennicutt et al. (2008) Kennicutt Jr. R. C., Lee J. C., Funes José G. S. J., Sakai S., Akiyama S., 2008, ApJS, 178, 247
- Lee et al. (2009) Lee J. C., Gil de Paz A., Tremonti C., Kennicutt R. C., Salim S., Bothwell M., Calzetti D., et al 2009, ApJ, 706, 599
- Leloudas et al. (2010) Leloudas G., Sollerman J., Levan A. J., Fynbo J. P. U., Malesani D., Maund J. R., 2010, ArXiv e-prints
- Magrini et al. (2007) Magrini L., Vílchez J. M., Mampaso A., Corradi R. L. M., Leisy P., 2007, A&A, 470, 865
- Massey (1996) Massey P., 1996, in J. M. Vreux, A. Detal, D. Fraipont-Caro, E. Gosset, & G. Rauw ed., Liege International Astrophysical Colloquia Vol. 33 of Liege International Astrophysical Colloquia, Numbers and distribution of Wolf-Rayet stars in local group galaxies : clues to massive star evolution. pp 361–+
- Massey & Conti (1983) Massey P., Conti P. S., 1983, ApJ, 273, 576
- Massey & Holmes (2002) Massey P., Holmes S., 2002, ApJ, 580, L35
- Massey & Hunter (1998) Massey P., Hunter D. A., 1998, ApJ, 493, 180
- Massey & Johnson (1998) Massey P., Johnson O., 1998, ApJ, 505, 793
- Mazzarella & Boroson (1993) Mazzarella J. M., Boroson T. A., 1993, ApJS, 85, 27
- McCall (1982) McCall M. L., 1982, PhD thesis, THE UNIVERSITY OF TEXAS AT AUSTIN.
- McCall et al. (1985) McCall M. L., Rybski P. M., Shields G. A., 1985, ApJS, 57, 1
- Meynet & Maeder (2005) Meynet G., Maeder A., 2005, A&A, 429, 581
- Moffat & Shara (1983) Moffat A. F. J., Shara M. M., 1983, ApJ, 273, 544
- Mokiem et al. (2007) Mokiem M. R., de Koter A., Vink J. S., Puls J., Evans C. J., Smartt S. J., Crowther P. A., Herrero A., Langer N., Lennon D. J., Najarro F., Villamariz M. R., 2007, A&A, 473, 603
- Mora et al. (2009) Mora M. D., Larsen S. S., Kissler-Patig M., Brodie J. P., Richtler T., 2009, A&A, 501, 949
- O’Halloran et al. (2006) O’Halloran B., Satyapal S., Dudik R. P., 2006, ApJ, 641, 795
- Osterbrock (1989) Osterbrock D. E., 1989, Astrophysics of gaseous nebulae and active galactic nuclei. University Science Books, Mill Valley, CA, 1989, 422 p.
- Pagel & Edmunds (1981) Pagel B. E. J., Edmunds M. G., 1981, ARA&A, 19, 77
- Pettini & Boksenberg (1985) Pettini M., Boksenberg A., 1985, ApJ, 294, L73
- Pettini & Pagel (2004) Pettini M., Pagel B. E. J., 2004, MNRAS, 348, L59
- Pilyugin et al. (2004) Pilyugin L. S., Vílchez J. M., Contini T., 2004, A&A, 425, 849
- Prescott et al. (2007) Prescott M. K. M., Kennicutt Jr. R. C., Bendo G. J., Buckalew B. A., Calzetti D., Engelbracht C. W., Gordon K. D., et al 2007, ApJ, 668, 182
- Read & Pietsch (1999) Read A. M., Pietsch W., 1999, A&A, 341, 8
- Schaerer & Vacca (1998) Schaerer D., Vacca W. D., 1998, ApJ, 497, 618
- Schild et al. (2003) Schild H., Crowther P. A., Abbott J. B., Schmutz W., 2003, A&A, 397, 859
- Schild et al. (1990) Schild H., Smith L. J., Willis A. J., 1990, A&A, 237, 169
- Schlegel et al. (1998) Schlegel D. J., Finkbeiner D. P., Davis M., 1998, ApJ, 500, 525
- Seaton (1979) Seaton M. J., 1979, MNRAS, 187, 73P
- Smith et al. (1990) Smith L. F., Shara M. M., Moffat A. F. J., 1990, ApJ, 358, 229
- Smith et al. (1996) Smith L. F., Shara M. M., Moffat A. F. J., 1996, MNRAS, 281, 163
- Stetson (2000) Stetson P. B., 2000, PASP, 112, 925
- Tody (1986) Tody D., 1986, in D. L. Crawford ed., Society of Photo-Optical Instrumentation Engineers (SPIE) Conference Series Vol. 627 of Society of Photo-Optical Instrumentation Engineers (SPIE) Conference Series, The IRAF Data Reduction and Analysis System. pp 733–+
- Torres-Dodgen & Massey (1988) Torres-Dodgen A. V., Massey P., 1988, AJ, 96, 1076
- Urbaneja et al. (2005) Urbaneja M. A., Herrero A., Bresolin F., Kudritzki R., Gieren W., Puls J., Przybilla N., Najarro F., Pietrzyński G., 2005, ApJ, 622, 862
- Walborn et al. (1999) Walborn N. R., Drissen L., Parker J. W., Saha A., MacKenty J. W., White R. L., 1999, AJ, 118, 1684
- Webster & Smith (1983) Webster B. L., Smith M. G., 1983, MNRAS, 204, 743
- Woosley & Bloom (2006) Woosley S. E., Bloom J. S., 2006, ARA&A, 44, 507