Local Luminous Infrared Galaxies. I. Spatially resolved observations with Spitzer/IRS ⋆
Abstract
We present results from the Spitzer/IRS spectral mapping observations of 15 local luminous infrared galaxies (LIRGs). In this paper we investigate the spatial variations of the mid-IR emission which includes: fine structure lines, molecular hydrogen lines, polycyclic aromatic features (PAHs), continuum emission and the 9.7 m silicate feature. We also compare the nuclear and integrated spectra. We find that the star formation takes place in extended regions (several kpc) as probed by the PAH emission as well as the [Ne II]12.81 m and [Ne III]15.56 m emissions. The behavior of the integrated PAH emission and 9.7 m silicate feature is similar to that of local starburst galaxies. We also find that the minima of the [Ne III]15.56 m/[Ne II]12.81 m ratio tends to be located at the nuclei and its value is lower than that of H ii regions in our LIRGs and nearby galaxies. It is likely that increased densities in the nuclei of LIRGs are responsible for the smaller nuclear [Ne III]15.56 m/[Ne II]12.81 m ratios. This includes the possibility that some of the most massive stars in the nuclei are still embedded in ultracompact H ii regions. In a large fraction of our sample the 11.3 m PAH emission appears more extended than the dust 5.5 m continuum emission. We find a dependency of the 11.3 m PAH/7.7 m PAH and [Ne II]12.81 m/11.3 m PAH ratios with the age of the stellar populations. Smaller and larger ratios respectively indicate recent star formation. The estimated warm (300 K T 1000 K) molecular hydrogen masses are of the order of 108M⊙, which are similar to those found in ULIRGs, local starbursts and Seyfert galaxies. Finally we find that the [Ne II]12.81 m velocity fields for most of the LIRGs in our sample are compatible with a rotating disk at kpc scales, and they are in a good agreement with H velocity fields.
Subject headings:
galaxies: nuclei — galaxies: structure — galaxies: active — galaxies: starburst — infrared: galaxies1. Introduction
Infrared (IR) bright galaxies were first identified almost 40 years ago (Rieke & Low, 1972). The IRAS satellite detected a large number of these galaxies in the local Universe (see Sanders & Mirabel 1996 for a review). Galaxies were classified according to their IR (m) luminosities into Luminous Infrared Galaxies (LIRGs, ) and Ultra Luminous Infrared Galaxies (ULIRGs, ). Since then, an increasing number of studies showed the important role of (U)LIRGs at cosmological distances. LIRGs and ULIRGs are not common in the local Universe, accounting for just and , respectively, of the total IR emission of galaxies. However, at z1, LIRGs dominate the IR background and the co-moving star formation rate density, while ULIRGs are dominant at z2 (Le Floc’h et al., 2005; Pérez-González et al., 2005; Caputi et al., 2007).
Thanks to the high sensitivity of the Infrared Spectrograph (IRS) (Houck et al., 2004) on-board Spitzer, we can, for the first time, study systematically the mid-IR properties of (U)LIRGs, both locally and at high-. The majority of IRS local studies have, so far, focused on the properties of starburst galaxies (Smith et al., 2007b; Brandl et al., 2006) and ULIRGs (Armus et al., 2007; Farrah et al., 2007). The latter class of galaxies includes a large variety of physical and excitation conditions. For instance, most of these local () ULIRGs are powered predominantly by compact starburst events, although a substantial AGN contribution is present in about half of them (Imanishi et al., 2007; Farrah et al., 2007; Nardini et al., 2008). In the future the larger sample (200) of local LIRGs of the Spitzer legacy program GOALS will enable a statistical study of this class of galaxies (Armus et al., 2009).
Although ULIRGs at z2 extend to even higher luminosities than local ones, their mid-IR spectra are similar to those of local starbursts, rather than to local ULIRGs (Rigby et al., 2008; Farrah et al., 2008). A similar behavior is found for high-z submillimeter galaxies (Pope et al., 2007; Menéndez-Delmestre et al., 2009). This behavior may indicate that star formation in IR-bright galaxies at z2 is taking place over larger scales (a few kpc) than in local ULIRGs, where most of the IR emission arises from very compact regions (sub-kiloparsec scales, see e.g., Soifer et al. 2000; Farrah et al. 2007).
As a result, local LIRGs may provide important insights to the behavior of high-redshift ULIRGs. Their star formation is often distributed over a substantial fraction of the galaxy (e.g., Alonso-Herrero et al. 2006), and in any case is usually not embedded at the high optical depths characteristic of the nuclear star forming regions in local ULIRGs. To make good use of this analogy requires observations that map the local LIRGs to get an understanding of their global properties as well as to provide a better comparison with the observations of high-z galaxies, where the entire galaxy is encompassed in the IRS slit. The spectral mapping mode of Spitzer/IRS is well suited for this purpose, since it can provide both the nuclear and integrated spectra of local galaxies, enabling study of the spatial distribution of the spectral features that make up the integrated spectrum.
This is the first in a series of papers studying the mid-IR properties of local LIRGs. We present Spitzer/IRS spectral mapping observations of a representative sample of fifteen local LIRGs. The first results and the goals of this program were presented by Alonso-Herrero et al. (2010). In the present paper we focus on the analysis of the spatially resolved measurements. The paper is organized as follows. In Section 2 we present the sample and the observational details. Section 3 describes the analysis of the data. We examine the silicate feature in Section 4. Sections 5, 6, 7 discuss the spatially resolved properties of the atomic fine structure lines, PAHs, and molecular hydrogen emission, respectively. We explore the velocity fields in Section 8. Finally, in Section 9 we summarize the main results. Throughout this paper we assume a flat cosmology with km s-1Mpc-1, and .
2. Observations and data reduction
2.1. The sample
The galaxies studied here were selected from the sample of 30 local LIRGs described in Alonso-Herrero et al. (2006), which was drawn from the IRAS Revised Bright Galaxy Sample (RBGS, Sanders et al. 2003). The sample of Alonso-Herrero et al. (2006) is a volume limited sample, and the velocity range was selected so that the Pa emission line could be observed with the NICMOS F190N filter on-board the Hubble Space Telescope (HST). This restricted the sample to local LIRGs (40 Mpc d 75 Mpc). From this sample we selected 15 galaxies (Table 1) with extended emission in the NICMOS Pa images to be mapped with the IRS spectrograph. This selection criterion does not introduce any bias in the luminosity, distance and nuclear activity distributions of the mapped galaxies as compared to the parent sample of Alonso-Herrero et al. (2006). The remaining galaxies in the sample have been observed using the IRS staring mode as part of different programs. The latter will be analyzed with the mapping data in a forthcoming paper . The interacting galaxy Arp 299 was studied in detail by Alonso-Herrero et al. (2009b) and will be included in the appropriate comparisons and figures in this paper.
Most of the nuclei of the LIRGs in our sample are classified as H ii region-like from optical spectroscopy, 3 galaxies have a Seyfert classification and 2 are classified as composite (intermediate between H ii and LINER, see Alonso-Herrero et al. 2009a). The infrared luminosity of the sample ranges from 1011.0 to 1011.8 L⊙. The main properties of the galaxies are summarized in Table 1.
| Pixel size | Ramp | # | Step size | Step size | |
|---|---|---|---|---|---|
| IRS Module | (arcsec) | (s) | of cycles | (arcsec) | (arcsec) |
| SL1, SL2 | 1.85 | 14 | 2 | 1.8 | - |
| LL1, LL2 | 4.46 | 14 | 2 | 5.25 | - |
| SH | 2.26 | 30 | 2 | 2.35 | 5.65 |
| LH | 4.46 | 60 | 4 | 5.55 | - |
2.2. Spectral Mapping
We obtained Spitzer IRS spectral mapping observations through two guaranteed time observation (GTO) programs P30577 and P40479 (PI: G. H. Rieke). We used all four IRS modules: high resolution (R600) modules with Short-High (SH; 9.9 - 19.6 m) and Long-High (LH; 18.7 - 37.2 m), and low resolution (R60 - 120) with Short-Low (SL1; 7.4 - 14.5 m, SL2; 5.2 - 7.7 m) and Long-Low (LL1; 19.5 - 38.0 m, LL2; 14.0 - 21.3 m). Maps were made by moving the telescope pointing position perpendicular to the long axis of the slit with a step size half of the slit width. The SL, LL and LH slits are long enough to cover the full region of interest with just one slit length, but due to the smaller size of SH slit, parallel steps were also needed. The parallel step size was half of the slit height. This strategy produced maps with a redundancy per pixel of 2 for SL, LL and LH, and 4 for SH. Table 1 details the integration time, pixel size and step size for each IRS module. The maps cover at least the central 20”20” to 30”30” of the galaxies.
Dedicated background observations are not needed for the low resolution modules (SL and LL) because the separation on the sky between the two orders of each module is larger than the galaxy size. That is, when order one is on the galaxy, order two is observing the background and vice versa. The SH and LH slits are too small to allow background subtraction. We obtained dedicated background observations for LH by observing a region 2 arcminutes away from the galaxy. SH sky observations are available only for the galaxies observed under the program P40479. For the galaxies without dedicated SH background observations, we estimated the sky background emission by combining the background spectra from the low resolution modules. Generally the sky contribution is not very important for the galaxies in our sample, except for NGC 3110 and Zw 049.057. The sky background is bright at the position of these galaxies and its subtraction is essential to match the fluxes from the different slits. Moreover, subtracting background observations is always useful because it removes many of the rogue pixels and improves the final quality of the spectra. This is especially important for the LH module since it contains a large number of such pixels.
We used Basic Calibrated Data (BCD), processed by Spitzer pipeline version S15.3 (low resolution modules: SL and LL) and version S17.2 (high resolution modules: SH and LH) to build data cubes with CUBISM (Smith et al., 2007a). CUBISM is a tool that combines slit observations to create spectral cubes. It also performs background subtraction, flux calibration and estimates the statistical uncertainty at each spectral wavelength.
3. Analysis
3.1. SL Spectral Maps
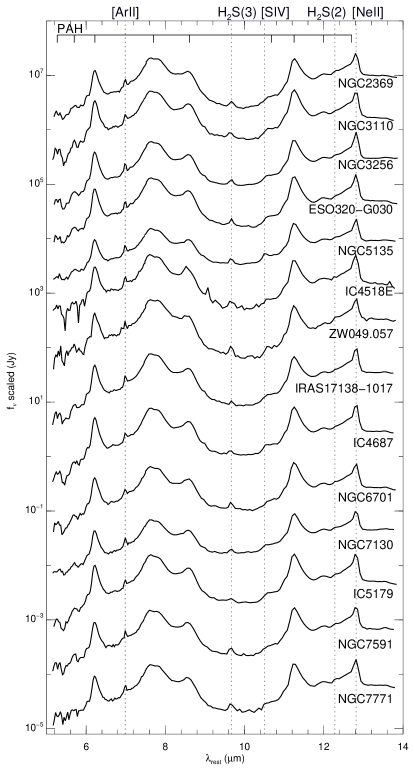
Using the SL cubes generated by CUBISM we constructed maps of the 5.5 m continuum, and the most prominent aromatic features (hereafter PAH) in this module (6.2 m PAH, 7.7 m PAH and 11.3 m PAH). To build them we used our own IDL procedures. First we extracted 1-D spectra from the cubes by averaging the spectra over a 22 pixel aperture and then by moving with a 1 pixel step until the whole field of view was covered. The 22 pixel extraction box allows us to increase the S/N of the 1-D spectra, with only a slight loss of angular resolution (see below and Appendix A). Once we obtained the 1-D spectra, for each pixel we did the following. To create the 5.5 m continuum map, we integrated the flux between the rest frame 5.3 m and 5.7 m wavelengths (in this section all wavelengths refer to rest frame wavelengths). For the PAH maps, first we fitted the local continuum using a linear fit. The continuum pivots were set by averaging the spectrum over a 0.2 m interval centered at 5.75 m and 6.7 m for the 6.2 m PAH, at 7.2 m and 8.2 m for the 7.7 m PAH, and at 10.6 m and 11.8 m for the 11.3 m PAH. After subtracting the continuum, we integrated the flux in the wavelength ranges between 5.9 and 6.5 m 7.3 and 7.9 m and 10.8 and 11.6 m for the 6.2, 7.7 and 11.3 m PAH features, respectively. We derived the flux uncertainty of these maps with the statistical uncertainties provided by CUBISM. To avoid noisy pixels, we required the feature peak to be at least above 1 to plot that pixel in the map, where is the continuum noise. The SL spectral maps of our sample are shown in Figure 1.
The angular resolution (FWHM) of the SL spectral maps is 4.5 arcsec. This is the resolution when we use 22 boxes to construct the maps, as opposed to that measured from the standard star observations (see Appendix A). For the distances of our galaxies corresponds to 1 kpc (the exact scale for each galaxy is given in Table 1). In Appendix A we give full details on how the angular resolution of the spectral maps was derived.
We constructed maps of different PAH ratios by dividing the PAH maps obtained as described above. To avoid noisy pixels in the ratio maps we imposed further restrictions, and only those pixels with signal-to-noise ratio greater than 4 are plotted in the PAH ratio maps. Figures 2 and 3 show the 11.3 m PAH/6.2 m PAH and 11.3 m PAH/7.7 m PAH ratios, respectively.
3.2. SH Spectral Maps
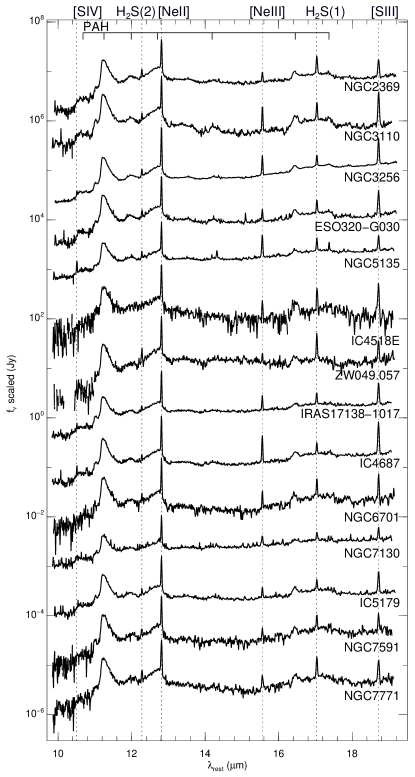
We used the SH cubes to measure the brightest fine structure emission lines: [S IV]10.51 m, [Ne II]12.81 m, [Ne III]15.56 m, [S III]18.71 m and the molecular hydrogen lines, H2 S(2) at 12.3 m and H2 S(1) at 17.0 m. First we extracted 1-D spectra using the same method as for the low resolution cubes. Then we used the IDL package MPFIT (Markwardt, 2009) to fit simultaneously a first-order polynomial to the continuum and a Gaussian to the line. The fit was over a wavelength range of 0.4 m centered at the line wavelength. The spectral resolution, R600, is sufficiently high to allow us to separate the emission lines from the broad PAH bands. However, to improve the continuum determination, we used extra Gaussian profiles to fit the PAH features close to the emission lines (e.g., the 12.7 m PAH feature next to the [NeII]). To avoid noisy pixels in the maps, we required: (1) a signal-to-noise ratio in the continuum range; and (2) the line peak to be at least 1 above the continuum noise for the pixel to be shown in the corresponding map.
We also constructed an 11.3 m PAH feature map by the same procedure as for SL cubes, but with the high resolution spectra. A 15 m continuum was obtained by integrating the flux between 14.9 m and 15.1 m. We required a signal above 1 to plot a pixel in these two maps.
The SH spectral maps are shown in Figure 4 together with the HST/NICMOS continuum-subtracted Pa maps of Alonso-Herrero et al. (2006).
We constructed [S III]18.71 m/[Ne II]12.81 m, [Ne III]15.56 m/[Ne II]12.81 m and [Ne II]12.81 m/11.3 m PAH ratio maps by dividing the flux maps. The variation of the PSF size with wavelength within each module is negligible (see Appendix A), and therefore we divided the flux maps directly without attempting to correct for this small effect (we only built ratio maps of lines observed with the SH module). We imposed stricter conditions to plot a pixel in a ratio map than those used for the line maps; only pixels with a flux measurement , for both features, were included in the ratio maps. The maps of the SH line ratios are shown in Figure 5. The angular resolution of the SH maps is 6 arcsec. This corresponds to physical scales between 1 kpc, for the nearest galaxies, and 2 kpc for the most distant ones.
3.3. Nuclear, Integrated and Extranuclear 1-D Spectra
We extracted 1-D spectra of the nuclei as well as of the integrated galaxy. To extract the nuclear spectra we used a 5.5”5.5” square aperture centered at the nuclear coordinates (Table 1). This aperture corresponds to physical scales between 1 and 2 kpc, depending on the galaxy. We set the orientation of the aperture aligned with the R.A. and Dec axis. We used the same aperture for both low and high resolution data cubes. To obtain the integrated spectrum we summed the flux of the cube. We excluded those pixels with the 11.3 m PAH flux (15 m continuum) below 1 to avoid adding too much noise to the low resolution (high resolution) integrated spectra. This threshold is the same as that required to plot a pixel in the 11.3 m PAH and 15 m continuum maps of Figure 1 and Figure 4 respectively. The physical scale of the integration area varies from galaxy to galaxy. The approximated physical sizes are listed in Tables 2 and 3 for the low and high resolution maps respectively. They are of the order of 108 kpc. Although the extraction regions are slightly different for each module, the flux differences are only 10-20%.
We plot the integrated spectra in Figure 6. The nuclear spectra will be presented in Pereira-Santaella et al. (in preparation), together with the nuclear spectra of the rest of the Alonso-Herrero et al. (2006) sample.
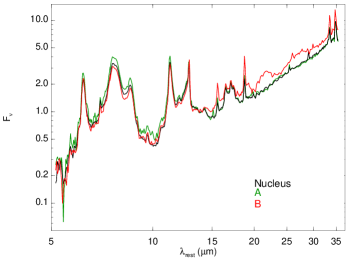
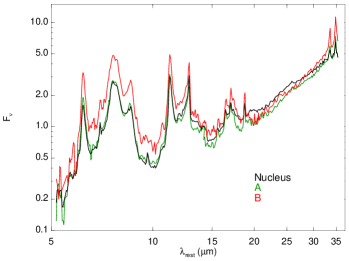
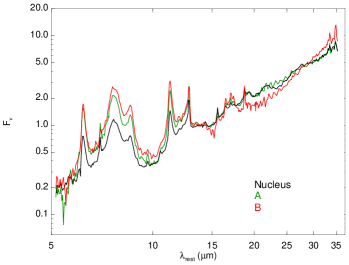
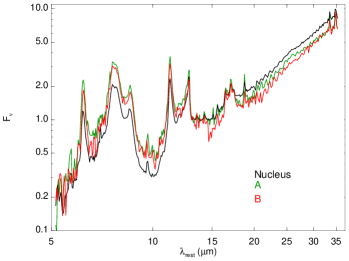
In Figure 7 (right) we show a comparison of the nuclear and extranuclear low resolution spectra normalized at 14 m for 4 of the galaxies. We selected these galaxies because in their spectral maps (left panel of Figure 7) it is possible to identify extranuclear H ii regions and extract their spectra. All the spectra, nuclear and extranuclear, show bright PAH features and fine structure lines. The variations of the spectral features from galaxy to galaxy and within a galaxy are relatively small, at least when compared to those observed in ULIRGs (Armus et al., 2007) or those observed in star-forming galaxies with different metallicities (Engelbracht et al., 2008). That is, the comparison of the spectra shows that these LIRGs have a more or less uniform shallow silicate absorption and relatively high metallicity.
The PAH ratios, PAH equivalent width and silicate depth measured in the nuclear and integrated low resolution spectra are listed in Table 2. Table 3 and Table 4 show respectively the integrated and nuclear fine structure line fluxes in the high resolution spectra.
3.4. Silicate Feature Maps
Amorphous silicate grains present a broad feature centered at 9.7 m that can be measured from the SL cubes. We used a method similar to that proposed by Spoon et al. (2007) to measure the observed silicate strength. First, we extracted 1-D spectra from the cube as described in Section 3.1. For each spectrum, we estimated the continuum expected at 10 m by fitting a power law through the feature-free continuum pivots at 5.5 m and 13 m. Then we compared the estimated continuum and the measured flux using the following expression:
| (1) |
where is the silicate strength. When the silicate strength is negative, the silicate feature is in absorption, whereas a positive silicate strength indicates that the feature is seen in emission.
We estimated the flux at 10 m instead of 9.7 m (the maximum of the feature) to avoid a possible contamination by the molecular hydrogen emission line H2 S(3) at 9.67 m.
There are several factors that affect the accuracy of the silicate strength measurement. The most important source of uncertainty is the continuum estimate, because of the presence of broad PAH bands in the spectra. We selected continuum pivots similar to those used by Spoon et al. (2007), so that we can make meaningful comparisons with their results. The is equivalent to the optical depth of the silicate absorption () defined in Rieke & Lebofsky (1985). Alternatively, a more accurate way to measure the silicate optical depth is to fit all the features (PAHs, emission lines and dust continuum) present in the spectrum as PAHFIT does (Smith et al., 2007b). However, to avoid ambiguities between the PAH strength and the silicate absorption, the entire low resolution spectral range (5.2 m -38 m) is desirable. At longer wavelengths (14.5 m) the pixel size is about 2.5 times larger than at shorter wavelengths and since we are interested in the spatial distribution of the silicate feature we decided to use the first method to estimate the continuum. To compared these methods, first we fitted the integrated spectra using PAHFIT, assuming a foreground screen dust geometry to obtain the , and then we compared this value with the measured . We found that both quantities are well correlated.
Keeping in mind that the main source of uncertainty of the silicate strength measurements is the continuum determination, we estimated that the typical values of the statistical uncertainty are 0.05 for the nuclei and less than 0.15 for the extranuclear regions. The maps of the silicate feature strength are presented in Figure 8.
3.5. SH Velocity Fields
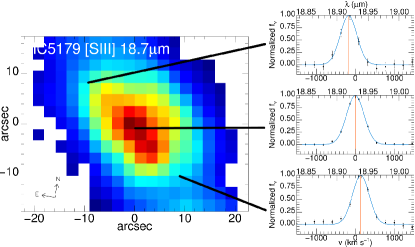
The SH spectra were also used for rough determination of velocities. Figure 9 shows an example of line fitting for selected regions of IC 5179 to illustrate the detection of variations in the line position, even with the relatively low spectral resolution of the SH module.
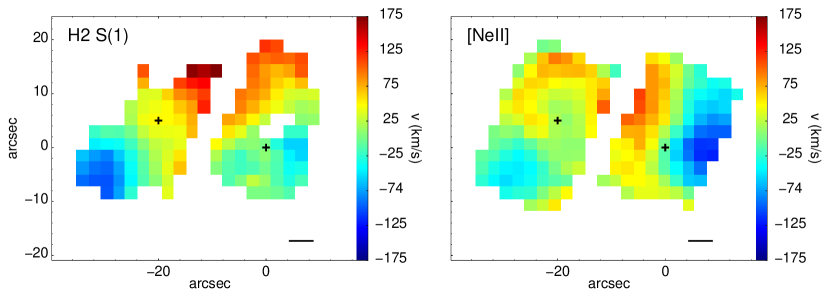
Since the spectral resolution, R600, is lower than that of most kinematic studies, we tested the validity of the velocities with synthetic spectra. We created these spectra to simulate an unresolved spectral line as seen by the SH module and then we tried to recover the original line parameters. The equivalent width of the simulated lines was similar to the observed ones. We added noise to the spectra to match the continuum signal-to-noise ratio of the maps. The continuum signal-to-noise ratio, for most of the galaxies, is in the range 60-100 at the nuclei and 3-10 at the external regions. To allow for the effect of the telescope pointing uncertainties, we distorted the wavelength scale by 5% (estimated from the pointing information in the BCD file headers). We found that this effect limits the accuracy of the velocity determination to 10 km s-1, independent of the signal-to-noise ratio of the spectra. For extended sources, which fill uniformly the slit, the wavelengths are more stable, and then the uncertainty due to the pointing inaccuracy would be lower. The galaxies studied here are not point sources, neither uniformly extended sources, thus this uncertainty estimation is an upper limit. Including the uncertainty in the absolute wavelength calibration (equivalent to 10% of a pixel), we found the minimum uncertainty to be 20 km s-1. We therefore conclude that the uncertainty in the velocity field is in the range of 10 - 30 km s-1, depending on the pointing accuracy achieved and the signal-to-noise ratio of an individual spectrum. Thus, we consider that variations in the velocity maps larger than 20 km s-1 are likely to be real. Figure 10 shows the velocity fields derived for the [Ne II]12.81 m and H2 S(1) emission lines; they range up to a total gradient of 200 km s-1 and hence include a substantial amount of information about the sources.
4. The Silicate Feature
4.1. Spatially Resolved Measurements
LIRGs are known to contain highly obscured regions (Amag, see e.g., Veilleux et al. 1995; Genzel et al. 1998; Alonso-Herrero et al. 2000, 2006), usually coincident with the nuclei of the galaxies. Assuming an extinction law and a dust distribution geometry the silicate strength can be converted into a visual extinction.
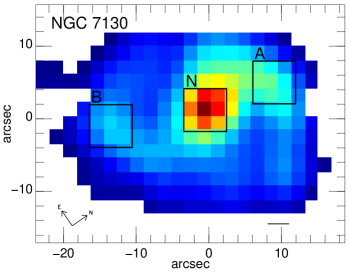
The maps of the silicate feature of our sample are shown in Figure 8. In a large fraction of the systems (80%) the most obscured regions appear to be coincident with the nuclei. In other cases, the nuclear regions appear to be slightly less obscured than the surrounding regions (e.g., NGC 7130) or they show a complicated morphology (e.g., IRAS 171381017, NGC 7771, IC 4687). We note that the spectra used for measuring the strength of the silicate feature are averaged over 1 kpc scales, and thus some of the real variations seen on smaller scales using ground-based mid-IR observations are smoothed out (e.g., the highly obscured southern nucleus of NGC 3256, see Díaz-Santos et al. 2008).
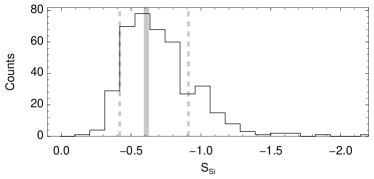
Figure 11 shows the distribution of the silicate strengths measured from the spatially resolved maps for all the galaxies. They are in the range 0 to , with a median of . The strengths of the majority of the LIRGs are moderate (), and intermediate between those observed in starburst galaxies (Brandl et al. 2006) and ULIRGs (Spoon et al. 2007; Sirocky et al. 2008).
If we assume a foreground screen of dust, the silicate absorption strength can be expressed in terms of the optical extinction (AV) using the conversion factor A (Rieke & Lebofsky, 1985). We then find that the median AV of the spatially resolved measurements is 10 mag. The most extincted region in our sample of LIRGs is the nuclear region of IC 694, also known as Arp 299-A (see also Alonso-Herrero et al. 2009b), with A37 mag. The foreground screen assumption gives the minimum extinction compatible with the measurements. Most of the spatially resolved measurements (68%) are in the range of -0.4 to -0.9. This range is much narrower than that observed in the nuclear regions of ULIRGs () (Spoon et al., 2007). The similarity of the silicate absorption strengths among our sample members suggests that they may be in part a product of radiative transfer in dusty regions. We can approximate this possibility by assuming that the dust and emission sources are mixed. The resulting median AV is then 20 magnitudes, about 2 times greater than for the foreground screen geometry.
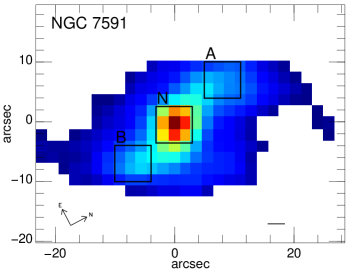
The nuclear and integrated values of the silicate strength are listed in Table 2. For all the galaxies, we find that the integrated strength of the silicate feature is smaller than, although comparable to, the nuclear one. The nuclear silicate strengths range from -0.4 to -1.9, although most of them are larger than -1.0. The integrated strength is , somewhat shallower than the nuclear strength. The LIRGs with the largest variations between the nuclear and integrated silicate features are NGC 3256, Arp 299, NGC 7130, and NGC 7591.
4.2. The vs. 6.2 m PAH EW Diagram
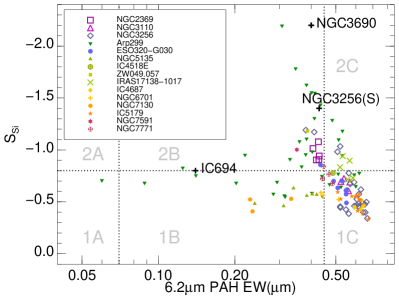
Spoon et al. (2007) presented a diagram using the equivalent width (EW) of 6.2 m PAH feature and the silicate strength to provide a general classification of infrared galaxies. ULIRGs appear distributed along two branches. The horizontal branch is populated by unobscured AGNs (QSO and Sy1) in the left-hand side of the diagram (class 1A) and by starburst galaxies in the right-hand side (class 1C) of the diagram. The diagonal branch goes from deeply obscured nuclei (class 3A) to unobscured starbursts (class 1A).
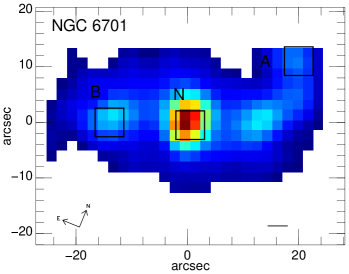
In Figure 12 we present a similar diagram for our sample of LIRGs. The left panel shows the spatially resolved measurements of our sample of LIRGs. Most of them appear in this diagram at the region where both branches intercept. The nuclear and surrounding regions of galaxies classified as Seyferts using optical spectroscopy (NGC 5135: Sy2, NGC 7130: LINER/Sy and Arp 299-B1: Sy2, see Table 1) are located in the 1B region (intermediate between AGN and starbursts), in agreement with their well-known composite nature. NGC 6701 and NGC 7591 are classified as composite objects which is likely to be a combination of an AGN and star-formation activity (see Alonso-Herrero et al. 2009a). Both nuclei appear quite close to region 1B. The two most obscured nuclei in the sample, Arp 299-A and the southern nucleus of NGC 3256, and their neighboring regions, are in the upper part of the diagonal branch populated by ULIRGs, although they do not reach the silicate strengths of the deeply embedded ULIRG nuclei.
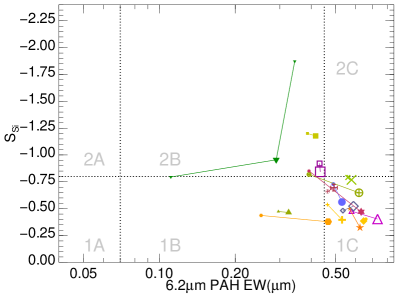
The comparison between the nuclear and integrated values (right panel of Figure 12) shows that the integrated spectra tend to have lower silicate strengths and larger 6.2 m PAH EWs. We find that on average the integrated 6.2 m PAH EW is 30% larger than the nuclear values, whereas the integrated silicate strength is 15% lower than that found in the nuclei. That is, the integrated values move the galaxies to the pure starburst class region (1C) in this diagram. In the case of all the active galaxies of the sample, the nucleus is not sufficiently bright as to dominate the integrated mid-infrared spectrum and the dominant contribution from star formation, which is extended over several kpc (see Alonso-Herrero et al. 2006, 2009b, 2009a) makes the integrated spectrum look more starburst-like.
5. Fine structure emission lines
5.1. Morphology
Although the limited spatial resolution () of the SH maps does not allow us to study the galaxy morphologies in great detail, it is possible to analyze general trends. The exact spatial distribution of the emission lines depends on the physical conditions and the age of the dominating stellar population in each region. In Appendix B we discuss the galaxies individually.
Figure 4 shows the SH spectral maps of the most prominent features, as well as those of the continuum. The [Ne II]12.81 m, [Ne III]15.56 m and [S III]18.71 m fine structure lines have an overall morphology similar to that of the 15 m continuum. We detect [S IV]10.51 m emission in only five systems. In two of them (NGC 7130 and NGC 5135), the [S IV]10.51 m emission mainly comes from the active nuclei (Díaz-Santos et al., 2010). Our data do not allow us to determine whether there is a low surface brightness [S IV]10.51 m emission, associated with H ii regions, in these two galaxies due to the relatively low flux of this line. In the other three cases, NGC 3256, IC 4687, and Arp 299 (for the last galaxy, see Alonso-Herrero et al. 2009b), the emission is more extended and we attribute it to the H ii regions seen in the Pa and/or H images.
We find that the neon emission ([Ne II]12.81 m and [Ne III]15.56 m) and the 15 m continuum are spatially resolved. We calculated the ratio between the nuclear (circular aperture of radius 2 kpc; depending on the distance the aperture radius varies between 1.5 and 3 pixels)111The physical size of the nuclear aperture was chosen so it corresponds to the minimum spatial resolution of the most distant galaxy in the sample. and the integrated neon line emission and 15 m continuum emission for our galaxies, we also used the uncertainty maps to estimate the statistical uncertainty of these ratios (Table 5). On average the uncertainty of the ratio is 6%. These are upper limits to the relative contribution of the nucleus to the total emission of the galaxy as in some cases the IRS maps do not cover the full extent of the galaxy. In general the emission arising from the central 2 kpc accounts for less than 50% of the total emission for the neon lines and the continuum, indicating that the star formation is extended over several kpc. We note however that the LIRGs in this work were selected because they show extended Pa emission (Section 2.1), and thus, this result needs to be confirmed for a complete sample of LIRGs.
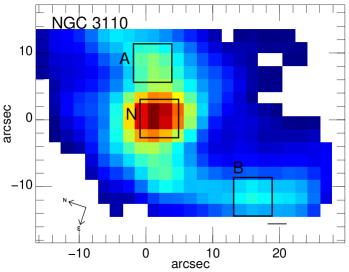
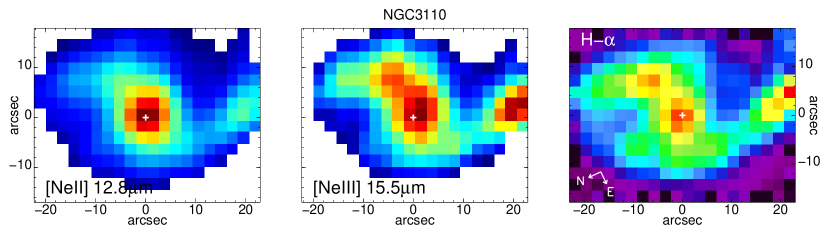
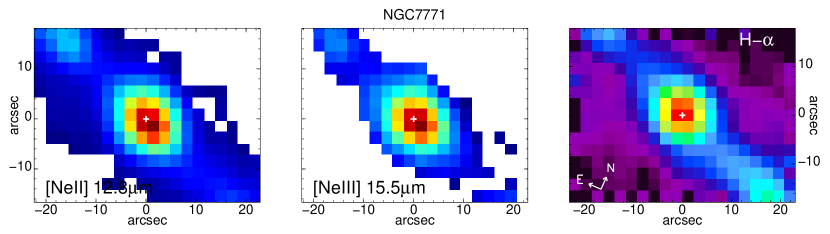
The combined luminosities of the [Ne II]12.81 m and [Ne III]15.56 m lines are good tracers of the star formation rate in galaxies (Ho & Keto, 2007), so a good morphological correspondence is expected between them and H. To further explore the behavior of the neon emission, Figure 13 compares the IRS neon spectral maps with H images222The H images were degraded to the Spitzer/IRS SH angular resolution, pixel size, and orientation. of Hattori et al. (2004) for NGC 3110 and NGC 7771. The SH and H maps of NGC 3110 show emission from the nuclear region and from H ii regions in the spiral arms. The [Ne III]15.56 m emission (also the [S III]18.71 m emission) from these H ii regions is comparable to the emission arising from the nucleus, while [Ne II]12.81 m is more concentrated around the nucleus. We note, however, that the H image is not corrected for extinction. This is especially important in the nuclear region (, see Table 2, Amag) as it is the most extincted region in this galaxy. For NGC 7771, the [Ne II]12.81 m [Ne III]15.56 m and H emissions show similar morphologies, both in the nuclear ring of star formation (seen in the Pa image, Figure 4, but not resolved by the IRS spectral maps), and the extra-nuclear H ii regions, as well as in the diffuse regions between them. These two examples illustrate that at least from a qualitative point of view and on the scales probed here, the H, [Ne II]12.81 m and [Ne III]15.56 m lines are tracing the same young ionizing stellar populations (see Ho & Keto 2007 for a quantitative assessment).
5.2. Spatially Resolved Line Ratios
5.2.1 The [Ne III]15.56 m/[Ne II]12.81 m Line Ratios
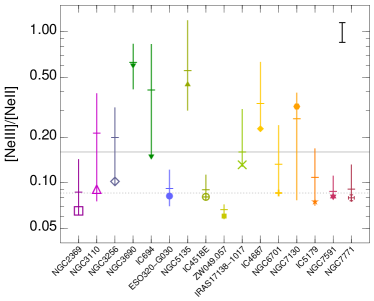
The spectral maps of the [Ne III]15.56 m/[Ne II]12.81 m line ratios for our sample of LIRGs are shown in Figure 5. In most cases the nuclei have the lowest [Ne III]15.56 m/[Ne II]12.81 m ratios, while the circumnuclear regions and H ii regions tend to show higher ratios (see also Figure 14). With the exception of three cases with an active nucleus (NGC 3690, NGC 5135 and NGC 7130), the nuclear values of the [Ne III]15.56 m/[Ne II]12.81 m ratio are all in the range of 0.06 - 0.10 (with three exceptions near 0.2, IC 694, IRAS17138-1017 and IC 4687 - see Table 4). Excluding the galaxies hosting an AGN, the median nuclear ratio is 0.08. The extra-nuclear values are between 0.06 and 1, while the integrated values (see Table 3) are between 0.08 and 0.5. Thornley et al. (2000) find a similar range for the integrated ratios for an additional four LIRGs. This ratio ranges from 0.02 to 6 in starburst galaxies (Verma et al., 2003; Dale et al., 2006, 2009). For the H ii galaxies, the nuclear [Ne III]15.56 m/[Ne II]12.81 m ratio is a factor 2-3 smaller than those measured in the extranuclear regions.
A similar behavior of increasing [Ne III]15.56 m/[Ne II]12.81 m ratios with increasing galactocentric distances has been observed in the nearby galaxies NGC 253 (Devost et al., 2004) and M82 (Beirão et al., 2008), although the physical scales probed are different (80 pc in these two galaxies, 1 kpc in our sample of LIRGs). Galactic H ii regions follow the same trend, with H ii regions at increasing distances from the galactic nucleus showing larger [Ne III]15.56 m/[Ne II]12.81 m ratios (Giveon et al., 2002).
Note that we did not correct this ratio for extinction. This correction however, only produces variations in the ratio of for the typical extinction of our sample (, that is A mag). The correction (positive or negative) depends on the adopted extinction law (see Farrah et al. 2007).
The strength of [Ne III]15.56 m relative to [Ne II]12.81 m decreases with increasing metallicity, increasing age of the stellar population and increasing nebular density (e.g., Snijders et al. 2007). In accordance with the luminosity- and mass-metallicity relations, LIRGs are characterized by uniformly relatively high metallicity (in many cases super-solar), with some indications of slightly (factor of two) reduced levels in their nuclei (Rupke et al., 2008). The Snijders et al. (2007) models predict a 3 times larger [Ne III]15.56 m/[Ne II]12.81 m ratio for a given age and density as the metallicity decreases from super-solar (2 Z⊙) to solar. Thus, metallicity-related effects are unlikely to be the dominant cause of the relative increase of [Ne III]15.56 m strength outside the central regions of these galaxies. They may in fact to be overcome by some stronger mechanism.
The trend with stellar population age is strong. The expected [Ne III]15.56 m/[Ne II]12.81 m ratio of an instantaneous burst of star formation falls below for ages 6 Myr (Rigby & Rieke, 2004). Thornley et al. (2000) showed that the range of the [Ne III]15.56 m/[Ne II]12.81 m ratio in starburst galaxies is compatible with models for bursts of star formation. However, from their models and those of Rigby & Rieke (2004), the nuclear values for LIRGs are below the range that would be expected from such star-forming episodes. The observed nuclear ratios could only be explained in terms of the stellar population if: (1) the IMF is truncated at 30 M⊙ in the LIRG nuclei (Thornley et al. 2000, Figure 6); or (2) the star formation rate in all the LIRG nuclei has decreased rapidly over the past 10-20 Myr (which seems contrived).
Another explanation is that due the high densities in the nuclear regions the [Ne III]15.56 m/[Ne II]12.81 m ratio is suppressed, including the possibility that a fraction of the most massive stars are hidden in ultra-compact H ii regions (Rigby & Rieke, 2004). The [Ne III]15.56 m/[Ne II]12.81 m ratio decreases by approximately a factor of two if the density increases from 103 to 105 cm-3 (Snijders et al., 2007). We explore the density effects on the neon line ratio in the following section.
Before doing so, we point out that a few galaxies (NGC 3690, NGC 5135 and NGC 7130) have an opposite trend in that the [Ne III]15.56 m/[Ne II]12.81 m ratio becomes larger in their nuclei. We attribute this behavior to the presence of active nuclei. These three galaxies are the only ones classified as Seyfert type and it is likely that the extra hard-ionizing radiation from the AGN is responsible for the high, three times larger than the median, [Ne III]15.56 m/[Ne II]12.81 m nuclear ratio.
5.2.2 The [S III]18.71 m/[Ne II]12.81 m Line Ratios
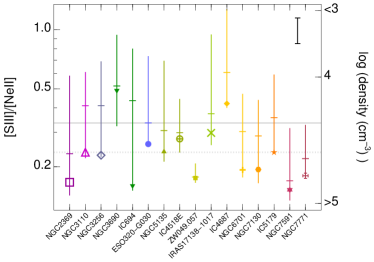
The excitation potentials of the [Ne II]12.81 m and [S III]18.71 m emission lines are 21.6 eV and 23.3 eV, respectively. Therefore, the [S III]18.71 m/[Ne II]12.81 m ratio is almost insensitive to the hardness of the radiation field. On the other hand, this ratio is a good tracer of density in the range cm-3, with lower [S III]18.71 m/[Ne II]12.81 m ratios indicating larger electron densities (Snijders et al., 2007).
Our spatially resolved measurements show that this ratio ranges from 0.1 to 1.25 (Figure 15). Assuming a 5 Myr old stellar population, an intermediate ionization parameter (q ) and solar metallicity (see caption of Figure 15), these ratios correspond to electron densities between and cm-3 (Snijders et al., 2007). Like the [Ne III]15.56 m/[Ne II]12.81 m ratio, for a given galaxy the lowest values of the [S III]18.71 m/[Ne II]12.81 m ratio occur in the nuclei (in most cases the nuclear value is between 0.13-0.25), while higher ratios are found around them (Figure 5). This indicates, as expected, that the nuclei are denser than the extranuclear H ii regions. According to this spatial distribution the integrated ratios (0.2-0.5) are 30% larger than the nuclear ratios.
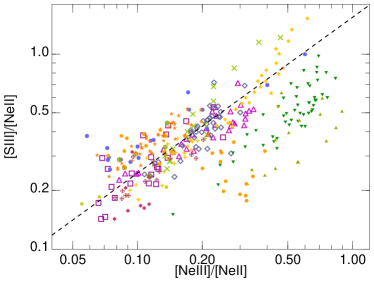
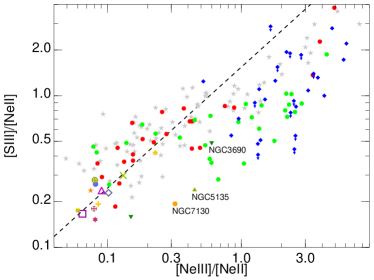
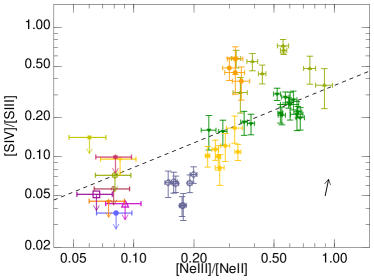
The left panel of Figure 16 shows the [S III]18.71 m/[Ne II]12.81 m ratio versus the [Ne III]15.56 m/[Ne II]12.81 m ratio from our spatially resolved measurements. As can be seen from this Figure, there is a tight correlation between the two line ratios if we exclude those galaxies hosting an active nucleus (NGC 3690, NGC 5135 and NGC 7130). The best linear fit to the data (excluding the AGNs) is:
| (2) |
Where y is the [S III]18.71 m/[Ne II]12.81 m ratio and x the [Ne III]15.56 m/[Ne II]12.81 m ratio. In the right panel of Figure 16 we plot the nuclear ratios of our LIRGs together with those of extranuclear H ii regions and nuclei of nearby galaxies (Dale et al., 2009), Seyfert galaxies (Tommasin et al., 2008) and quasars (Veilleux et al., 2009). Both diagrams show that, in general, for a given density (as traced by the [S III]18.71 m/[Ne II]12.81 m ratio) the AGNs show larger [Ne III]15.56 m/[Ne II]12.81 m ratios than starburst galaxies and H ii regions. The most straightforward explanation is that the ionizing photons from the active nucleus increase the radiation hardness (the [Ne III]15.56 m/[Ne II]12.81 m ratio). However some of the Seyfert galaxies and quasars are in the diagram close to H ii regions. These may be galaxies harboring an AGN as well as star formation. Moreover the position of the AGNs and starbursts in Figure 16 is consistent with models (Groves et al., 2004; Dopita et al., 2006).
5.2.3 The [S IV]10.51 m to [Ne III]15.56 m and to [S III]18.71 m Line Ratios
The [S IV]10.51 m and [Ne III]15.56 m lines arise from ions with a similar excitation potential, 35 eV and 41 eV, respectively. While the [Ne III]15.56 m line is detected in all galaxies, the [S IV]10.51 m line is detected in just six galaxies (40% of the sample). If the [S IV]10.51 m emission arises from silicate dust embedded regions, it can be heavily affected by extinction as it is inside the broad 9.7 m silicate feature. This seems to be the case in ULIRGs (Farrah et al., 2007). However, the depth of the silicate features in our sample of LIRGs are moderate, and generally much lower than in ULIRGs probably indicating lower extinction (see Section 4).
Using the photoionization models of Snijders et al. (2007), we can infer the expected range of [S IV]10.51 m/[Ne III]15.56 m ratios. The values for the range of densities, ionization parameters and stellar population ages covered by the models, excluding the most extreme cases, are compatible with the upper limits we measure. Moreover, we do not find any correlation between the [S IV]10.51 m/[Ne III]15.56 m ratio and the observed silicate strength (). Thus it is likely that the non-detection of the [S IV]10.51 m line is because its flux is under the detection limit.
The [S IV]10.51 m/[S III]18.71 m and the [Ne III]15.56 m/[Ne II]12.81 m ratios are well correlated and can be used to estimate the hardness of the radiation field (Verma et al., 2003; Dale et al., 2006; Gordon et al., 2008). Figure 17 shows that there is a good correlation between the [S IV]10.51 m/[S III]18.71 m and [Ne III]15.56 m/[Ne II]12.81 m ratios of the spatially resolved measurements for our star-forming LIRGs, and indeed, they approximately follow the correlation found by Gordon et al. (2008) for M101 H ii regions and starburst galaxies. The upper limits to the [S IV]10.51 m/[S III]18.71 m ratio are also consistent with this trend.
Two of the galaxies classified as active, NGC 5135 and NGC 7130, lie above the Gordon et al. (2008) correlation. A similar trend was found by Dale et al. (2006) for AGN in the [S IV]10.51 m/[S III]33.48 m versus the [Ne III]15.56 m/[Ne II]12.81 m diagram. A possible explanation is that extra [S IV]10.51 m emission is produced by the active nucleus. High spatial resolution ground-based observations of these two LIRGs indicate that most of the [S IV]10.51 m emission comes from the nucleus, whereas this line is not detected in the surrounding star-forming regions of these galaxies (Díaz-Santos et al., 2010). For the other two galaxies NGC 3690 (classified as Seyfert), and NGC 7591 (classified as composite, intermediate between H ii and LINER) the [S IV]10.51 m line is more likely to be affected by extinction, as both have nuclear , and thus the observed [S IV]10.51 m/[S III]18.71 m ratios are lower limits.
6. PAH Features
Models predict that the relative strength of the PAH bands depends on the ionization state (Draine & Li, 2001; Galliano, 2006). The 6.2 m PAH and 7.7 m PAH bands dominate the emission of ionized PAH, whereas the 11.3 m PAH is more intense for neutral PAHs. More complete models of PAH feature behavior have been published recently by Galliano et al. (2008), who explore the effects of the radiation field hardness and intensity as well as the size distribution of the PAH carriers.
6.1. Morphology
Figure 1 shows flux maps of three brightest PAH features present in the SL module at 6.2 m, 7.7 m and 11.3 m, together with the 5.5 m continuum maps. Table 5 shows the ratio between the flux arising from the central 2 kpc and the total emission. The 11.3 m PAH is clearly more extended than the 5.5 m continuum in 60% of the galaxies, arising also from more diffuse regions (see also Díaz-Santos et al. 2010). However, the nuclear contribution to the integrated 6.2 m PAH emission is comparable to that at the 5.5 m continuum, and only in 2 cases (NGC 7130 and NGC 7591) the 6.2 m PAH emission is more extended than the continuum. When comparing both PAHs, the 11.3 m PAH emission is more extended than the 6.2 m PAH emission in about 40% of the galaxies, while the opposite is never the case.
A direct comparison of the PAH ratios with fine structure line ratios is not possible because the low spectral resolution (R60-120) is not sufficient to separate the emission lines from the PAHs. Alternatively we used high resolution (R600) data to measure the fine structure lines and the 11.3 m PAH (Figure 4).
In general, the 11.3 m PAH emission appears to be more extended than the [Ne II]12.81 m line. The PAH emission is also more extended than the [Ne II]12.81 m[Ne III]15.56 m emission which, as discussed in Section 5, traces recent star formation. PAHs have also been used to measure the star formation, since they are a proxy, although not perfect, for the total infrared luminosity (Peeters et al., 2004; Smith et al., 2007b). From this comparison, it is clear that the 11.3 m PAH emission does not trace the same stars as the [Ne II]12.81 m emission line. In fact, Peeters et al. (2004) found that the 6.2 m PAH is not a good tracer of massive star formation (O stars) as seems to be the case of the 11.3 m PAH.
6.2. Extinction Effects on the PAH Ratios
As discussed above, models (Draine & Li, 2001; Galliano, 2006) predict that neutral PAHs show larger 11.3 m PAH to 6.2 m PAH and 11.3 m PAH to 7.7 m PAH ratios than ionized PAHs. Figures 2 and 3 show the SL spectral maps of the 11.3 m PAH/6.2 m PAH and 11.3 m PAH/7.7 m PAH ratios, respectively. The 11.3 m PAH/6.2 m PAH ratio spans a factor of 2, from 0.45 to 1.15 and the 11.3 m PAH/7.7 m PAH ratio range is . These ranges are similar to those found in starburst galaxies (Brandl et al., 2006).
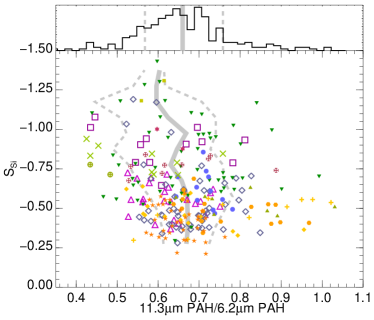
The 11.3 m PAH is affected by the broad 9.7 m silicate feature, thus in highly obscured regions the the 11.3 m PAH/6.2 m PAH and the 11.3 m PAH/7.7 m PAH ratios can be underestimated. An example of this is the southern nucleus of NGC 3256, one of the most obscured regions ( = -1.4) in the sample. Its 11.3 m PAH/6.2 m PAH ratio is lower than that in the surrounding regions.
To explore the effects of the 9.7 m silicate feature on the PAH ratios, we compare the 11.3 m PAH/6.2 m PAH ratio and for the spatially resolved measurements of our LIRGs in Figure 18 (left panel). A similar figure was presented by Brandl et al. (2006) for the nuclear regions of starburst galaxies. They found that the extinction can change the relative strength of the PAHs by up to a factor of 2. We find, however, that the median value of the 11.3 m PAH/6.2 m PAH ratio is approximately constant for silicate strengths weaker than , and only deeper silicate absorptions seem to affect the 11.3 m PAH/6.2 m PAH ratio. Some caution is needed here because there are very few regions in our sample with silicate strengths stronger than .
As an alternative approach, we corrected these PAH ratios for extinction using the spatially resolved measurements of the . We assumed a foreground screen dust geometry and the extinction law of Smith et al. (2007b). For a typical value of the silicate strength in our sample of , this extinction reduces the 11.3 m PAH to 6.2 m PAH and to 7.7 m PAH ratios by . If we increase the silicate strength up to the reduction is . These are much less than the factor of 2 variations in the 11.3 m PAH/6.2 m PAH ratio observed in some galaxies (e.g., NGC 3256, NGC 3110, NGC 6701), at an almost constant value of . Thus, we conclude that the observed variations in the PAH ratios are real, and do not significantly depend on the extinction, at least for regions in our sample of LIRGs with relatively shallow silicate absorptions (.
6.3. Nuclear vs. Integrated PAH Ratios
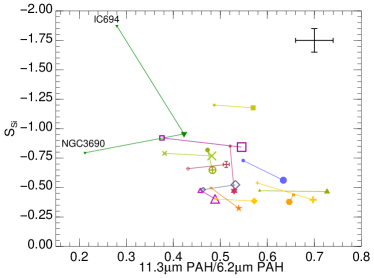
The right panel of Figure 18 compares the 11.3 m PAH/6.2 m PAH ratio vs values of the nuclear spectra and the integrated spectra. The general trend is that the integrated spectra have shallower silicate absorptions ( lower , on average) and slightly larger (, on average) 11.3 m PAH/6.2 m PAH ratios.
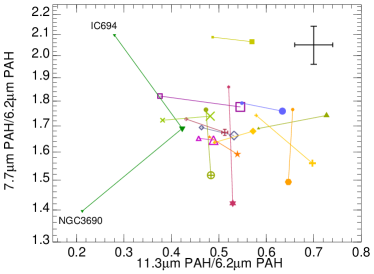
In Figure 19 we represent the 11.3 m PAH/6.2 m PAH ratio versus 7.7 m PAH/6.2 m PAH ratio, comparing the nuclear and the integrated values of each galaxy. The distribution of the values of the ratio is approximately uniform. However it is interesting to note two clearly different behaviors. The majority of the galaxies show a small variation of the 7.7 m PAH/6.2 m PAH ratio and a somewhat larger 11.3 m PAH/6.2 m PAH ratio in the integrated spectrum. This behavior is expected, since the 7.7 m PAH and 6.2 m PAH are related to ionized PAHs and the 11.3 m PAH to neutral PAHs. The ionized PAHs emission is concentrated in the nuclear regions, but the there is a substantial amount of the 11.3 m PAH emission arising from diffuse regions throughout the galaxies (see Section 6.1). This explains the larger integrated 11.3 m PAH/6.2 m PAH ratios of all the LIRGs (see Table 2).
Some galaxies, however, show a completely different behavior, with an almost constant 11.3 m PAH/6.2 m PAH ratio but a lower 7.7 m PAH/6.2 m PAH ratio in the integrated spectrum. The most extreme cases of this behavior are NGC 7130 and NGC 7591. Galliano et al. (2008) showed that the 7.7 m PAH/6.2 m PAH ratio is very sensitive to the size distribution of the PAHs, with smaller PAH molecules producing lower 7.7 m PAH/6.2 m PAH ratios. One possibility is that smaller PAH molecules are destroyed in harsher environments, such as those of Seyfert and LINER nuclei. The destruction of small PAHs might suppress the nuclear 6.2 m PAH emission. This may lead to the different behavior observed in the AGN/LINER nuclei in Figure 19. Moreover, the absolute value of the ratio seems to give little information about the nature, starburst or AGN, of the nuclei and we can only distinguish them by the relative variation between nuclear and integrated ratios.
6.4. The Effects of the Radiation Field
Since the [Ne III]15.56 m/[Ne II]12.81 m ratio is a proxy for the hardness of the radiation field, we can compare the spatial variations of this ratio with those of the 11.3 m PAH/6.2 m PAH to ascertain if the radiation field has an effect on the PAH ratios. A comparison between Figures 2 and 5 indicates that the 11.3 m PAH/6.2 m PAH ratio does not decrease necessarily in regions of enhanced [Ne III]15.56 m/[Ne II]12.81 m ratios.
On the other hand, the morphology of the 11.3 m PAH/7.7 m PAH ratio (Figure 3) resembles that of the [Ne III]15.56 m/[Ne II]12.81 m ratio. However this resemblance is the opposite of what one would expect. Both ratios present their minima in the nuclear regions for most of the galaxies. Thus while the observed nuclear [Ne III]15.56 m/[Ne II]12.81 m ratio would indicate lower radiation hardness in the nuclei, the PAH ratio would suggest a larger ionization state. Again, it is likely that the typical radiation field hardness observed in our sample of LIRGs is not sufficiently large as to affect the PAH emission, as is the case of the low metallicity galaxies of Wu et al. (2006). Another possible interpretation is that the PAHs and the neon emission are related to different physical processes that due to our limited spatial resolution we cannot separate. As a result, the bulk of the 7.7 m PAH emission may be produced in star-forming regions, while the 11.3 m PAH emission also comes from diffuse regions. Thus, low values of the 11.3 m PAH/7.7 m PAH ratio trace H ii regions, and larger values indicate less recent star formation. The latter interpretation is similar to that of Galliano et al. (2008). They find that the lowest values of the 11.3 m PAH/7.7 m PAH ratio are associated with the brightest PAH emission. However, in their galaxies, the 11.3 m PAH/6.2 m PAH ratio follows the same trend, whereas this is not the case for the LIRGs studied here. Alternatively, as discussed in the previous section, the size of the grains may affect this ratio. If the smaller grains are favored in and around the nucleus, the 7.7 m PAH emission would be increased respect the 11.3 m PAH emission. As consequence the 11.3 m PAH/7.7 m PAH ratio would be lower in the nucleus.
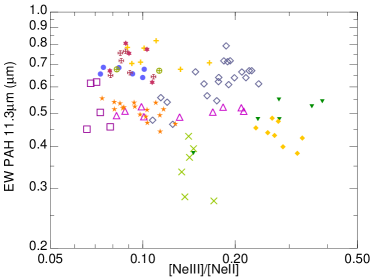
Brandl et al. (2006) studied the dependency of the EW of the PAHs with the radiation hardness for a sample of high metallicity starburst galaxies. Wu et al. (2006) carried out a similar study, but for low metallicity galaxies. Whereas Brandl et al. (2006) found that this dependency does not exist, Wu et al. (2006) found the opposite, that is, the harsher radiation of low metallicity galaxies field lowers the PAH EW. Eventually Gordon et al. (2008) showed that the reason for the discrepancy is the different range of the radiation field hardness in high and low metallicity galaxies. In particular, Gordon et al. (2008) found that for ionizations above a certain threshold there is a correlation between the radiation hardness and the PAH EW, but for lower ionizations this dependency disappears. We show in Figure 20 the EW of the 11.3 m PAH and the [Ne III]15.56 m/[Ne II]12.81 m ratio of those galaxies not classified as AGN. The ionization and metallicity of our LIRGs are similar to those galaxies studied by Brandl et al. (2006) and, similarly to their findings, there is no correlation between these parameters in our sample of LIRGs.
6.5. Dependency on the Age of the Stellar Population
Since the [Ne II]12.81 m emission traces young stellar populations (10 Myr), and since the 11.3 m PAH feature can also be excited by older populations (see Peeters et al. 2004 and Section 6.1), the [Ne II]12.81 m/11.3 m PAH ratio can give us an indication of age variations throughout the galaxies (Díaz-Santos et al., 2010). As can be see from Figure 5, the [Ne II]12.81 m/11.3 m PAH ratio ranges from 0.1 to 0.6 for our sample of LIRGs. In some LIRGs (e.g., NGC 6701, NGC 7130, NGC 7771, IC 4687) the [Ne II]12.81 m/11.3 m PAH ratio appears enhanced in the high surface brightness H ii regions (see the HST/NICMOS Pa images in Figure 4) with respect to regions of more diffuse emission. In other galaxies the interpretation might not be as straightforward. In some cases the IRS angular resolution is not sufficiently high to isolate the circumnuclear H ii regions (e.g., NGC 5135), and the age differences may be smoothed out.
7. Molecular hydrogen
We constructed maps of the molecular hydrogen emission using the pure rotational lines H2 S(1) at 17.0 m and the H2 S(2) at 12.3 m (Figure 4). These lines trace warm (300 K T 1000 K) molecular gas in the interstellar medium. The H2 S(1) morphology appears, generally, different from that of the fine structure lines, which are associated with the ionized gas medium. There are also differences in the velocity fields that will be discussed in Section 8. Using the same procedure as described in Section 5.1 we find that the H2 S(1) emission is more extended than the 15 m continuum in 60% of the sample. In most of these galaxies the size of the H2 S(1) emitting region is larger than that of the fine structure lines (see Table 5).
7.1. Temperatures, Column Densities and Masses
We extracted the nuclear spectra of all galaxies using a 13.4”13.4” aperture. This aperture corresponds to physical scales between 3 and 5 kpc depending on the galaxy. This aperture size is different from that used in the other Sections because now we are limited by the lowest spatial resolution of the LH module, where the H2 S(0) line at 28.2 m lies. The fluxes of the H2 lines measured from these spectra are listed in Table 6.
The temperature of the warm molecular hydrogen was calculated as described by Roussel et al. (2007). We assumed an ortho-to-para ratio (Rigopoulou et al., 2002; Roussel et al., 2007), and thus this assumption may introduce some uncertainty as it is used in the temperature calculations. The column densities and masses are highly dependent on the H2 lines used in these calculations. It is preferable to use the lines H2 S(0) and H2 S(1) because they come from the lowest rotational levels of the hydrogen molecule, and therefore they trace the molecular hydrogen gas at the lowest temperatures which dominates determination of the masses (Roussel et al., 2007). However the H2 S(0) line is not detected in all galaxies, and to allow meaningful comparisons we estimated the column densities and masses with the H2 S(1) and H2 S(2) lines. The results are presented in Table 7. The masses estimated from the H2 S(1) and H2 S(0) lines are in the range 0.4 to 3 M⊙. These values are comparable to those found in ULIRGs (Higdon et al., 2006), local starbursts and Seyfert galaxies (Rigopoulou et al., 2002; Tommasin et al., 2008). It should be noted that these masses correspond to a beam size of 13.4”13.4” which does not include all the molecular hydrogen emission. Then the mass values listed in Table 7 should be considered as lower limits to the total H2 mass of the galaxy. For instance the integrated fluxes of the H2 S(1) line (Table 3) are a factor of between two and three larger than those used in the mass calculations (Table 6). Thus assuming that the physical conditions of the H2 in the outer parts of the galaxy are similar to those in the inner 3-5 kpc, the total mass would be at least a factor of 2-3 larger than the values listed in Table 7.
7.2. Excitation Mechanism and Relation to the PAH Emission
Studies of the molecular hydrogen emission of galactic PDRs indicate that the formation of H2 occurs in the surfaces of PAHs (see e.g., Habart et al. 2003; Velusamy & Langer 2008) as both the PAH carriers and molecular hydrogen can be excited by UV radiation. Thus the H2 and the PAH emission morphologies are correlated in these regions. A similar correlation is seen in external galaxies (Rigopoulou et al., 2002; Roussel et al., 2007). However, H2 can be excited by other mechanisms, such as X-rays (e.g., Lepp & McCray 1983) and shock fronts (e.g., Hollenbach & McKee 1989).
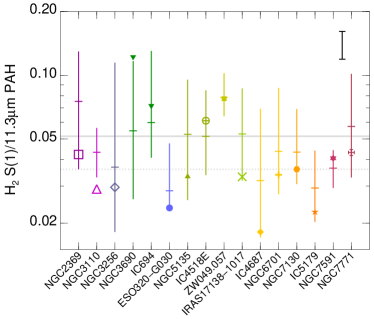
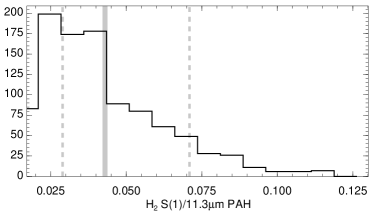
To explore the morphological differences we constructed maps of the H2 S(1)/11.3 m PAH ratio. The range of this ratio for each galaxy is shown in Figure 21. This ratio varies by a factor of 10 in our sample of LIRGs, although, as can be seen in the Figure 22, 68% of the values are in a narrower range, from 0.028 to 0.073. Figure 23 shows the ratio maps of those galaxies with the most noticeable morphological characteristics.
The 11.3 m PAH feature falls close to the the 9.7 m silicate absorption and, although the H2 S(1) is also close to the silicate absorption at 18 m, extinction variations could increase artificially the H2 S(1)/11.3 m PAH ratio. We used the extinction curve adopted by Smith et al. (2007b) to quantify this effect. If we assume a mixed model for the dust distribution, the ratio can be increased by up to a factor of 1.4, for the typical silicate absorption observed in our sample of LIRGs. Which is much lower than the observed variation. Choosing a screen geometry, to increase the ratio by a factor of 2 we would need an optical extinction of A100 mag, which is much larger than our estimates (Section 4). Therefore, the effect of the extinction is small compared to the observed variations of the H2 S(1)/11.3 m PAH ratio.
We can try to distinguish among the different excitation mechanisms by comparing the 11.3 m PAH morphology with that of the H2 emission (Figure 4). It is clear that the morphologies are different. The H2 S(1) emission is more extended than the PAH emission, although the maxima of both emissions are located in the nucleus for most of the galaxies. The only exception is NGC 3256 where the H2 S(1) peaks at the southern nucleus while the PAH maximum is located at northern nucleus. We note, however, that the southern nucleus of this galaxy is very obscured (see Figure 8, and Díaz-Santos et al. 2010), and the 11.3 m PAH map is not corrected for extinction. This suggests that the warm H2 in LIRGs is produced not only in PDRs, but that the other mechanisms also play a role.
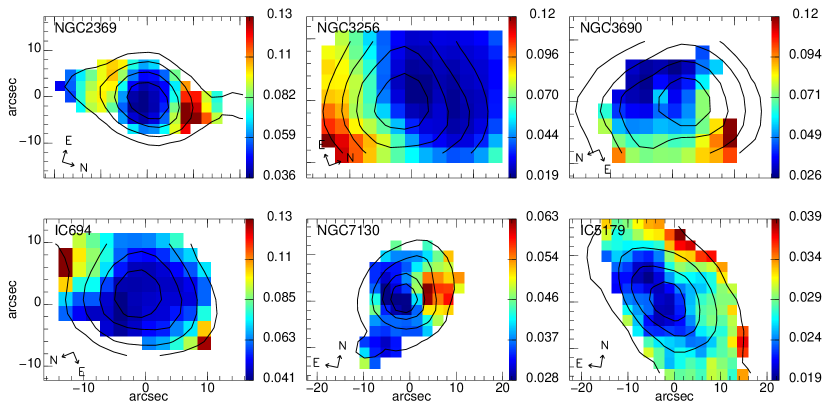
We attribute the increased values of the H2 S(1)/11.3 m PAH ratio, not to a deficiency of PAH emission, but rather to an excess emission by H2, excited by X-ray or shocks. For instance, in the merger system NGC 3256, the largest value of the ratio occurs where the components of the merger are colliding. The H2 line ratios are inconsistent with X-ray excitation (Shaw et al., 2005). Thus, it is likely that there is some contribution from shocks to the H2, as appears also to be the case for some regions in NGC 3690 and IC 694 (Alonso-Herrero et al., 2009b). In many cases, the hypothesis of shock excitation is supported by large velocity dispersions (see García-Marín et al. 2006 for NGC 3690/IC 694 and the following section for additional examples).
The galaxy IC 5179 is interesting because its velocity field (see next section) is highly ordered, so strong shocks are unlikely, and its X-ray luminosity is low. Thus the H2 emission in this galaxy is likely to be produced in PDRs. The small variations (a factor of 2) of the H2 S(1)/11.3 m PAH ratio are probably due to differences in the extinction or differences in the 11.3 m PAH relative strength with respect to the total PAH luminosity from region to region. For the rest of the galaxies, the morphology of H2 S(1)/11.3 m PAH ratio does not allow us to determine whether the H2 is produced in PDRs or is excited by shock fronts or X-ray.
8. Velocity Fields
Figure 10 shows the velocity fields of the [Ne II]12.81 m and H2 S(1) emission lines in the SH module. They cover 30”30”, which corresponds to physical scales of 6-11 kpc, depending on the galaxy. Most of the [Ne II]12.81 m velocity fields are consistent with a rotating disk, although some of them show more complex morphologies (NGC 3110, NGC 3256, IC 694, NGC 6701 and NGC 7130). Only two of the galaxies (NGC 3256 and IC 694) with perturbed velocity fields are part of merger systems. NGC 3110 and NGC 7130 are paired with other galaxies. However not all the galaxies in groups present disturbed velocity fields (e.g., NGC 7771, IC 4518E), at least on the physical scales (kpc) probed by the IRS spectral maps.
Figure 24 shows the velocity field of the interacting system Arp 299 (IC 694 and NGC 3690) rotated to the usual north up east to the left orientation for easy comparison with other works. The [Ne II]12.81 m velocity field, which traces the ionized gas, agrees well with that measured from H (see García-Marín et al. 2006). The peak-to-peak variation of the velocity field is 250 km s-1 also comparable to that measured from H. The warm molecular gas (300 K T 1000 K) velocity field, traced by the H2 S(1) line, it is similar to the [Ne II]12.81 m field (Figure 24), as both rotates in the same sense, although there are differences. The molecular hydrogen velocity field does not present the irregular structure of the ionized gas and the neutral gas (see García-Marín et al. 2006). However, the H2 S(1) velocity field resembles that produced by two disks rotating in opposite sense. This suggests that before the interaction both galaxies were spirals (Augarde & Lequeux, 1985). Moreover the H2 S(1) velocity field shows evident similarities with the CO velocity field (see Aalto et al. 1997; Casoli et al. 1999).
H velocity fields are available for NGC 3256 (Lípari et al., 2000), NGC 6701 and NGC 7771 (Alonso-Herrero et al., 2009a) and NGC 7591 (Amram et al., 1994). The [Ne II]12.81 m velocity field of NGC 3256 appears perturbed due the merger nature of this galaxy. It is consistent with the H velocity field in shape and amplitude. The H velocity maps of NGC 7771 and NGC 6701 are slightly smaller than those presented here. NGC 7771 has and ordered velocity field compatible with a rotating disk whereas NGC 6701 presents a complex morphology both in H and mid-IR emission lines. The structure and the peak-to-peak velocity amplitude (300 km s-1 for NGC 7771 and 150 km s-1 for NGC 6701) of the [Ne II]12.81 m velocity field are in good agreement with those of the H velocity field. As in the previous cases, the H velocity field of NGC 7591 is also similar to that of the [Ne II]12.81 m.
9. Conclusions
We presented the analysis of Spitzer/IRS mapping observations of 15 local LIRGs with extended Pa emission. We studied the spatial distribution of the mid-IR spectral features and compared the nuclear and integrated spectra. We calculated fine structure line and PAH ratios which trace the physical conditions in the star-forming regions. The main results are the following:
-
•
We used the 9.7 m silicate feature strength vs. 6.2 m PAH equivalent width diagram to classify the activity of the LIRGs. There is a good agreement with the optical classification and this diagram. Most of the LIRGs populate the pure starburst class and only the nuclei classified as Seyfert from optical spectroscopy appear in the diagram in the AGN/SB class. The integrated values show, in general, larger 6.2 m PAH EW and shallower silicate absorption than the nuclear spectra. That is, the extended star formation partially masks the nuclear activity, resulting in a starburst-like integrated spectra. The silicate feature strength, nuclear and integrated, of our sample of local LIRGs () is small compared to that found in ULIRGs ( up to -4).
-
•
We constructed maps of the spatial distribution of the [Ne III]15.56 m/[Ne II]12.81 m, which traces the radiation field hardness, and the [S III]18.71 m/[Ne II]12.81 m that varies with the electron density. In general, the minimum of both ratios is located at the nucleus. The nuclear [Ne III]15.56 m/[Ne II]12.81 m ratio is below the expected range derived by star-formation models. A possible explanation is that due the high densities in the nuclear regions this ratio is suppressed, including the possibilities that the most massive stars are either missing of buried in ultracompact H ii regions. Alternatively the star formation rate may have decreased rapidly in all nuclei over the last 10-20 Myr.
-
•
We find a positive correlation between the [Ne III]15.56 m/[Ne II]12.81 m and [S III]18.71 m/[Ne II]12.81 m ratios for star forming regions in our sample of LIRGs and other starburst galaxies. On the other hand, AGNs, for a given [S III]18.71 m/[Ne II]12.81 m ratio, show a systematically larger [Ne III]15.56 m/[Ne II]12.81 m ratio. The few starburst galaxies where we detect the [S IV]10.51 m emission line follow the correlation between the [S IV]10.51 m/[S III]18.71 m and [Ne III]15.56 m/[Ne II]12.81 m observed in H ii regions in other galaxies. We observe larger [S IV]10.51 m/[S III]18.71 m ratios for those galaxies harboring an AGN.
-
•
We find that the 11.3 m PAH emission is more extended than that of the 5.5 m continuum. However, the ratio of the nuclear (2 kpc) 6.2 m PAH emission with respect to the integrated emission is comparable to that of the 5.5 m continuum in most cases. We find no correlation between the [Ne III]15.56 m/[Ne II]12.81 m ratio and the 11.3 m PAH EW, thus the effect of the radiation field hardness in the PAH emission, for the [Ne III]15.56 m/[Ne II]12.81 m ratio range in our sample of LIRGs, may not be important. We propose that the 11.3 m PAH/7.7 m PAH ratio depends on the age of the stellar population. While the 7.7 m PAH comes from young star-forming regions, the 11.3 m PAH arises also from diffuse medium, thus the 11.3 m PAH/7.7 m PAH is lower in young H ii regions. We also found that large [Ne II]12.81 m/11.3 m PAH ratios may indicate recent star formation.
-
•
We explored the variation of the PAH ratios across the galaxies. In most cases these variations are real, that is, they are not due to extinction). In general the integrated 11.3 m PAH/6.2 m PAH ratios are larger than the nuclear values, probably indicating that the integrated emission includes more neutral conditions. The nuclear and integrated 7.7 m PAH/6.2 m PAH ratios are almost constant, except in the nuclei of galaxies classified as AGN where this ratio is higher. Since the 6.2 m PAH emission is more associated to small molecules, the increased 7.7 m PAH/6.2 m PAH ratio in AGN could be explained if the small PAH molecules are more easily destroyed in the harsh environments of active nuclei.
-
•
Using the H2 S(0) at 28.2 m and the H2 S(1) at 17.0 m lines integrated over 13”13” (3 to 5 kpc) we estimated the mass of the warm (T300 K) molecular hydrogen. It ranges from 0.4 to 2.6108M⊙, and they are similar to those of ULIRGs, local starbursts and Seyfert galaxies. However these masses are lower limits since it is only included the H2 emission from the central few kpc of the galaxies and the total mass of warm molecular hydrogen is likely to be, at least, a factor of 2 larger.
-
•
The similarity between the PAHs and molecular hydrogen morphologies suggests that the main excitation mechanism of the latter is the UV radiation too. However there are some regions with an excess of H2 emission with respect to the PAH emission, thus the other mechanisms should contribute noticeably to the H2 emission. Some of these regions are associated to interacting systems, where large scale shocks may also play a role in exciting the molecular hydrogen.
-
•
Despite the modest spectral resolution of the SH module, we show that useful velocity information can be obtained from the SH spectra. For most of the galaxies and on the physical scales probed by the IRS spectra (kpc) the velocity fields are comparable with that produced by a rotating disk. For the galaxies with available H velocity fields, the [Ne II]12.81 m velocity fields are in good agreement with those of the H, both in shape and peak-to-peak velocities.
Acknowledgements
The authors would like to thank Takashi Hattori, M. Agúndez, B. Groves and Dimitra Rigopoulou for their help and enlightening discussions, as well as to Miwa Block for producing some of the data cubes. We thank the anonymous referee for the useful comments and suggestions, which significantly improved this paper.
MP-S acknowledges support from the CSIC under grant JAE-Predoc-2007. Support for this work was provided by NASA through contract 1255094 issued by JPL/California Institute of Technology. MP-S, AA-H, LC, and TD-S acknowledge support from the Spanish Plan Nacional del Espacio under grant ESP2007-65475-C02-01. AA-H also acknowledges support for this work from the Spanish Ministry of Science and Innovation through Proyecto Intramural Especial under grant number 200850I003. TDS acknowledges support from the Consejo Superior de Investigaciones Científicas under grant I3P-BPD-2004. PGP-G acknowledges support from the Ramón y Cajal Program financed by the Spanish Government and the European Union, and from the Spanish Programa Nacional de Astronomía y Astrofísica under grants AYA 2006–02358 and AYA 2006–15698–C02–02. This research has made use of the NASA/IPAC Extragalactic Database (NED), which is operated by the Jet Propulsion Laboratory, California Institute of Technology, under contract with the National Aeronautics and Space Administration.
| RAaaCoordinates of the nucleus of the galaxy. | DecaaCoordinates of the nucleus of the galaxy. | vhelbbHeliocentric velocity from the IRS nuclear spectrum of each galaxy. | Dist.ccDistance calculated using the measured heliocentric velocity and our cosmology. | Scale | Spect. | ||||
|---|---|---|---|---|---|---|---|---|---|
| Target | IRAS Name | (J2000.0) | (J2000.0) | (km s-1) | (Mpc) | (pc arcsec-1) | LIRddLogarithm of the L(8-1000 m), as defined in Sanders & Mirabel (1996), in solar luminosities ( W). It is calculated using the IRAS fluxes from Sanders et al. (2003) and from Surace et al. (2004), the measured redshift, and our cosmology. | classeeClassification of the nuclear activity from optical spectroscopy. Composite indicates intermediate LINER/H ii classification. The references for the nuclear classification are given in Alonso-Herrero et al. (2006), except for NGC 3690 (García-Marín et al., 2006), NGC 6701 and NGC 7591 (Alonso-Herrero et al., 2009a). | AORffAstronomical Observation Request key. |
| NGC 2369 | IRAS F07160-6215 | 07 16 37.75 | -62 20 37.5 | 3196 | 46.0 | 220 | 11.1 | - | 17659392 |
| NGC 3110 | IRAS F10015-0614 | 10 04 02.12 | -06 28 29.1 | 5014 | 72.5 | 350 | 11.2 | H ii | 17659648 |
| NGC 3256 | IRAS F10257-4339 | 10 27 51.28 | -43 54 13.5 | 2790 | 40.1 | 190 | 11.6 | H ii | 17659904 |
| NGC 3690**NGC 3690 and IC 694 are the two components, western and eastern respectively, of the interacting system Arp 299 | IRAS F11257+5850 | 11 28 30.80 | +58 33 44.0 | 3121 | 44.9 | 220 | 11.8 | Sy2 | 17660160 |
| IC 694**NGC 3690 and IC 694 are the two components, western and eastern respectively, of the interacting system Arp 299 | 11 28 33.80 | +58 33 46.5 | H ii | 17660416 | |||||
| ESO320-G030 | IRAS F11506-3851 | 11 53 11.72 | -39 07 48.7 | 3038 | 43.7 | 210 | 11.2 | H ii | 17660672 |
| NGC5135 | IRAS F13229-2934 | 13 25 44.06 | -29 50 01.2 | 4074 | 58.8 | 280 | 11.2 | Sy2 | 17660928 |
| IC4518E | IRAS F14544-4255 | 14 57 44.80 | -43 07 53.0 | 4584 | 64.5 | 320 | 11.2 | - | 21927936 |
| Zw049.057 | IRAS F15107+0724 | 15 13 13.12 | +07 13 31.7 | 3858 | 55.6 | 270 | 11.2 | H ii | 17661184 |
| IRAS17138-1017 | IRAS F17138-1017 | 17 16 35.80 | -10 20 39.4 | 5161 | 74.7 | 360 | 11.4 | H ii | 17661440 |
| IC4687 | IRAS F18093-5744 | 18 13 39.83 | -57 43 31.2 | 5105 | 73.8 | 360 | 11.5 | H ii | 17665024 |
| NGC6701 | IRAS F18425+6036 | 18 43 12.46 | +60 39 12.0 | 3896 | 56.2 | 270 | 11.0 | Composite | 21928448 |
| NGC7130 | IRAS F21453-3511 | 21 48 19.40 | -34 57 04.9 | 4837 | 69.9 | 340 | 11.4 | LINER/Sy2 | 17661696 |
| IC5179 | IRAS F22132-3705 | 22 16 09.09 | -36 50 37.5 | 3363 | 48.4 | 230 | 11.2 | H ii | 17661952 |
| NGC7591 | IRAS F23157+0618 | 23 18 16.28 | +06 35 08.9 | 4907 | 70.9 | 340 | 11.0 | Composite | 21928960 |
| NGC7771 | IRAS F23488+1949 | 23 51 24.88 | +20 06 42.6 | 4302 | 62.1 | 300 | 11.4 | H ii | 21929472 |
| Nuclear | Integrated | ||||||||||||
|---|---|---|---|---|---|---|---|---|---|---|---|---|---|
| PAH EWbbEquivalent width units are m. | PAH EWbbEquivalent width units are m. | ||||||||||||
| Name | SizeaaProjected square size of the aperture in kpc. The aperture size is 5.5”5.5” for all the galaxies. | SSi | 6.2 m | 11.3 m | SizeccApproximated projected square size of the aperture in kpc. See Section 3.3 for details. | SSi | 6.2 m | 11.3 m | |||||
| NGC2369 | 1.2 | -0.92 | 0.43 0.04 | 0.33 0.02 | 1.8 0.0 | 0.38 0.01 | 8.86.2 | -0.84 | 0.43 0.08 | 0.40 0.03 | 1.8 0.0 | 0.55 0.01 | |
| NGC3110 | 2.0 | -0.48 | 0.58 0.11 | 0.48 0.05 | 1.7 0.0 | 0.46 0.01 | 15.49.8 | -0.40 | 0.73 1.02 | 0.53 0.05 | 1.6 0.3 | 0.49 0.06 | |
| NGC3256 | 1.1 | -0.48 | 0.53 0.02 | 0.33 0.01 | 1.7 0.0 | 0.46 0.01 | 7.63.8 | -0.52 | 0.59 0.02 | 0.43 0.01 | 1.7 0.0 | 0.53 0.01 | |
| NGC3690**NGC 3690 and IC 694 are part of the interacting system Arp 299. | 1.2 | -0.80 | 0.11 0.01 | 0.045 0.001 | 1.4 0.1 | 0.21 0.01 | 8.35.7 | -0.96 | 0.29 0.01 | 0.21 0.01 | 1.7 0.1 | 0.42 0.03 | |
| IC694**NGC 3690 and IC 694 are part of the interacting system Arp 299. | 1.2 | -1.9 | 0.34 0.01 | 0.23 0.01 | 2.1 0.1 | 0.28 0.02 | 8.35.7 | -0.96 | 0.29 0.01 | 0.21 0.01 | 1.7 0.1 | 0.42 0.03 | |
| ESO320-G030 | 1.2 | -0.73 | 0.49 0.06 | 0.50 0.03 | 1.8 0.0 | 0.55 0.01 | 5.94.6 | -0.56 | 0.53 0.10 | 0.53 0.04 | 1.8 0.0 | 0.63 0.01 | |
| NGC5135 | 1.6 | -0.47 | 0.30 0.02 | 0.31 0.02 | 1.7 0.0 | 0.58 0.01 | 105.9 | -0.46 | 0.33 0.05 | 0.35 0.03 | 1.7 0.0 | 0.73 0.02 | |
| IC4518E | 1.8 | -0.82 | 0.39 0.28 | 0.44 0.17 | 1.8 0.2 | 0.47 0.05 | 6.46.4 | -0.65 | 0.62 0.39 | 0.53 0.16 | 1.5 0.1 | 0.48 0.03 | |
| ZW049.057 | 1.5 | -1.2 | 0.39 0.15 | 0.48 0.16 | 2.1 0.1 | 0.49 0.03 | 4.93.8 | -1.2 | 0.42 0.30 | 0.47 0.19 | 2.1 0.2 | 0.57 0.06 | |
| IRAS17138-1017 | 2.0 | -0.79 | 0.56 0.06 | 0.40 0.03 | 1.7 0.0 | 0.38 0.01 | 104.3 | -0.77 | 0.58 0.10 | 0.43 0.04 | 1.7 0.0 | 0.48 0.01 | |
| IC4687 | 2.0 | -0.40 | 0.66 0.08 | 0.55 0.03 | 1.6 0.0 | 0.49 0.01 | 135.8 | -0.38 | 0.64 0.11 | 0.54 0.04 | 1.7 0.0 | 0.57 0.01 | |
| NGC6701 | 1.5 | -0.54 | 0.46 0.07 | 0.45 0.05 | 1.7 0.0 | 0.58 0.01 | 136.5 | -0.40 | 0.53 0.12 | 0.52 0.05 | 1.6 0.0 | 0.70 0.02 | |
| NGC7130 | 1.9 | -0.44 | 0.25 0.04 | 0.23 0.04 | 1.8 0.1 | 0.66 0.02 | 128.2 | -0.38 | 0.47 0.10 | 0.37 0.05 | 1.5 0.0 | 0.65 0.02 | |
| IC5179 | 1.3 | -0.50 | 0.57 0.08 | 0.46 0.03 | 1.7 0.0 | 0.48 0.01 | 105.5 | -0.32 | 0.62 0.08 | 0.51 0.03 | 1.6 0.0 | 0.54 0.01 | |
| NGC7591 | 1.9 | -0.85 | 0.39 0.12 | 0.35 0.06 | 1.9 0.1 | 0.52 0.02 | 168.8 | -0.47 | 0.63 0.31 | 0.43 0.08 | 1.4 0.1 | 0.53 0.03 | |
| NGC7771 | 1.7 | -0.66 | 0.46 0.06 | 0.38 0.04 | 1.7 0.0 | 0.43 0.01 | 117.8 | -0.70 | 0.49 0.07 | 0.41 0.03 | 1.7 0.0 | 0.51 0.01 | |
| [S IV] | [Ne II] | [Ne III] | [S III] | H2 S(2) | H2 S(1) | |||
|---|---|---|---|---|---|---|---|---|
| Name | SizeaaApproximated projected square size of the aperture in kpc. See Section 3.3 for details. | 10.51m | 12.81m | 15.55m | 18.71m | 12.28m | 17.04m | 11.3 m PAH |
| NGC2369 | 9.76.2 | 5.5 | 194. 11. | 15. 3. | 44. 4. | 19. 6. | 51. 2. | 798. 34. |
| NGC3110 | 158.4 | 6.9 | 164. 14. | 30. 3. | 59. 5. | 5.1 | 33. 3. | 877. 29. |
| NGC3256 | 6.03.8 | 15. 3. | 1229. 48. | 189. 5. | 395. 8. | 65. 6. | 124. 3. | 2998. 30. |
| ESO320-G030 | 6.34.2 | 4.8 | 152. 7. | 12. 2. | 47. 5. | 13. 4. | 21. 2. | 677. 29. |
| NGC5135 | 9.05.0 | 19. 2. | 141. 12. | 66. 3. | 39. 3. | 14. 4. | 32. 2. | 593. 24. |
| IC4518E | 8.06.4 | 1.6 | 11. 1. | 0.90 0.32 | 3.7 1.0 | 1.0 | 2.1 0.5 | 34. 3. |
| ZW049.057 | 4.84.3 | 4.3 | 23. 3. | 2.2 | 1.4 | 6.1 | 7.9 1.0 | 89. 24. |
| IRAS17138-1017 | 11.55.8 | 3.9 | 159. 9. | 25. 1. | 54. 3. | 8.3 3.7 | 24. 2. | 505. 22. |
| IC4687 | 117.2 | 10. 2. | 198. 10. | 57. 2. | 103. 3. | 8.9 5.5 | 22. 1. | 750. 23. |
| NGC6701 | 8.15.4 | 14. | 117. 9. | 16. 3. | 32. 7. | 8.8 | 26. 3. | 600. 14. |
| NGC7130 | 1610 | 9.6 | 158. 14. | 36. 4. | 39. 7. | 7.0 | 29. 5. | 643. 29. |
| IC5179 | 106.9 | 9.2 | 290. 17. | 28. 3. | 91. 5. | 19. 5. | 35. 6. | 1334. 29. |
| NGC7591 | 8.86.8 | 5.8 | 54. 5. | 4.4 2.5 | 10. 3. | 3.6 | 10. 4. | 266. 13. |
| NGC7771 | 146 | 12. | 148. 11. | 9.2 | 41. 9. | 20. 10. | 41. 4. | 675. 23. |
Note. — Fluxes are expressed in units of . The fluxes of Arp 299 (NGC 3690/IC 694) are given in Alonso-Herrero et al. (2009b).
| [S IV] | [Ne II] | [Ne III] | [S III] | H2 S(2) | H2 S(1) | |||
|---|---|---|---|---|---|---|---|---|
| Name | SizeaaProjected square size of the aperture in kpc. The aperture size is 5.5”5.5” for all the galaxies. | 10.51m | 12.81m | 15.55m | 18.71m | 12.28m | 17.04m | 11.3 m PAH |
| NGC2369 | 1.2 | 0.44 | 52. 3. | 3.4 0.2 | 8.6 0.2 | 3.1 0.2 | 5.5 0.2 | 138. 3. |
| NGC3110 | 1.9 | 0.27 | 26. 1. | 2.4 0.1 | 6.2 0.2 | 1.3 0.3 | 2.8 0.1 | 99. 2. |
| NGC3256 | 1.1 | 1.8 0.3 | 260. 14. | 27. 1. | 60. 1. | 8.0 0.8 | 14. 1. | 489. 5. |
| ESO320-G030 | 1.2 | 0.39 | 41. 2. | 3.3 0.1 | 11. 0.1 | 2.8 0.3 | 4.0 0.1 | 172. 3. |
| NGC5135 | 1.6 | 8.0 0.2 | 51. 3. | 23. 1. | 12. 0.1 | 3.2 0.3 | 4.9 0.2 | 166. 3. |
| IC4518E | 1.8 | 0.082 | 1.1 0.1 | 0.13 0.02 | 0.24 0.08 | 0.13 0.05 | 0.34 0.05 | 5.4 0.5 |
| ZW049.057 | 1.5 | 0.26 | 10. 1. | 0.63 0.07 | 1.8 0.2 | 1.4 0.3 | 2.2 0.1 | 32. 3. |
| IRAS17138-1017 | 2.0 | 1.0 0.2 | 64. 3. | 8.5 0.2 | 19. 1. | 2.1 0.6 | 4.0 0.4 | 135. 3. |
| IC4687 | 2.0 | 2.3 0.2 | 55. 2. | 12. 0.1 | 23. 0.1 | 2.0 0.3 | 3.2 0.2 | 189. 3. |
| NGC6701 | 1.5 | 0.49 | 27. 2. | 2.3 0.1 | 5.1 0.2 | 1.9 0.2 | 3.4 0.2 | 103. 2. |
| NGC7130 | 1.9 | 3.6 0.4 | 38. 3. | 12. 1. | 7.4 0.6 | 1.7 0.8 | 2.9 0.3 | 93. 3. |
| IC5179 | 1.3 | 0.39 | 36. 2. | 2.7 0.1 | 8.5 0.3 | 1.4 0.1 | 2.6 0.1 | 120. 3. |
| NGC7591 | 1.9 | 0.24 | 16. 1. | 1.3 0.1 | 2.4 0.2 | 1.1 0.2 | 1.8 0.2 | 48. 2. |
| NGC7771 | 1.7 | 0.38 | 37. 2. | 3.0 0.1 | 6.7 0.4 | 3.0 0.5 | 4.8 0.2 | 115. 4. |
Note. — Fluxes are expressed in units of . The fluxes of Arp 299 (NGC 3690/IC 694) are given in Alonso-Herrero et al. (2009b).
| Central 2.0 kpc/ Integrated flux | Central 2.0 kpc/ Integrated flux | |||||||||
|---|---|---|---|---|---|---|---|---|---|---|
| 5.5 m | 6.2 m PAH | 11.3 m PAH | 15 m | [Ne II]12.81 m | [Ne III]15.56 m | H2 S(1) | ||||
| Name | continuum | continuum | ||||||||
| NGC2369 | 0.41 0.02 | 0.41 0.01 | 0.32 0.01 | 0.39 0.02 | 0.36 0.02 | 0.36 0.02 | 0.20 0.02 | |||
| NGC3110 | 0.13 0.05 | 0.12 0.02 | 0.10 0.01 | 0.13 0.01 | 0.07 0.03 | 0.12 0.02 | 0.08 0.03 | |||
| NGC3256 | 0.38 0.01 | 0.36 0.01 | 0.34 0.01 | 0.39 0.01 | 0.31 0.01 | 0.41 0.01 | 0.20 0.03 | |||
| ESO320-G030 | 0.57 0.02 | 0.54 0.01 | 0.49 0.01 | 0.48 0.01 | 0.49 0.02 | 0.40 0.01 | 0.38 0.02 | |||
| NGC5135 | 0.45 0.01 | 0.42 0.01 | 0.35 0.01 | 0.39 0.01 | 0.36 0.01 | 0.28 0.01 | 0.19 0.03 | |||
| IC4518E | 0.21 0.10 | 0.18 0.10 | 0.15 0.03 | 0.14 0.02 | - | 0.15 0.01 | 0.19 0.06 | |||
| ZW049.057 | 0.53 0.08 | - | 0.50 0.02 | 0.52 0.02 | - | 0.47 0.02 | - | |||
| IRAS17138-1017 | 0.31 0.03 | 0.31 0.02 | 0.25 0.01 | 0.31 0.01 | 0.27 0.01 | 0.19 0.01 | 0.15 0.05 | |||
| IC4687 | 0.24 0.03 | 0.25 0.01 | 0.23 0.01 | 0.19 0.01 | 0.17 0.01 | 0.15 0.01 | 0.13 0.05 | |||
| NGC6701 | 0.25 0.03 | 0.23 0.02 | 0.20 0.02 | 0.22 0.01 | 0.16 0.02 | 0.24 0.01 | 0.15 0.03 | |||
| NGC7130 | 0.28 0.02 | 0.13 0.03 | 0.14 0.02 | 0.14 0.01 | 0.21 0.03 | 0.10 0.01 | 0.09 0.05 | |||
| IC5179 | 0.23 0.03 | 0.20 0.01 | 0.18 0.01 | 0.19 0.01 | 0.16 0.02 | 0.11 0.01 | 0.13 0.03 | |||
| NGC7591 | 0.22 0.05 | 0.14 0.05 | 0.13 0.02 | 0.22 0.01 | 0.23 0.03 | 0.23 0.01 | 0.17 0.04 | |||
| NGC7771 | 0.24 0.02 | 0.28 0.02 | 0.23 0.01 | 0.24 0.01 | 0.20 0.03 | 0.23 0.01 | 0.12 0.04 | |||
| H2 S(2) | H2 S(1) | H2 S(0) | ||
|---|---|---|---|---|
| Name | SizeaaProjected square size of the aperture in kpc. The aperture size is 13.4”13.4” for all the galaxies. | 12.27 m | 17.03 m | 28.22 m |
| NGC2369 | 2.9 | 10. 1. | 19. 2. | 3.5 0.5 |
| NGC3110 | 4.6 | 4. 1. | 10. 0.9 | 1.6 0.2 |
| NGC3256 | 2.7 | 34. 3. | 61. 5. | 9. 3. |
| NGC3690 | 2.9 | 11. 4. | 22. 1. | 3.8 0.6 |
| IC694 | 2.9 | 20. 3. | 29. 1. | 5.7 0.9 |
| ESO320-G030 | 2.9 | 8.1 1.2 | 13. 1. | 1.7 0.7 |
| NGC5135 | 3.9 | 9.3 1.4 | 17. 1. | 1.3 0.5 |
| IC4518E | 4.4 | 0.3 0.1 | 1.1 0.2 | 1.0 0.1 |
| ZW049.057 | 3.7 | 3.3 0.8 | 5.8 0.4 | 0.6 |
| IRAS17138-1017 | 4.9 | 6.3 1.3 | 14. 1. | 1.9 0.5 |
| IC4687 | 4.9 | 6.5 1.1 | 12. 1. | 1.8 0.4 |
| NGC6701 | 3.7 | 4.6 0.8 | 10. 1. | 1.9 0.9 |
| NGC7130 | 4.6 | 4.2 1.7 | 9.9 0.7 | 1.4 0.3 |
| IC5179 | 3.2 | 6.3 0.8 | 11.2 0.8 | 1.4 0.2 |
| NGC7591 | 4.6 | 3.0 1.0 | 5.5 0.6 | 1.0 0.3 |
| NGC7771 | 4.1 | 8.7 1.2 | 16. 1. | 3.5 1.8 |
Note. — Fluxes are expressed in units of .
| T(S(0)-S(1)) | N0 | M0 | T(S(1)-S(2)) | N1 | M1 | |
|---|---|---|---|---|---|---|
| Name | (K) | ( cm-2) | ( M⊙) | (K) | ( cm-2) | ( M⊙) |
| NGC2369 | 168 | 8.8 | 1.3 | 348 | 5.1 | 0.73 |
| NGC3110 | 178 | 3.7 | 1.3 | 305 | 2.4 | 0.86 |
| NGC3256 | 181 | 19. | 2.1 | 369 | 12. | 1.3 |
| NGC3690 | 172 | 8.9 | 1.2 | 351 | 5.3 | 0.72 |
| IC694 | 163 | 15. | 2.0 | 415 | 7.8 | 1.1 |
| ESO320-G030 | 189 | 3.4 | 0.43 | 390 | 2.2 | 0.28 |
| NGC5135 | 236 | 1.9 | 0.44 | 361 | 1.5 | 0.36 |
| IC4518E | 108 | 9.2 | 2.7 | 252 | 3.0 | 0.87 |
| ZW049.057 | 205 | 1.0 | 0.22 | 373 | 0.74 | 0.16 |
| IRAS17138-1017 | 185 | 4.1 | 1.5 | 324 | 2.7 | 1.0 |
| IC4687 | 178 | 4.1 | 1.5 | 361 | 2.5 | 0.92 |
| NGC6701 | 168 | 4.7 | 1.0 | 323 | 2.8 | 0.61 |
| NGC7130 | 183 | 3.0 | 0.97 | 320 | 2.0 | 0.65 |
| IC5179 | 194 | 2.6 | 0.40 | 369 | 1.7 | 0.27 |
| NGC7591 | 167 | 2.5 | 0.85 | 362 | 1.4 | 0.48 |
| NGC7771 | 157 | 10.0 | 2.6 | 363 | 5.2 | 1.3 |
Note. — N0 and M0 are the column density and mass derived from the H2 lines S(0) and S(1). N1 and M1 correspond to the column density and mass derived from the S(1) and S(2) lines.
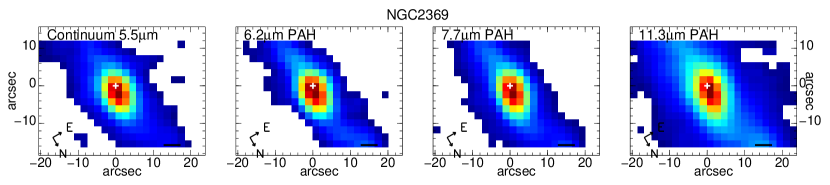
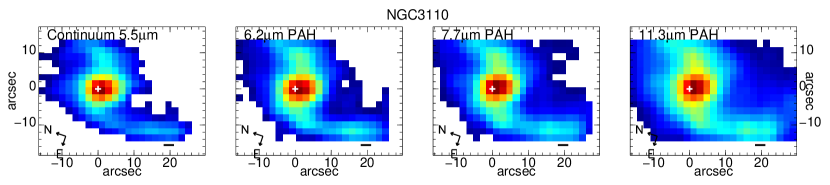
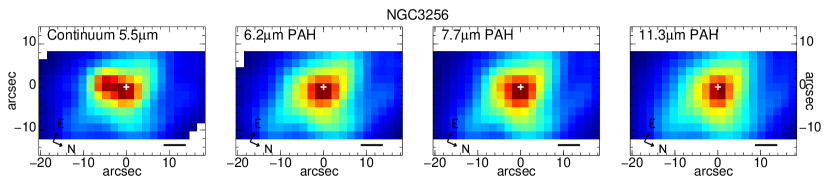
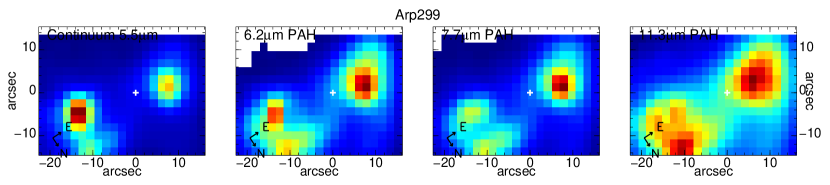
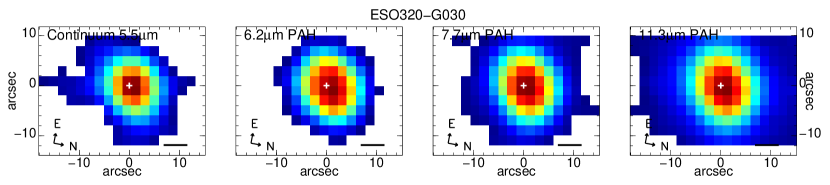
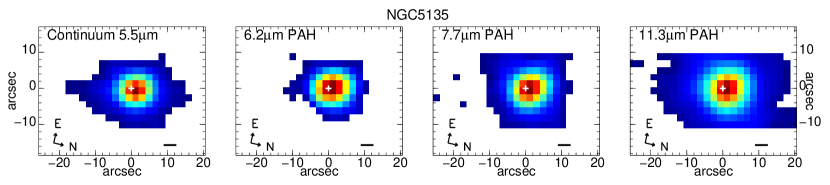
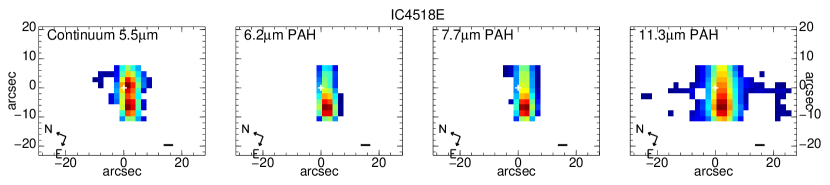
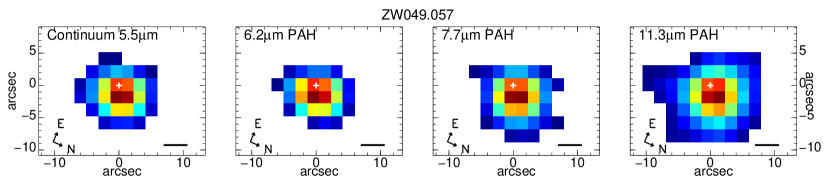
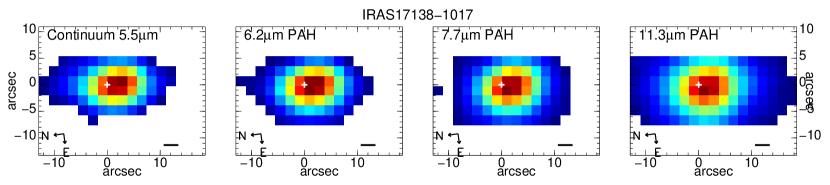
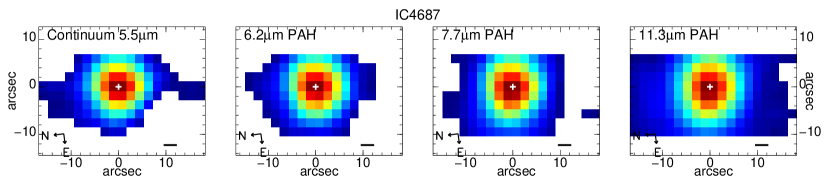
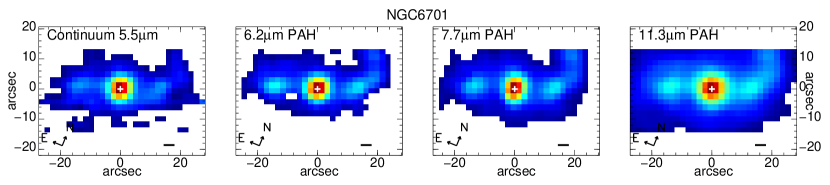
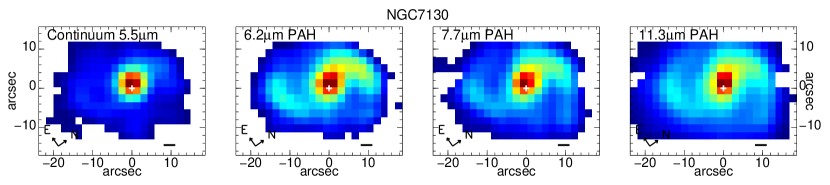
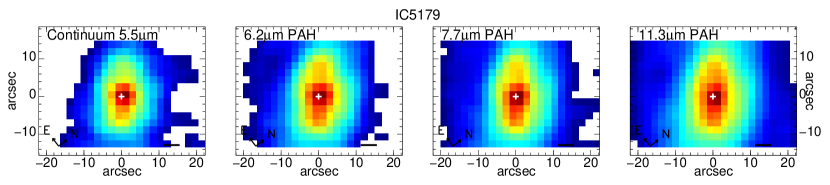
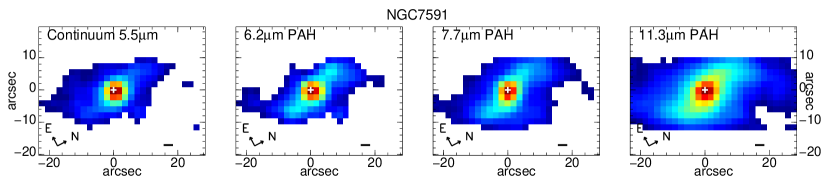
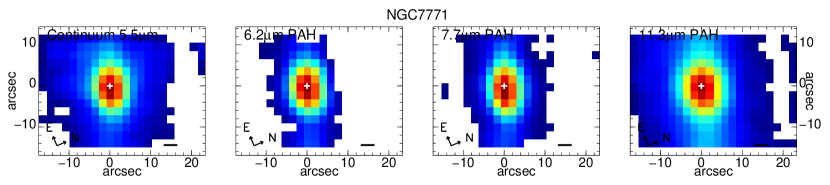
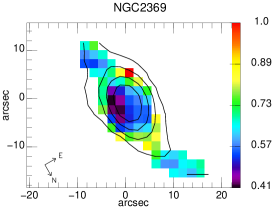
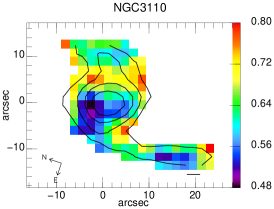
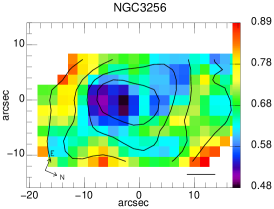
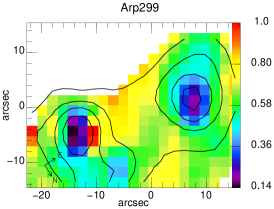
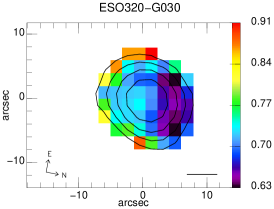
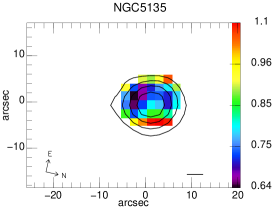
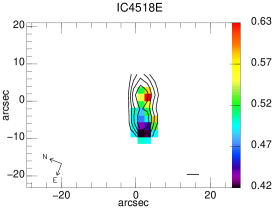
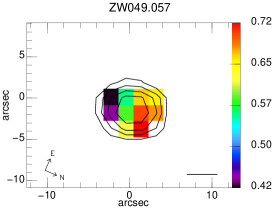
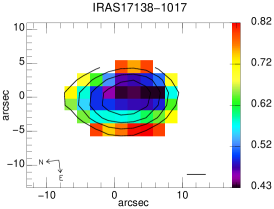
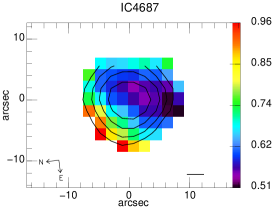
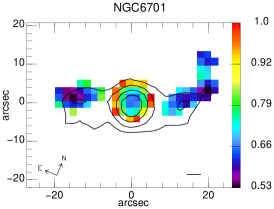
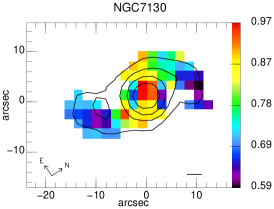
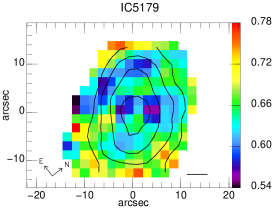
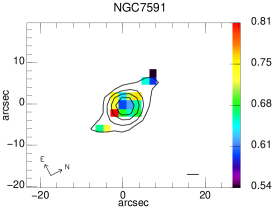
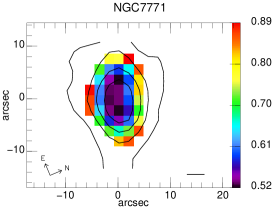
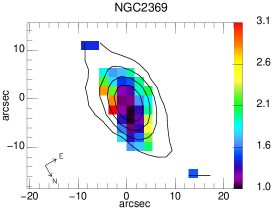
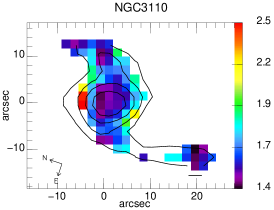
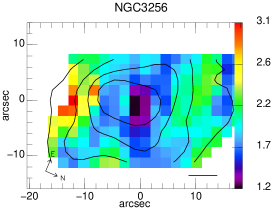
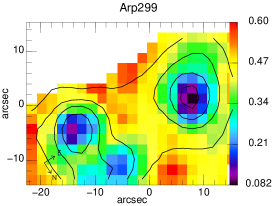
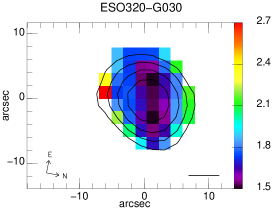
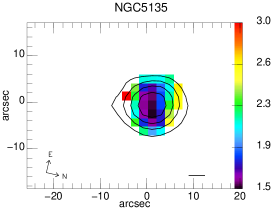
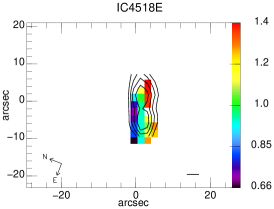
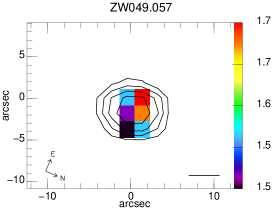
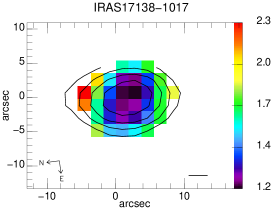
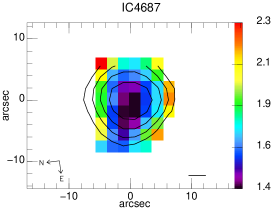
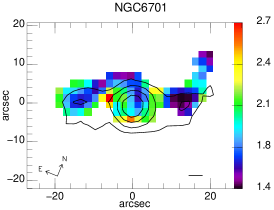
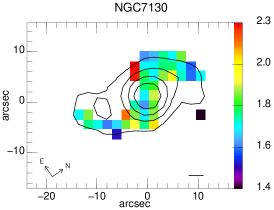
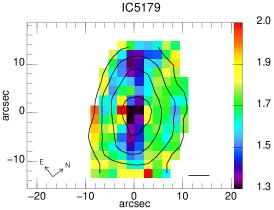
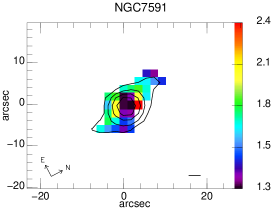
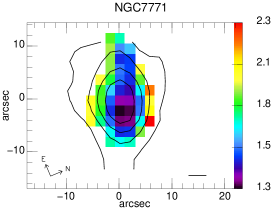
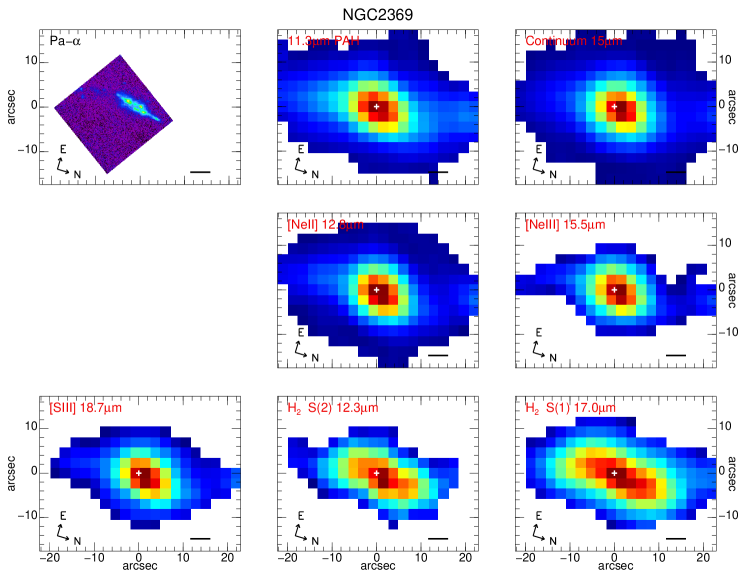
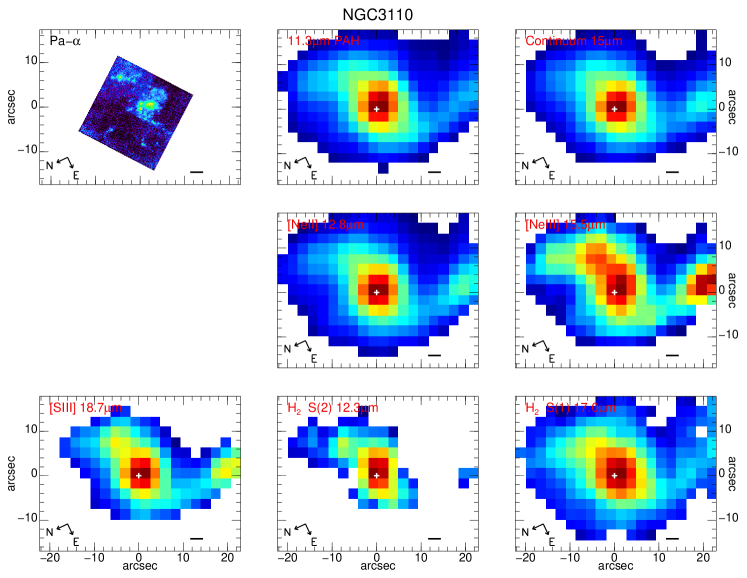
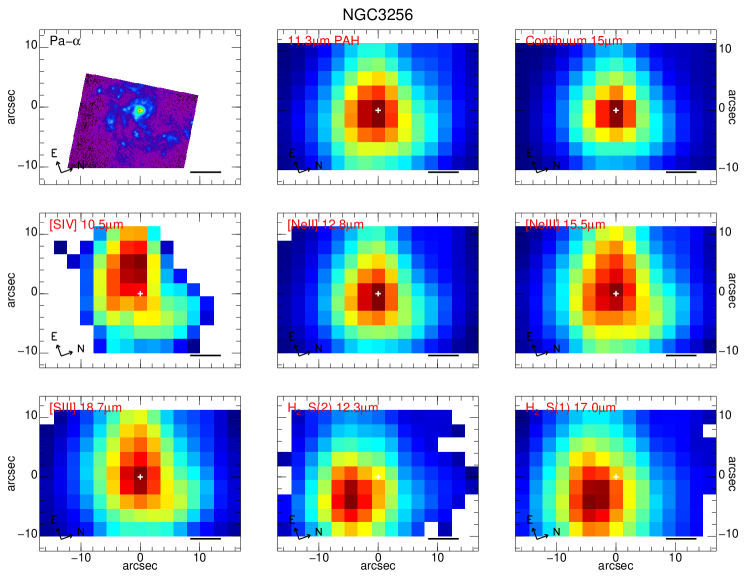
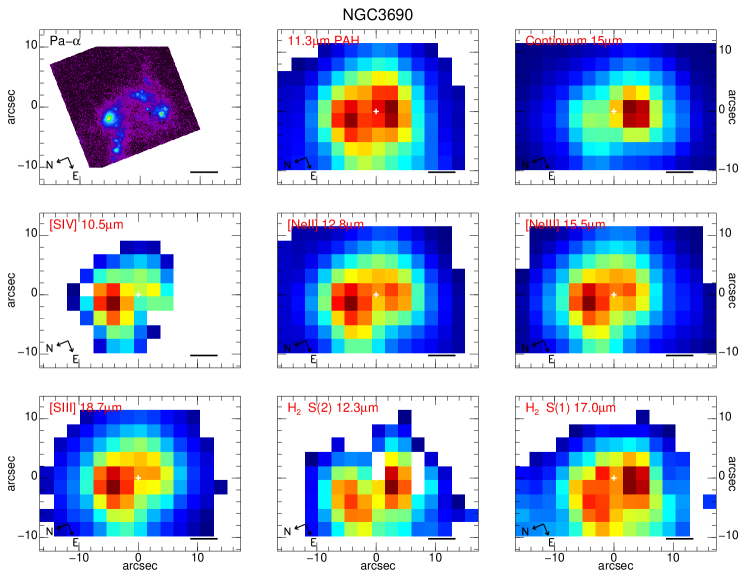
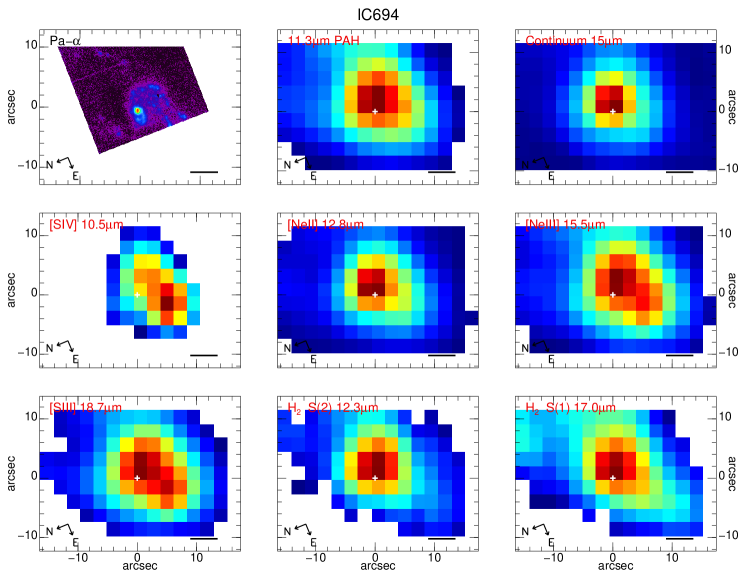
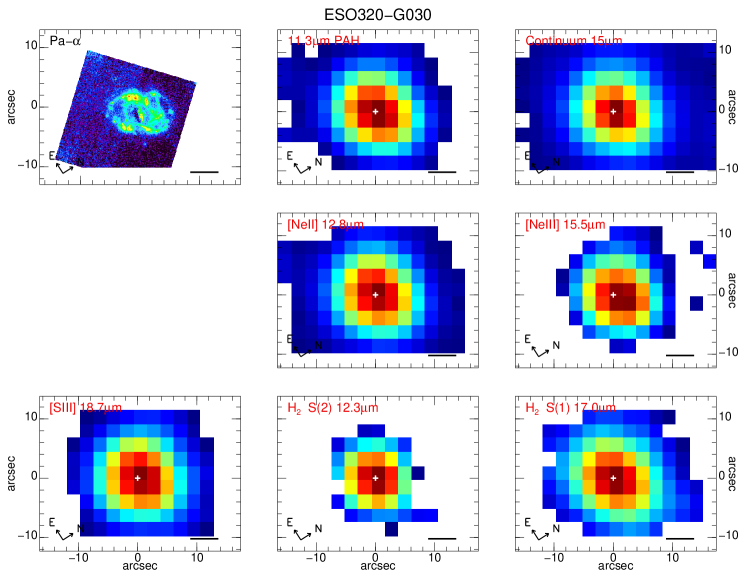
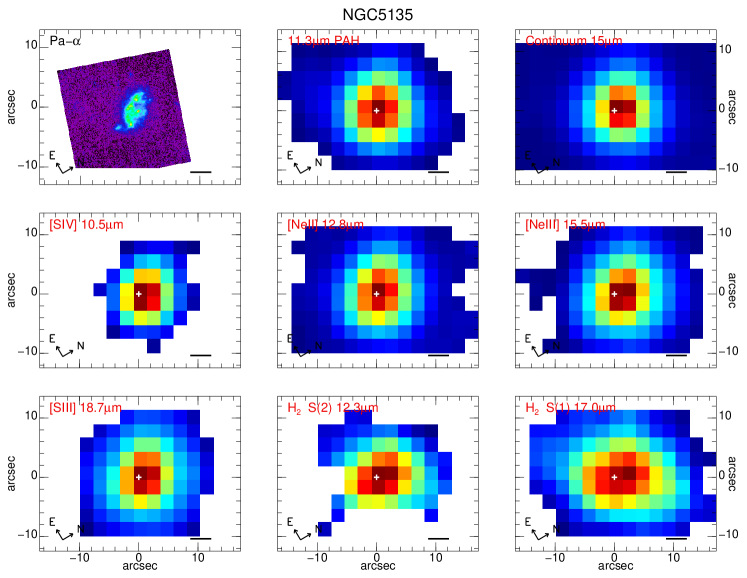
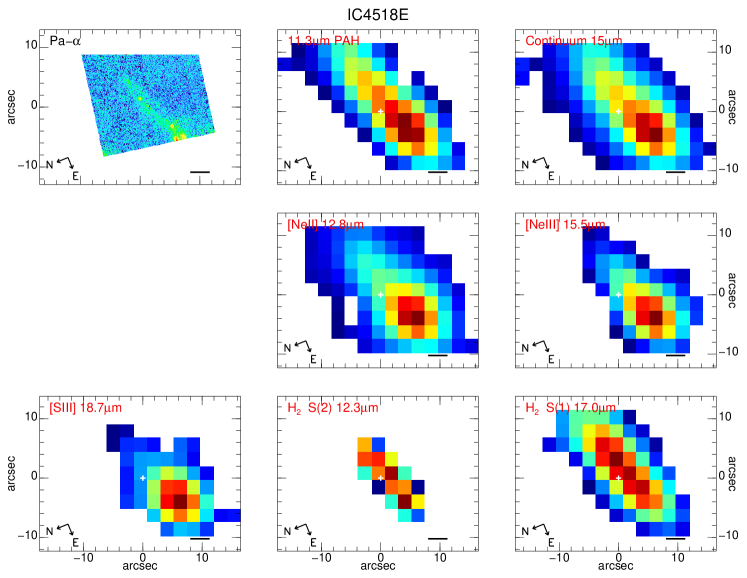
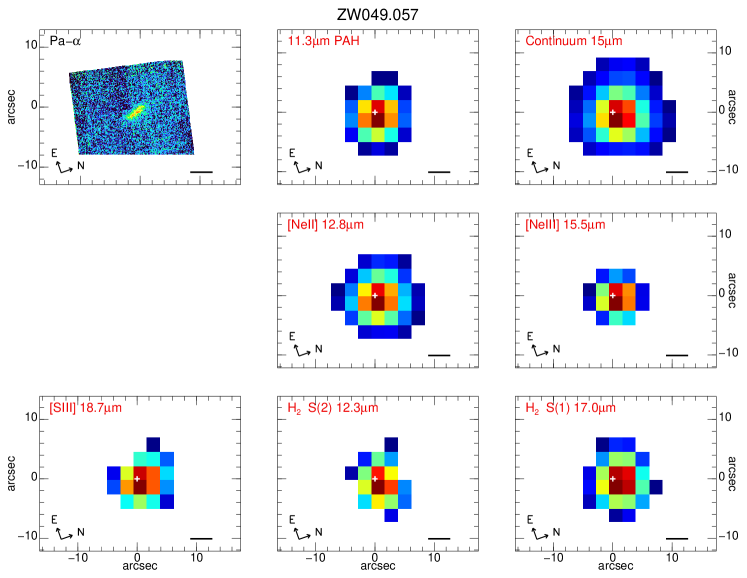
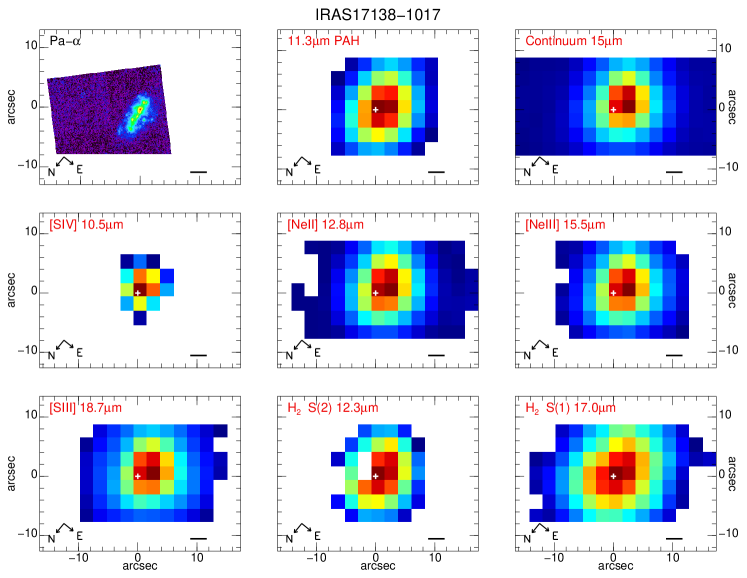
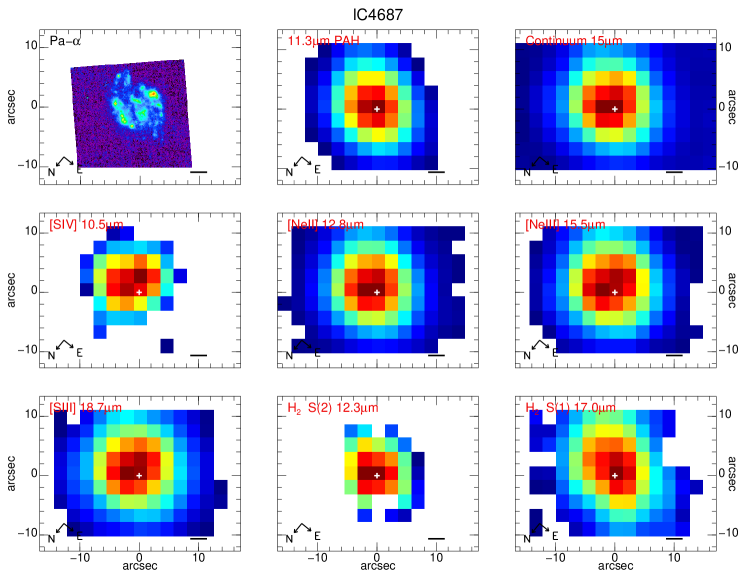
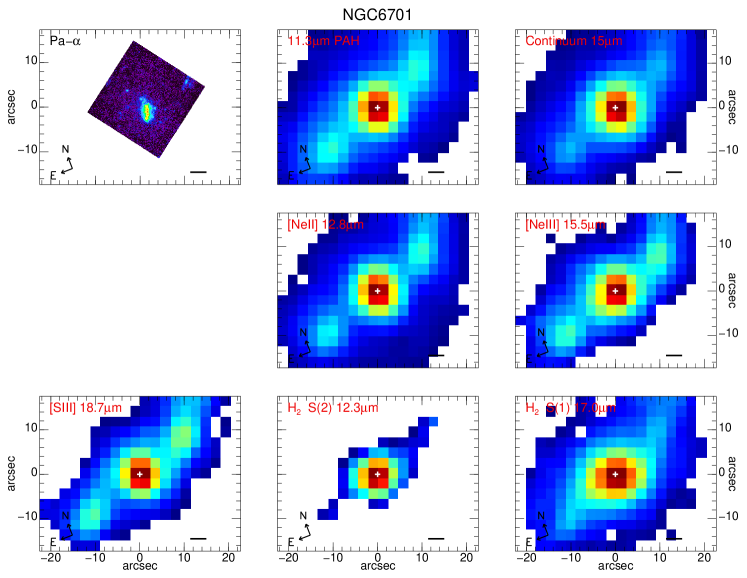
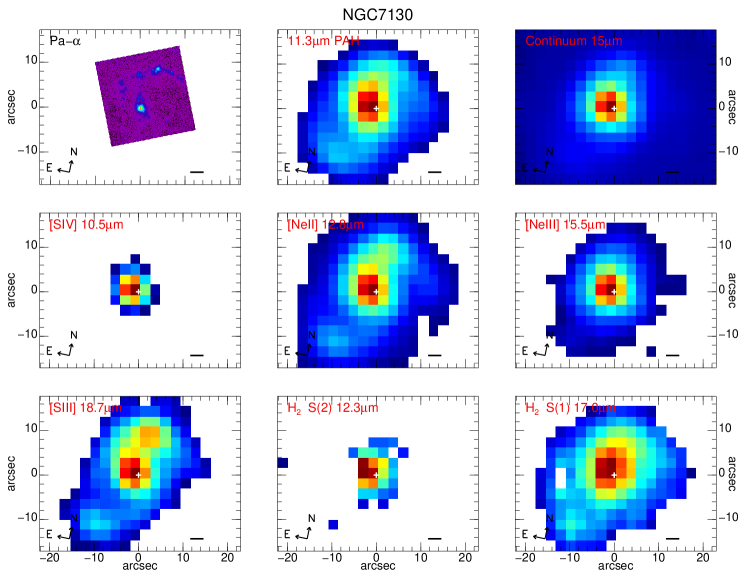
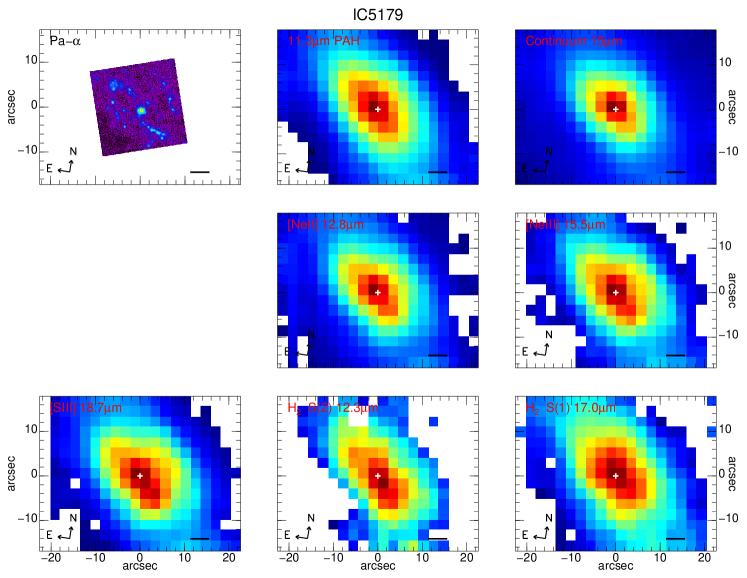
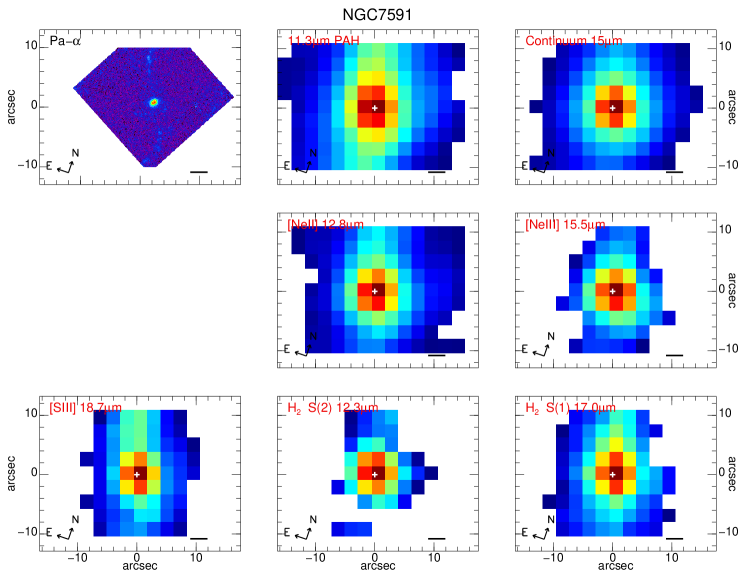
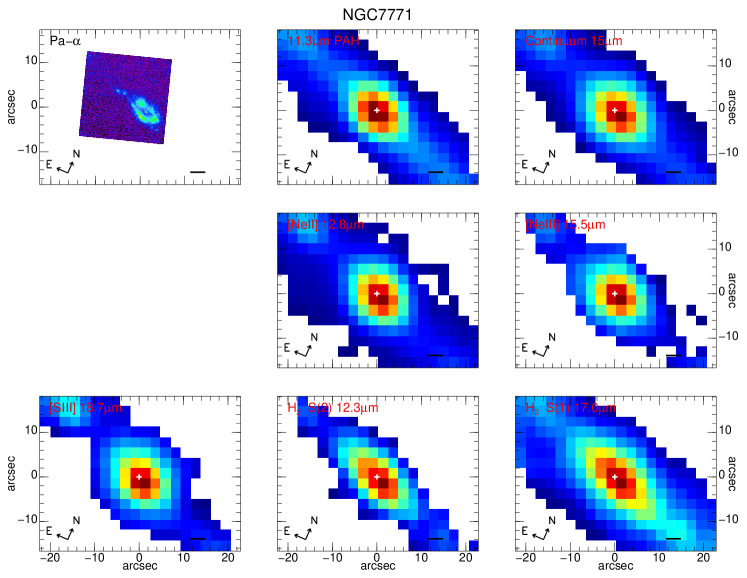
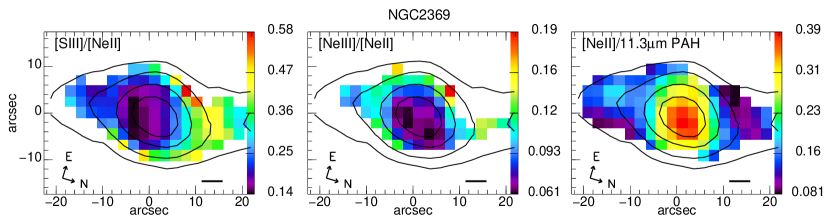
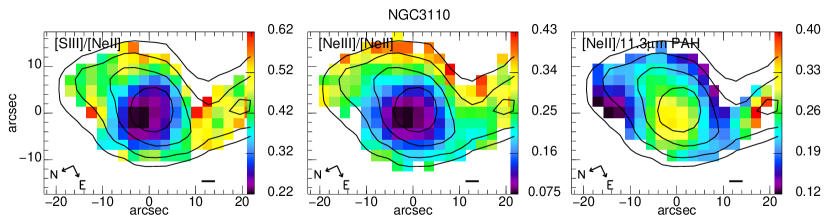
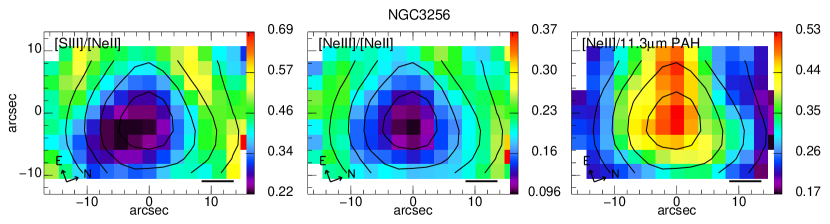
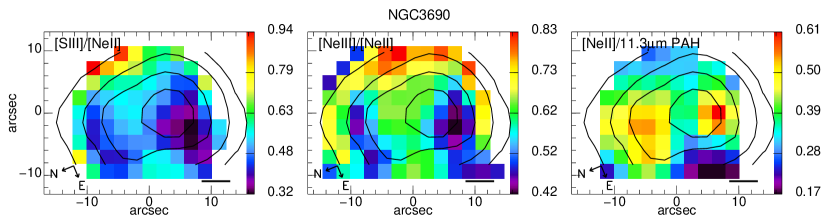
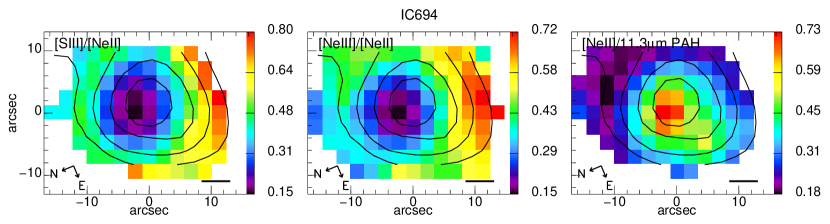
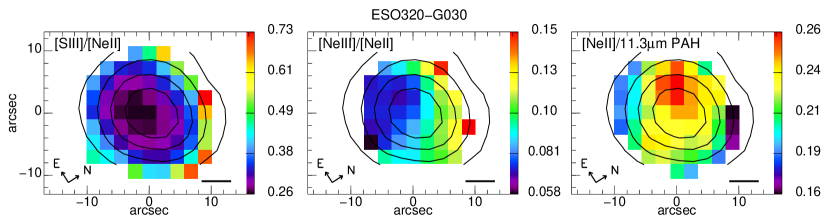
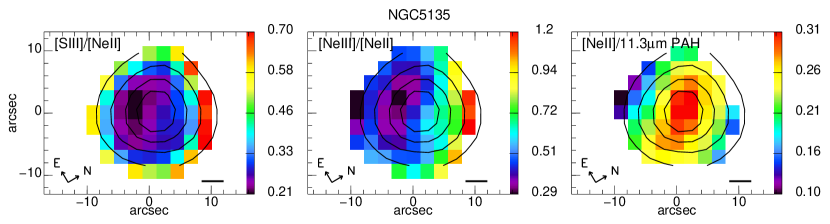
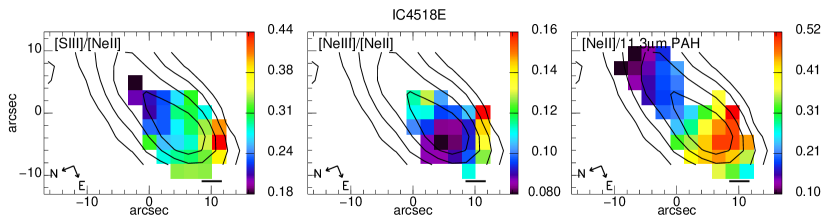
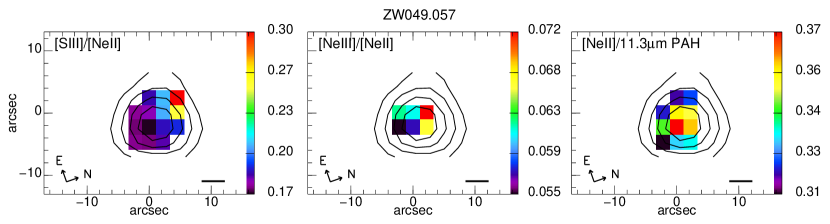
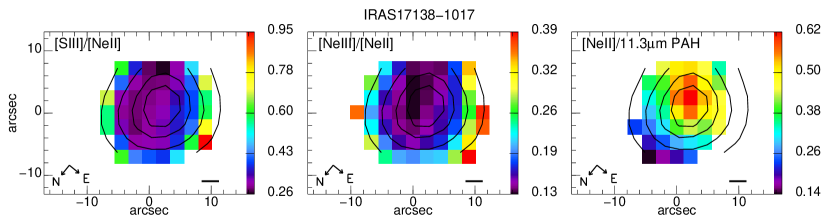
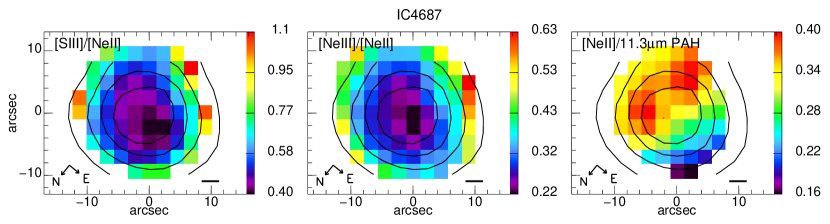
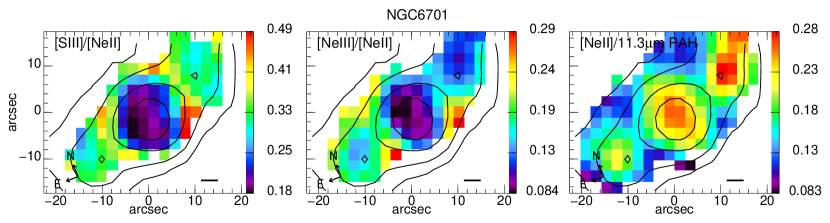
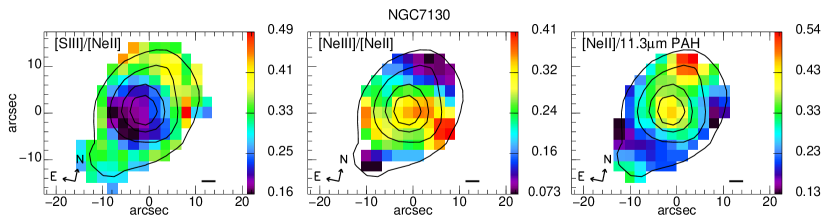
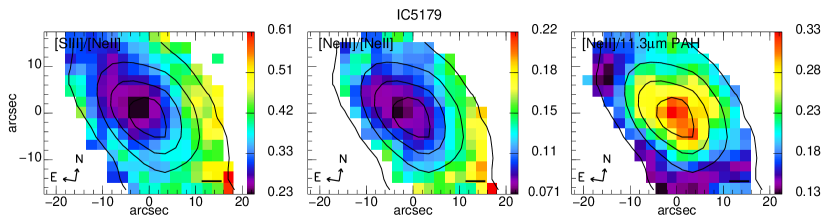
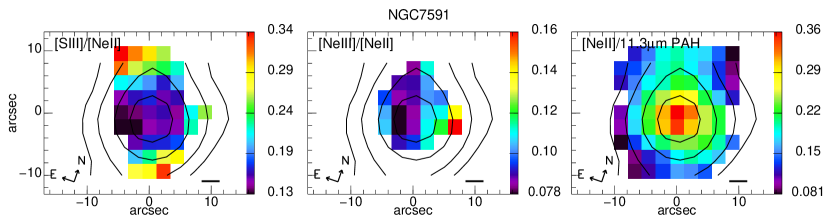
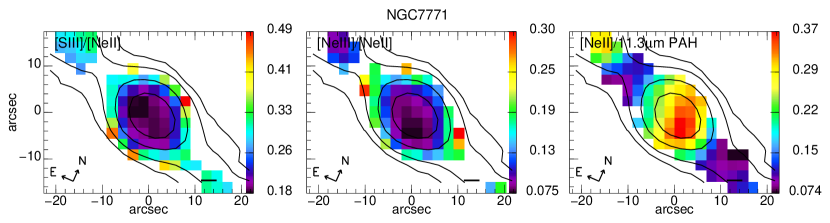
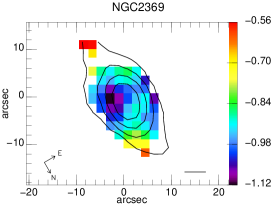
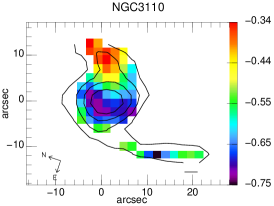
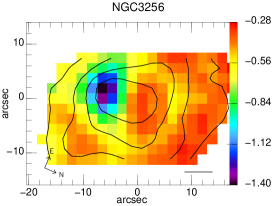
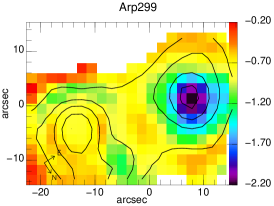
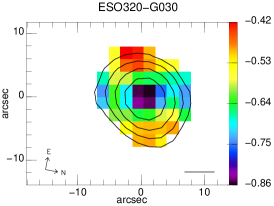
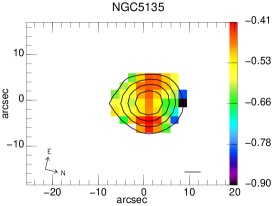
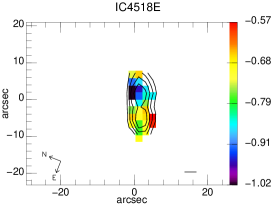
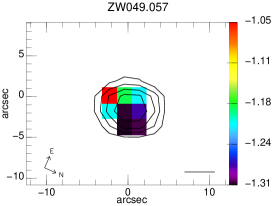
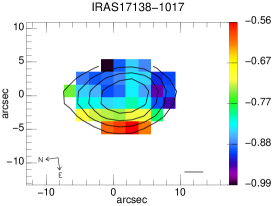
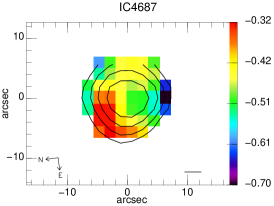
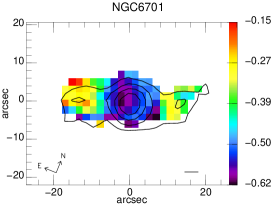
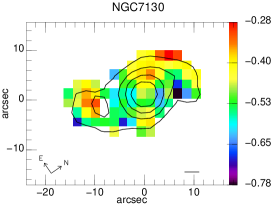
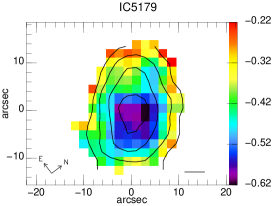
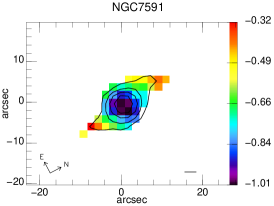
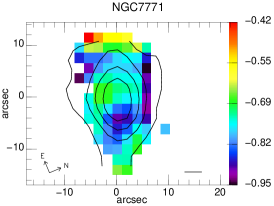
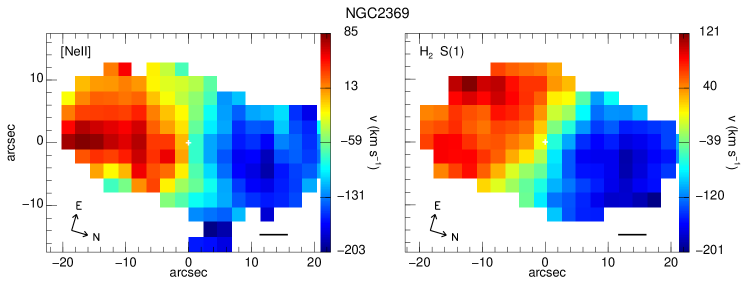
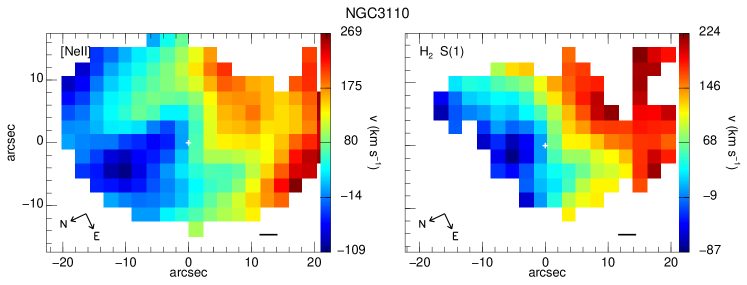
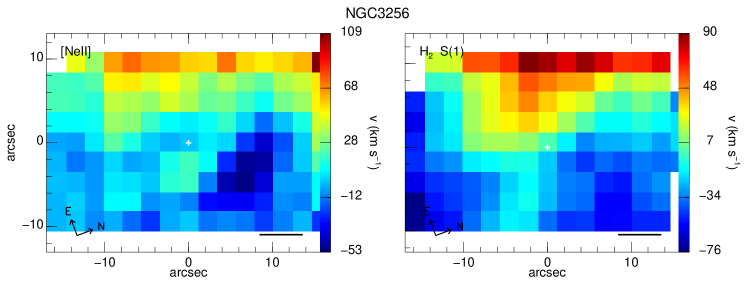
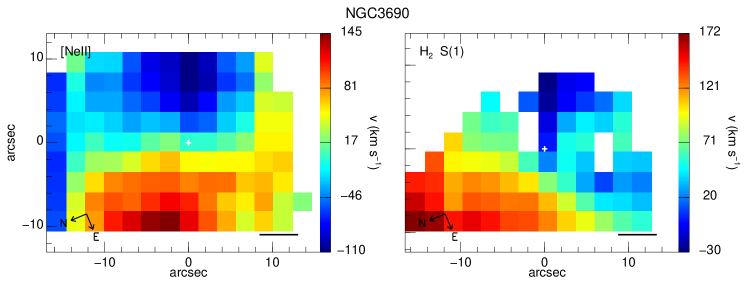
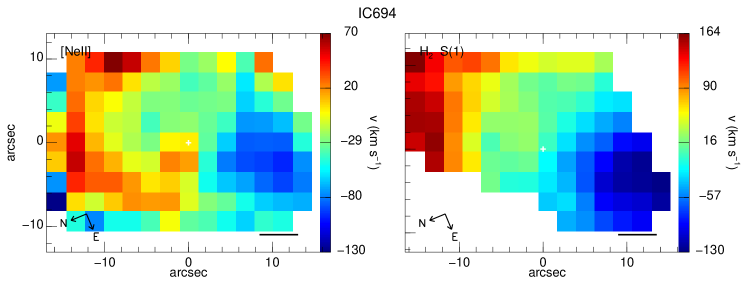
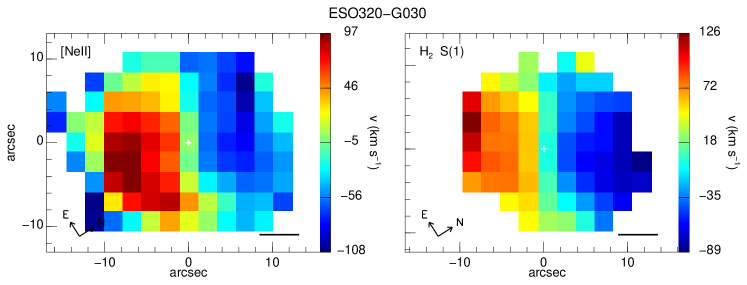
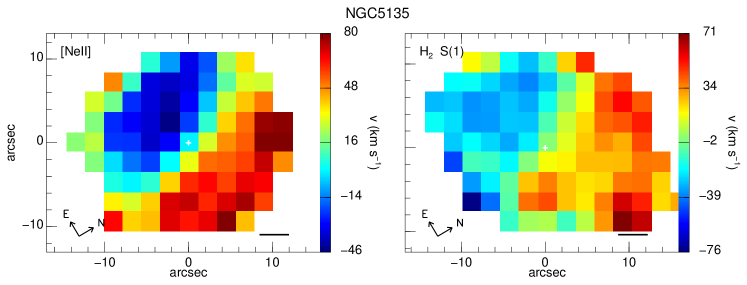
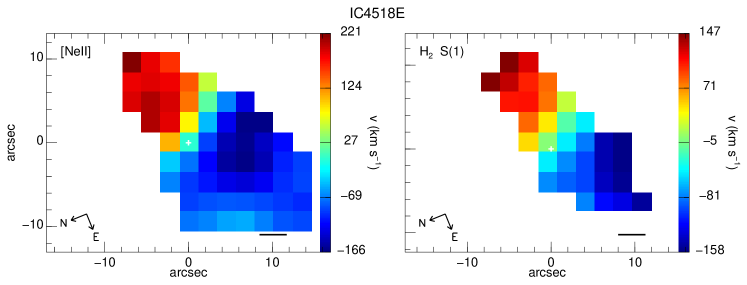
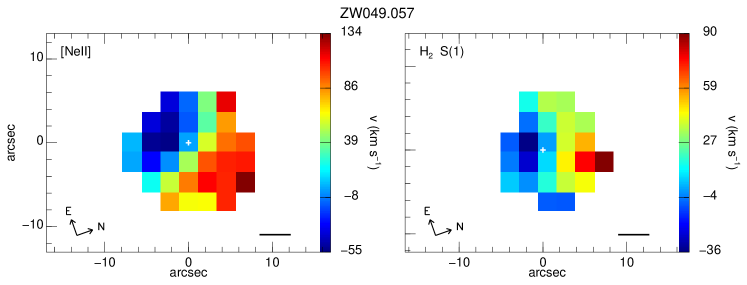
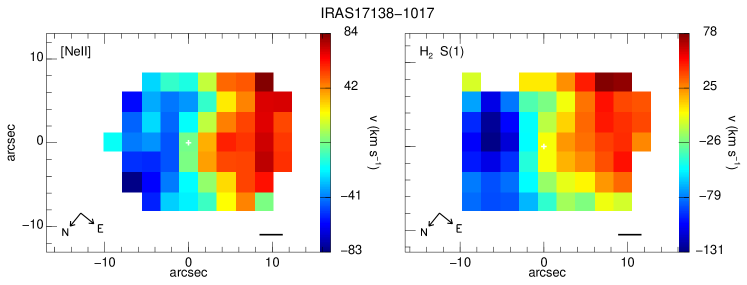
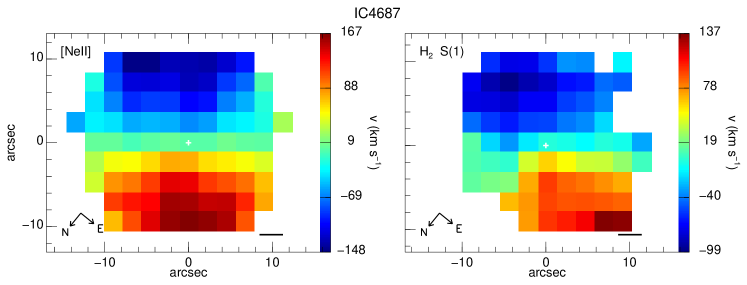
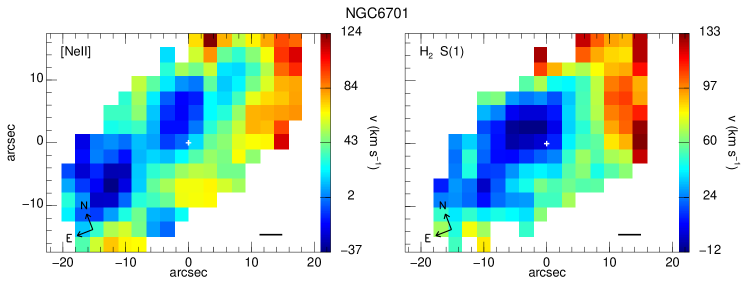
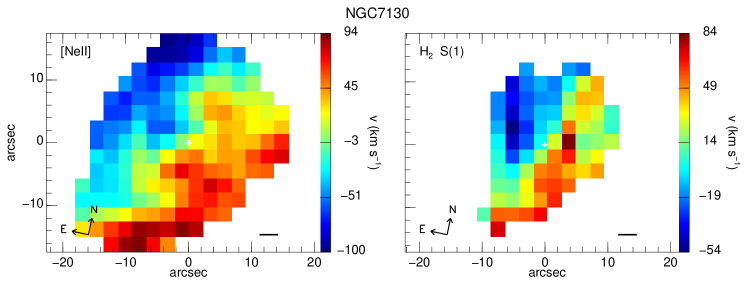
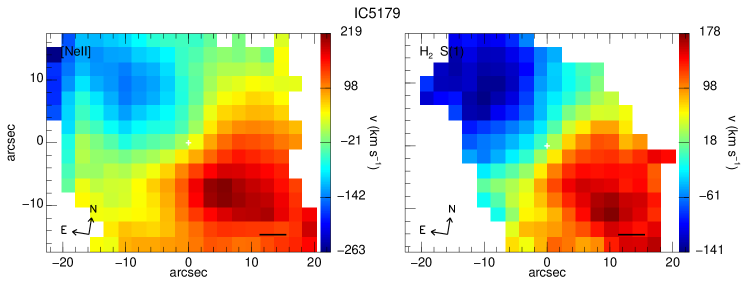
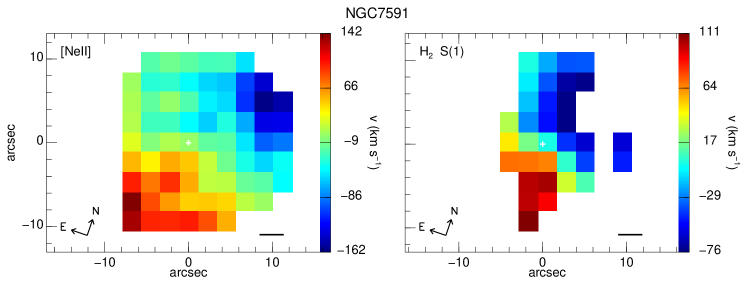
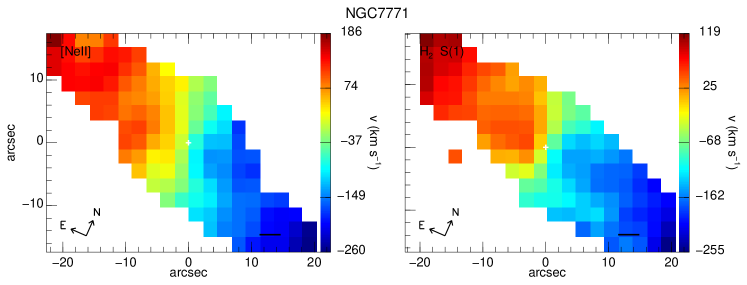
Appendix A The Point Spread Function of IRS Spectral Mapping Observations
When comparing maps of lines or features, at different wavelengths, the variation of the Point Spread Function(PSF) size can be significant. The Spitzer/IRS PSF is much less studied than that of the other Spitzer instruments, although it is possible to generate synthetic IRS PSF using STinyTim program (Krist, 2002). This is useful for staring observations, but the spectral mapping observation mode introduces extra issues, such as the cube assembly from staring observations, wavelength calibration uncertainties, that cannot be easily taken into account using the modeled PSF. Because of that, a better way to characterize the IRS PSF of the spectral mapping observation mode is to use the mapping observations of calibration stars available in the Spitzer archive. Previously, Kóspál et al. (2008) studied the factor that should be applied to correct for flux losses when the slit is not centered properly on a point source. We extend this analysis to characterize the variations of the PSF.
To do this, we used the same data sets as Kóspál et al. (2008), of spectral mapping observations of calibration stars. These observations were taken with the same instrument configuration used for the galaxies studied in this paper, but with much smaller steps between pointings, i.e. the calibration observations have a better spatial information of the PSF. Details of the observations are listed in Table 8.
After obtaining BCD files processed by Spitzer pipeline (version 15.3 for SH and SL modules, and version 17.2 for LH and LL modules), we built the spectral cubes with CUBISM (Smith et al., 2007a). The sky emission was subtracted using dedicated background observations. To take advantage of the better spatial information of the calibration observations, we set the pixel size in the final cube to be the size of the step in the perpendicular direction333In this Section we use the terms: “perpendicular” and “parallel” direction. They refer to the direction along the spectral dispersion axis and the spatial axis of the slit, respectively. (see Table 8). We did this for all IRS modules, however we only present the results for the SH, SL1 and SL2 modules, because the other modules (LH, LL1 and LL2), are heavily affected by fringing patterns and their PSF is not well reproduced by a Gaussian.
In order to study the PSF core variations we fitted each plane of the cube using a 2-D Gaussian. We allowed different values of the Full Width Half Maximum (FWHM) for each axis of the Gaussian, but the axis orientation is fixed and aligned with the parallel and perpendicular directions. By doing this we obtained the FWHM and centroid of the PSF at every wavelength. These values are represented in Figure 25.
The undulating pattern of the FWHM and the centroid in the modules SL1 and SL2 is originated by several causes: (1) The spectral axis is not aligned with the detector, thus to extract the spectra is necessary to resample the original image. This resampling process produces this kind of periodic patterns. (2) The algorithm used to build the data cubes (see Smith et al. 2007a for details) does not try to correct for this effect. In any case, these variations are small: 10 % for the FWHM and 0.2 arcsec for the centroid position.
The PSF core is slightly asymmetric for all modules. The FWHM in the perpendicular direction is larger than the FWHM in parallel direction, which has an almost constant value. A possible explanation to this is the way CUBISM builds the cubes. It assumes that there is no spatial information in the dispersion (or perpendicular) direction and the spatial information in that direction comes from different telescope pointings (for more details see Smith et al. 2007a). The averaged values of the FWHM of each module are listed in Table 9.
The variation of the centroid position in SL modules is small. The 1 deviation around the average centroid position are 0.07 and 0.02 arcsec for the parallel and perpendicular direction respectively, that is a twentieth of the SL pixel size. These variations can be attributed to small telescope pointing errors and signal-to-noise limitation. The position of the centroid in the SH module shows variations that cannot be explained just by instrumental pointing error or a limited signal-to-noise. The 1- deviation in the perpendicular direction is 0.03 arcsec, but in the parallel direction the variation is one order of magnitude larger (0.2 arcsec) and shows a clear wavelength dependency. The most probable cause for this, is an error in the position and/or angle of the extraction aperture. However this effect (0.6 arcsec) is small when compared with the SH pixel size (2.26 arcsec).
We studied the variations of the diffraction rings in the SH module. We fitted the central row of the cube for each wavelength using a Gaussian for the PSF core and two Gaussians for the only diffraction ring detected. These two Gaussians have the same FWHM and they are symmetrically placed around the PSF core position. Figure 26 shows a fit example. The results of the fits are summarized in the Figure 27. The FWHM of the diffraction ring, that does not depend on the wavelength, is 3.6 0.3 arcsec. Instead the position of the ring depends linearly on wavelength. The relative value of the diffraction ring peak respect to the PSF core peak, depends slightly on wavelength. At 10 m it is 11% of the core peak value and at 19 m it is 9% .
When calculating feature ratios, the point spread function variations (FWHM and centroid), could originate artifacts. For the SL module these variations are less than one tenth of the pixel size and should not affect feature ratios. For the SH module the major source of uncertainty is the centroid position, but the difference is only one fourth of the pixel size. Since these variations are very small compared with the pixel size, they do not affect the calculated feature ratios. Diffraction rings can produce artifacts in the feature ratios too. They cause inaccurate ratio values 3 or 4 pixels away from the center of the point source in the SH module. For extended sources the situation is more complex because it is not possible to know where the diffraction ring will appear. However, comparing the spatial profiles of the features and the underlying continuum, as we do in this paper, helps determine if the ratio values are real or artifacts.
| Step size perpendicular | Step size parallel | |||
|---|---|---|---|---|
| Module | AOR | Target | (arcsec) | (arcsec) |
| SL1, SL2 | 16295168 | HR 7341 | 0.6 | 15.5 |
| LL1, LL2 | 16463104 | HR 6606 | 1.7 | 46.0 |
| SH | 16294912 | HR 6688 | 0.8 | 0.8 |
| SH | 16340224 | sky | ||
| LH | 16101888 | HR 2491 | 1.7 | 1.7 |
| LH | 116088320 | sky |
| FWHM Perpendicular | FWHM Parallel | |
|---|---|---|
| Module | (arcsec) | (arcsec) |
| SH | 5.16 0.08 | 4.31 0.37 |
| SL1 | 3.76 0.07 | 3.27 0.21 |
| SL2 | 3.88 0.04 | 3.02 0.17 |
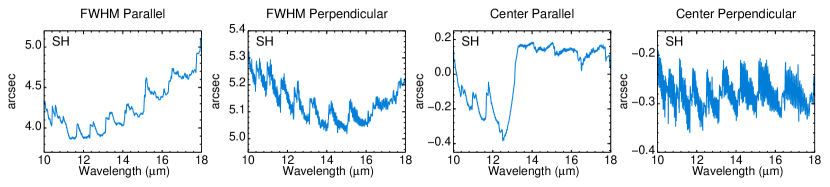
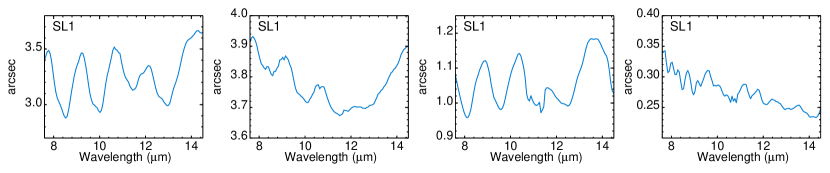
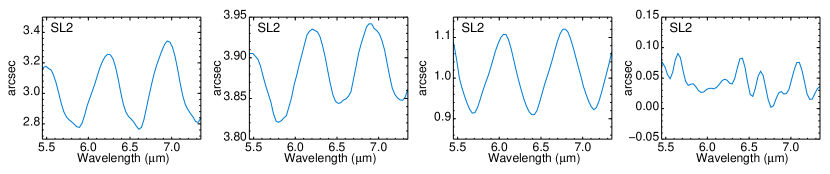
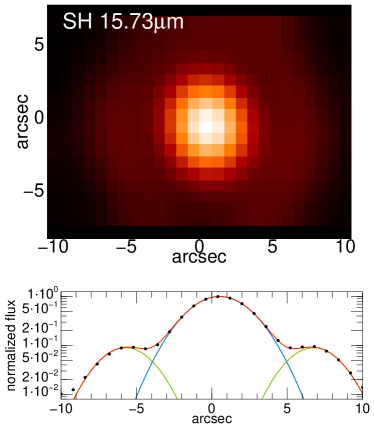
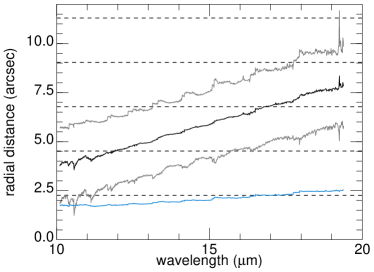
Appendix B Description of individual objects
B.1. NGC 2369
The MIR emission of NGC 2369 is dominated by the resolved nucleus. The molecular hydrogen (H2 S(1) and H2 S(2)) emission appears more extended along the galaxy disk than the 11.3 m PAH emission. This causes a relatively large H2 S(1)/11.3 m PAH ratio in the regions around the nucleus. The [Ne II]12.81 m/11.3 m PAH ratio map reveals an H ii region 17 arcsec (3.4 kpc projected) away from the nucleus to the south. The nuclear silicate strength, 0.9, is slightly larger than the average silicate strength of our LIRGs sample, probably because this galaxy is seen almost edge-on.
B.2. NGC 3110
It is a face-on galaxy with numerous H ii regions along the spiral arms(Hattori et al., 2004). The [Ne III]15.56 m emission of this galaxy is especially bright and it resembles that of the H emission. The [Ne III]15.56 m/[Ne II]12.81 m ratio of the extranuclear H ii regions is 5 times larger than the nuclear ratio. The deepest silicate absorption is located at the nucleus.
B.3. NGC 3256
It is galaxy merger with two nuclei. The southern nucleus, located 5 arcsec away from the north nucleus, is highly obscured, although it is visible in the 5.5 m continuum map. It has one of the deepest silicate absorption feature in our sample, . The silicate feature of the rest of the galaxy is similar to that found in the rest of the galaxies of our sample. The PAH, continuum and atomic emission (except [S IV]10.51 m) peak at the north nucleus. The maximum of the [S IV]10.51 m emission is located 5 arcsec to the east of the north nucleus, and it is probably related to a star-forming region. This is the only extranuclear region (d1 kpc), apart from region C in Arp 299 (Alonso-Herrero et al., 2009b), where we detect the [S IV]10.51 m line. The H2 emission arises mainly from the southern nucleus and the surrounding regions.
B.4. ESO 320-G030
Due to the low spatial resolution of the IRS maps, we cannot distinguish any morphological detail in the emission maps this galaxy, although it is clearly spatially resolved. The maximum of the silicate feature absorption is located at the nucleus.
B.5. NGC 5135
This galaxy hosts a Sy2 nucleus surrounded by intense star formation (Bedregal et al. 2009 and references therein), that we cannot separate due the limited spatial resolution of the IRS spectral maps. However the line ratios (e.g [Ne III]15.56 m/[Ne II]12.81 m ratio) show some asymmetries that may be associated with the truncated ring-like structure of this galaxy. At our scale (0.5 kpc), we do not see any noticeable variations in the PAH emission due to the AGN activity. The silicate absorption feature is shallow (-0.47) and the maximum value is not located at the nucleus.
B.6. IC 4518E
This galaxy is part of an interacting pair (IC 4518E/IC 4518W). Most of the mid infrared emission (PAH, fine structure line and 15 m continuum) emission is dominated by an H ii region located 7 arcsec to the south-east from the nucleus. The nuclear bright is similar to that of the southwestern H ii region emission only for the molecular hydrogen (H2 S(1)) and the 5.5 m continuum. The deepest silicate absorption is found at the nucleus.
B.7. Zw 049.057
Due to the low signal-to-noise ratio of the observations of Zw 049.057, the maps of this galaxy contain very few pixels. The nuclear silicate absorption is, SSi= -1.2, which is large when compared to that of the other LIRGs.
B.8. IRAS 171381017
The limited spatial resolution of the emission maps does not allow us to identify any morphological details in this galaxy. The maximum of the silicate absorption may not be located at the nucleus. Note however that the near-infrared (Alonso-Herrero et al., 2006) and the mid-infrared (Díaz-Santos et al., 2008) morphologies do not allow us to determine the position of the nucleus.
B.9. IC 4687
IC 4687 is part of an interacting system (IC 4686/IC 4687). Only IC 4687 was observed in the spectral mapping mode. In the emission line map it is not possible to isolate any region of interest, however the emission is spatially resolved. We detect the [S IV]10.51 m line, that seems to be associated to the nuclear H ii regions seen in the Pa image. Two of these regions have slightly larger [Ne II]12.81 m/11.3 m PAH ratio than the rest of the galaxy. The nuclear [Ne III]15.56 m/[Ne II]12.81 m ratio of this galaxy is somewhat larger than those of the other H ii galaxies in our sample. The maximum of the silicate feature is not located at the nucleus.
B.10. NGC 6701
This LIRG is classified as composite(H ii/LINER) from optical spectroscopy (Alonso-Herrero et al., 2009a). We can identify two extranuclear H ii regions symmetrically located 10 arcsec away from the nucleus, one at each spiral arm. As is the case with the other extranuclear H ii regions, the molecular hydrogen of these two regions is relatively low when compared with the H2 nuclear emission. The silicate absorption is deeper in the nucleus than in the rest of the galaxy.
B.11. NGC 7130
This is a face-on galaxy whose nuclear activity is classified as Sy/LINER. We detect 2 extranuclear H ii regions located in the spiral arms. The brightest is located to the north, 10 arcsec from the nucleus. The other one is 14 arcsec to the south-east from the nucleus. The continuum and [Ne III]15.56 m emissions are concentrated at the nucleus. The PAH features and fine structure lines are bright in the spiral arms too. The minimum of the [Ne III]15.56 m/[Ne II]12.81 m ratio is not located at the nucleus, as for the majority of the LIRGs in our sample. We detect nuclear [S IV]10.51 m emission. Also, this is one of the few galaxies in the sample whose 11.3 m PAH/6.2 m PAH ratio minimum is not located at the nucleus. These facts may be related to the active nature of the nucleus of this galaxy.
B.12. IC 5179
This is a face-on spiral galaxy classified as H ii-like from optical spectroscopy, and it shows numerous H ii regions distributed in the spiral arms (Alonso-Herrero et al., 2006). These H ii regions are not resolved in the Spitzer maps. They appear as a relatively uniform extended emission (PAH features and atomic lines) over 8 kpc. The continuum emission is slightly more concentrated towards the nucleus. The patterns in the ratio maps are possibly related to the intricate distribution of the H ii regions. The nucleus is the most obscured region of this galaxy.
B.13. NGC 7591
The nuclear activity of NGC 7591 is classified as composite (Alonso-Herrero et al., 2009a). Only in the low spectral resolution maps we can clearly distinguish the spiral arms of this face-on galaxy. The continuum emission is concentrated at the nucleus, while we can see bright PAH and fine structure lines emission in the galaxy arms. The nucleus is the region with the deepest silicate absorption feature.
B.14. NGC 7771
The nucleus of this LIRG is classified as H ii-like from optical spectroscopy. It has a nuclear ring of star formation clearly seen in the Pa images (Figure 4, see also Alonso-Herrero et al. 2006 and Alonso-Herrero et al. 2009a), but it is not resolved by the IRS observations. This galaxy is seen almost edge-on and we can clearly observe the spiral arms in the line emission maps. We detect an H ii region in the eastern arm, 20 arcsec (6 kpc) away from the nucleus. The continuum is dominated by the nucleus. The H2 emission extends 5 kpc in the west galaxy arm with apparently no bright fine structure/PAH emission associated with it. The silicate feature spatial distribution is somewhat irregular and we do not see any morphological detail.
References
- Aalto et al. (1997) Aalto, S., Radford, S. J. E., Scoville, N. Z., & Sargent, A. I. 1997, ApJ, 475, L107+
- Alonso-Herrero et al. (2009a) Alonso-Herrero, A., García-Marín, M., Monreal-Ibero, A., Colina, L., Arribas, S., Alfonso-Garzón, J., & Labiano, A. 2009a, A&A, 506, 1541
- Alonso-Herrero et al. (2010) Alonso-Herrero, A., Pereira-Santaella, M., Rieke, G. H., Colina, L., Engelbracht, C. W., Pérez-González, P. G., Díaz-Santos, T., & Smith, J. 2010, Advances in Space Research, 45, 99
- Alonso-Herrero et al. (2009b) Alonso-Herrero, A., Rieke, G. H., Colina, L., Pereira-Santaella, M., García-Marín, M., Smith, J.-D. T., Brandl, B., Charmandaris, V., & Armus, L. 2009b, ApJ, 697, 660
- Alonso-Herrero et al. (2006) Alonso-Herrero, A., Rieke, G. H., Rieke, M. J., Colina, L., Pérez-González, P. G., & Ryder, S. D. 2006, ApJ, 650, 835
- Alonso-Herrero et al. (2000) Alonso-Herrero, A., Rieke, G. H., Rieke, M. J., & Scoville, N. Z. 2000, ApJ, 532, 845
- Amram et al. (1994) Amram, P., Marcelin, M., Balkowski, C., Cayatte, V., Sullivan, III, W. T., & Le Coarer, E. 1994, A&AS, 103, 5
- Armus et al. (2007) Armus, L., Charmandaris, V., Bernard-Salas, J., Spoon, H. W. W., Marshall, J. A., Higdon, S. J. U., Desai, V., Teplitz, H. I., Hao, L., Devost, D., Brandl, B. R., Wu, Y., Sloan, G. C., Soifer, B. T., Houck, J. R., & Herter, T. L. 2007, ApJ, 656, 148
- Armus et al. (2009) Armus, L., Mazzarella, J. M., Evans, A. S., Surace, J. A., Sanders, D. B., Iwasawa, K., Frayer, D. T., Howell, J. H., Chan, B., Petric, A., Vavilkin, T., Kim, D. C., Haan, S., Inami, H., Murphy, E. J., Appleton, P. N., Barnes, J. E., Bothun, G., Bridge, C. R., Charmandaris, V., Jensen, J. B., Kewley, L. J., Lord, S., Madore, B. F., Marshall, J. A., Melbourne, J. E., Rich, J., Satyapal, S., Schulz, B., Spoon, H. W. W., Sturm, E., U, V., Veilleux, S., & Xu, K. 2009, PASP, 121, 559
- Augarde & Lequeux (1985) Augarde, R., & Lequeux, J. 1985, A&A, 147, 273
- Bedregal et al. (2009) Bedregal, A. G., Colina, L., Alonso-Herrero, A., & Arribas, S. 2009, ApJ, 698, 1852
- Beirão et al. (2008) Beirão, P., Brandl, B. R., Appleton, P. N., Groves, B., Armus, L., Förster Schreiber, N. M., Smith, J. D., Charmandaris, V., & Houck, J. R. 2008, ApJ, 676, 304
- Brandl et al. (2006) Brandl, B. R., Bernard-Salas, J., Spoon, H. W. W., Devost, D., Sloan, G. C., Guilles, S., Wu, Y., Houck, J. R., Weedman, D. W., Armus, L., Appleton, P. N., Soifer, B. T., Charmandaris, V., Hao, L., Higdon, J. A. M. S. J., & Herter, T. L. 2006, ApJ, 653, 1129
- Caputi et al. (2007) Caputi, K. I., Lagache, G., Yan, L., Dole, H., Bavouzet, N., Le Floc’h, E., Choi, P. I., Helou, G., & Reddy, N. 2007, ApJ, 660, 97
- Casoli et al. (1999) Casoli, F., Willaime, M., Viallefond, F., & Gerin, M. 1999, A&A, 346, 663
- Dale et al. (2006) Dale, D. A., Smith, J. D. T., Armus, L., Buckalew, B. A., Helou, G., Kennicutt, Jr., R. C., Moustakas, J., Roussel, H., Sheth, K., Bendo, G. J., Calzetti, D., Draine, B. T., Engelbracht, C. W., Gordon, K. D., Hollenbach, D. J., Jarrett, T. H., Kewley, L. J., Leitherer, C., Li, A., Malhotra, S., Murphy, E. J., & Walter, F. 2006, ApJ, 646, 161
- Dale et al. (2009) Dale, D. A., Smith, J. D. T., Schlawin, E. A., Armus, L., Buckalew, B. A., Cohen, S. A., Helou, G., Jarrett, T. H., Johnson, L. C., Moustakas, J., Murphy, E. J., Roussel, H., Sheth, K., Staudaher, S., Bot, C., Calzetti, D., Engelbracht, C. W., Gordon, K. D., Hollenbach, D. J., Kennicutt, R. C., & Malhotra, S. 2009, ApJ, 693, 1821
- Devost et al. (2004) Devost, D., Brandl, B. R., Armus, L., Barry, D. J., Sloan, G. C., Charmandaris, V., Spoon, H., Bernard-Salas, J., & Houck, J. R. 2004, ApJS, 154, 242
- Díaz-Santos et al. (2010) Díaz-Santos, T., Alonso-Herrero, A., Colina, L., Packham, C., Levenson, N. A., Pereira-Santaella, M., Roche, P. F., & Telesco, C. M. 2010, ApJ, 711, 328
- Díaz-Santos et al. (2008) Díaz-Santos, T., Alonso-Herrero, A., Colina, L., Packham, C., Radomski, J. T., & Telesco, C. M. 2008, ApJ, 685, 211
- Dopita et al. (2006) Dopita, M. A., Fischera, J., Sutherland, R. S., Kewley, L. J., Leitherer, C., Tuffs, R. J., Popescu, C. C., van Breugel, W., & Groves, B. A. 2006, ApJS, 167, 177
- Draine & Li (2001) Draine, B. T., & Li, A. 2001, ApJ, 551, 807
- Engelbracht et al. (2008) Engelbracht, C. W., Rieke, G. H., Gordon, K. D., Smith, J.-D. T., Werner, M. W., Moustakas, J., Willmer, C. N. A., & Vanzi, L. 2008, ApJ, 678, 804
- Farrah et al. (2007) Farrah, D., Bernard-Salas, J., Spoon, H. W. W., Soifer, B. T., Armus, L., Brandl, B., Charmandaris, V., Desai, V., Higdon, S., Devost, D., & Houck, J. 2007, ApJ, 667, 149
- Farrah et al. (2008) Farrah, D., Lonsdale, C. J., Weedman, D. W., Spoon, H. W. W., Rowan-Robinson, M., Polletta, M., Oliver, S., Houck, J. R., & Smith, H. E. 2008, ApJ, 677, 957
- Galliano (2006) Galliano, F. 2006, ArXiv Astrophysics e-prints
- Galliano et al. (2008) Galliano, F., Madden, S. C., Tielens, A. G. G. M., Peeters, E., & Jones, A. P. 2008, ApJ, 679, 310
- García-Marín et al. (2006) García-Marín, M., Colina, L., Arribas, S., Alonso-Herrero, A., & Mediavilla, E. 2006, ApJ, 650, 850
- Genzel et al. (1998) Genzel, R., Lutz, D., Sturm, E., Egami, E., Kunze, D., Moorwood, A. F. M., Rigopoulou, D., Spoon, H. W. W., Sternberg, A., Tacconi-Garman, L. E., Tacconi, L., & Thatte, N. 1998, ApJ, 498, 579
- Giveon et al. (2002) Giveon, U., Sternberg, A., Lutz, D., Feuchtgruber, H., & Pauldrach, A. W. A. 2002, ApJ, 566, 880
- Gordon et al. (2008) Gordon, K. D., Engelbracht, C. W., Rieke, G. H., Misselt, K. A., Smith, J.-D. T., & Kennicutt, Jr., R. C. 2008, ApJ, 682, 336
- Groves et al. (2004) Groves, B. A., Dopita, M. A., & Sutherland, R. S. 2004, ApJS, 153, 75
- Habart et al. (2003) Habart, E., Boulanger, F., Verstraete, L., Pineau des Forêts, G., Falgarone, E., & Abergel, A. 2003, A&A, 397, 623
- Hattori et al. (2004) Hattori, T., Yoshida, M., Ohtani, H., Sugai, H., Ishigaki, T., Sasaki, M., Hayashi, T., Ozaki, S., Ishii, M., & Kawai, A. 2004, AJ, 127, 736
- Higdon et al. (2006) Higdon, S. J. U., Armus, L., Higdon, J. L., Soifer, B. T., & Spoon, H. W. W. 2006, ApJ, 648, 323
- Ho & Keto (2007) Ho, L. C., & Keto, E. 2007, ApJ, 658, 314
- Hollenbach & McKee (1989) Hollenbach, D., & McKee, C. F. 1989, ApJ, 342, 306
- Houck et al. (2004) Houck, J. R., Roellig, T. L., van Cleve, J., Forrest, W. J., Herter, T., Lawrence, C. R., Matthews, K., Reitsema, H. J., Soifer, B. T., Watson, D. M., Weedman, D., Huisjen, M., Troeltzsch, J., Barry, D. J., Bernard-Salas, J., Blacken, C. E., Brandl, B. R., Charmandaris, V., Devost, D., Gull, G. E., Hall, P., Henderson, C. P., Higdon, S. J. U., Pirger, B. E., Schoenwald, J., Sloan, G. C., Uchida, K. I., Appleton, P. N., Armus, L., Burgdorf, M. J., Fajardo-Acosta, S. B., Grillmair, C. J., Ingalls, J. G., Morris, P. W., & Teplitz, H. I. 2004, ApJS, 154, 18
- Imanishi et al. (2007) Imanishi, M., Dudley, C. C., Maiolino, R., Maloney, P. R., Nakagawa, T., & Risaliti, G. 2007, ApJS, 171, 72
- Kóspál et al. (2008) Kóspál, Á., Ábrahám, P., Apai, D., Ardila, D. R., Grady, C. A., Henning, T., Juhász, A., Miller, D. W., & Moór, A. 2008, MNRAS, 383, 1015
- Krist (2002) Krist, J. 2002, Tiny Tim/SIRTF User’s Guide (Pasadena, SSC)
- Le Floc’h et al. (2005) Le Floc’h, E., Papovich, C., Dole, H., Bell, E. F., Lagache, G., Rieke, G. H., Egami, E., Pérez-González, P. G., Alonso-Herrero, A., Rieke, M. J., Blaylock, M., Engelbracht, C. W., Gordon, K. D., Hines, D. C., Misselt, K. A., Morrison, J. E., & Mould, J. 2005, ApJ, 632, 169
- Lepp & McCray (1983) Lepp, S., & McCray, R. 1983, ApJ, 269, 560
- Lípari et al. (2000) Lípari, S., Díaz, R., Taniguchi, Y., Terlevich, R., Dottori, H., & Carranza, G. 2000, AJ, 120, 645
- Markwardt (2009) Markwardt, C. B. 2009, ArXiv e-prints
- Menéndez-Delmestre et al. (2009) Menéndez-Delmestre, K., Blain, A. W., Smail, I., Alexander, D. M., Chapman, S. C., Armus, L., Frayer, D., Ivison, R. J., & Teplitz, H. 2009, ArXiv e-prints
- Nardini et al. (2008) Nardini, E., Risaliti, G., Salvati, M., Sani, E., Imanishi, M., Marconi, A., & Maiolino, R. 2008, MNRAS, 385, L130
- Peeters et al. (2004) Peeters, E., Spoon, H. W. W., & Tielens, A. G. G. M. 2004, ApJ, 613, 986
- Pérez-González et al. (2005) Pérez-González, P. G., Rieke, G. H., Egami, E., Alonso-Herrero, A., Dole, H., Papovich, C., Blaylock, M., Jones, J., Rieke, M., Rigby, J., Barmby, P., Fazio, G. G., Huang, J., & Martin, C. 2005, ApJ, 630, 82
- Pope et al. (2007) Pope, A., Chary, R.-R., Dickinson, M., & Scott, D. 2007, in Astronomical Society of the Pacific Conference Series, Vol. 380, Deepest Astronomical Surveys, ed. J. Afonso, H. C. Ferguson, B. Mobasher, & R. Norris, 387–+
- Rieke & Lebofsky (1985) Rieke, G. H., & Lebofsky, M. J. 1985, ApJ, 288, 618
- Rieke & Low (1972) Rieke, G. H., & Low, F. J. 1972, ApJ, 176, L95+
- Rigby et al. (2008) Rigby, J. R., Marcillac, D., Egami, E., Rieke, G. H., Richard, J., Kneib, J.-P., Fadda, D., Willmer, C. N. A., Borys, C., van der Werf, P. P., Pérez-González, P. G., Knudsen, K. K., & Papovich, C. 2008, ApJ, 675, 262
- Rigby & Rieke (2004) Rigby, J. R., & Rieke, G. H. 2004, ApJ, 606, 237
- Rigopoulou et al. (2002) Rigopoulou, D., Kunze, D., Lutz, D., Genzel, R., & Moorwood, A. F. M. 2002, A&A, 389, 374
- Roussel et al. (2007) Roussel, H., Helou, G., Hollenbach, D. J., Draine, B. T., Smith, J. D., Armus, L., Schinnerer, E., Walter, F., Engelbracht, C. W., Thornley, M. D., Kennicutt, R. C., Calzetti, D., Dale, D. A., Murphy, E. J., & Bot, C. 2007, ApJ, 669, 959
- Rupke et al. (2008) Rupke, D. S. N., Veilleux, S., & Baker, A. J. 2008, ApJ, 674, 172
- Sanders et al. (2003) Sanders, D. B., Mazzarella, J. M., Kim, D.-C., Surace, J. A., & Soifer, B. T. 2003, AJ, 126, 1607
- Sanders & Mirabel (1996) Sanders, D. B., & Mirabel, I. F. 1996, ARA&A, 34, 749
- Shaw et al. (2005) Shaw, G., Ferland, G. J., Abel, N. P., Stancil, P. C., & van Hoof, P. A. M. 2005, ApJ, 624, 794
- Sirocky et al. (2008) Sirocky, M. M., Levenson, N. A., Elitzur, M., Spoon, H. W. W., & Armus, L. 2008, ApJ, 678, 729
- Smith et al. (2007a) Smith, J. D. T., Armus, L., Dale, D. A., Roussel, H., Sheth, K., Buckalew, B. A., Jarrett, T. H., Helou, G., & Kennicutt, Jr., R. C. 2007a, PASP, 119, 1133
- Smith et al. (2007b) Smith, J. D. T., Draine, B. T., Dale, D. A., Moustakas, J., Kennicutt, Jr., R. C., Helou, G., Armus, L., Roussel, H., Sheth, K., Bendo, G. J., Buckalew, B. A., Calzetti, D., Engelbracht, C. W., Gordon, K. D., Hollenbach, D. J., Li, A., Malhotra, S., Murphy, E. J., & Walter, F. 2007b, ApJ, 656, 770
- Snijders et al. (2007) Snijders, L., Kewley, L. J., & van der Werf, P. P. 2007, ApJ, 669, 269
- Soifer et al. (2000) Soifer, B. T., Neugebauer, G., Matthews, K., Egami, E., Becklin, E. E., Weinberger, A. J., Ressler, M., Werner, M. W., Evans, A. S., Scoville, N. Z., Surace, J. A., & Condon, J. J. 2000, AJ, 119, 509
- Spoon et al. (2007) Spoon, H. W. W., Marshall, J. A., Houck, J. R., Elitzur, M., Hao, L., Armus, L., Brandl, B. R., & Charmandaris, V. 2007, ApJ, 654, L49
- Surace et al. (2004) Surace, J. A., Sanders, D. B., & Mazzarella, J. M. 2004, AJ, 127, 3235
- Thornley et al. (2000) Thornley, M. D., Schreiber, N. M. F., Lutz, D., Genzel, R., Spoon, H. W. W., Kunze, D., & Sternberg, A. 2000, ApJ, 539, 641
- Tommasin et al. (2008) Tommasin, S., Spinoglio, L., Malkan, M. A., Smith, H., González-Alfonso, E., & Charmandaris, V. 2008, ApJ, 676, 836
- Veilleux et al. (1995) Veilleux, S., Kim, D.-C., Sanders, D. B., Mazzarella, J. M., & Soifer, B. T. 1995, ApJS, 98, 171
- Veilleux et al. (2009) Veilleux, S., Rupke, D. S. N., Kim, D.-C., Genzel, R., Sturm, E., Lutz, D., Contursi, A., Schweitzer, M., Tacconi, L. J., Netzer, H., Sternberg, A., Mihos, J. C., Baker, A. J., Mazzarella, J. M., Lord, S., Sanders, D. B., Stockton, A., Joseph, R. D., & Barnes, J. E. 2009, ApJS, 182, 628
- Velusamy & Langer (2008) Velusamy, T., & Langer, W. D. 2008, AJ, 136, 602
- Verma et al. (2003) Verma, A., Lutz, D., Sturm, E., Sternberg, A., Genzel, R., & Vacca, W. 2003, A&A, 403, 829
- Wu et al. (2006) Wu, Y., Charmandaris, V., Hao, L., Brandl, B. R., Bernard-Salas, J., Spoon, H. W. W., & Houck, J. R. 2006, ApJ, 639, 157