Keck Spectroscopy of Field Spheroidals: Dynamical Constraints on the Growth Rate of Red “Nuggets”
Abstract
We present deep Keck spectroscopy for 17 morphologically-selected field spheroidals in the redshift range in order to investigate the continuity in physical properties between the claimed massive compact red galaxies (“nuggets”) at and well-established data for massive spheroidal galaxies below . By combining Keck-based stellar velocity dispersions with HST-based sizes, we find that the most massive systems (M M⊙) grew in size over as (1+z)-0.75±0.10 (i.e., since ) whereas intermediate mass systems () did not grow significantly. These trends are consistent with a picture in which more massive spheroidals formed at higher redshift via “wetter” mergers involving greater dissipation. To examine growth under the favored “dry” merger hypothesis, we also examine size growth at a fixed velocity dispersion. This test, uniquely possible with our dynamical data, allows us to consider the effects of “progenitor bias.” Above our completeness limit ( km s-1), we find size growth consistent with that inferred for the mass-selected sample, thus ruling out strong progenitor bias. To maintain continuity in the growth of massive galaxies over the past 10 Gyr, our new results imply that size evolution over , a period of 1.9 Gyr, must have been even more dramatic than hitherto claimed if the red sources at are truly massive and compact.
Subject headings:
galaxies: elliptical and lenticular, cD — galaxies: evolution1. Introduction
The observation that many red galaxies with large stellar masses at are 3–5 times more compact than equivalent ellipticals in the local Universe (e.g., Daddi et al., 2005; Trujillo et al., 2007; van Dokkum et al., 2008; Buitrago et al., 2008; Damjanov et al., 2009) has been a source of much puzzlement. How can an early galaxy grow primarily in physical size without accreting significant stellar mass as required if these objects are the precursors of the most massive ellipticals observed today? Furthermore, studies of the fundamental plane and other stellar population indicators do not permit substantial recent star formation since in massive galaxies, thus precluding growth by accretion of young stars or via gas-rich (“wet”) mergers (e.g., Treu et al., 2005, hereafter T05). Some have questioned the reliability of the observations, suggesting an underestimate of physical sizes or an overestimate of stellar masses (Hopkins et al. 2009b; however, see Cassata et al. 2009 for a contrasting view). Others have proposed size expansion driven by self-similar dissipationless “dry” mergers, or mass accretion from minor mergers (Khochfar & Silk, 2006; Naab et al., 2009; Hopkins et al., 2010, and references therein).
To verify the compact nature of distant sources and to track their evolution in size and mass, it is preferable to use dynamical masses Mdyn from absorption line spectra, which do not suffer from uncertainties associated with the assumed initial mass function and stellar mass estimates derived from broad-band photometry (e.g., Muzzin et al., 2009). Mdyn measurements are available for relatively large samples out to (T05; van der Wel et al. 2008, hereafter vdW08), suggesting a small but detectable difference in average size at fixed mass when compared to the local universe. But beyond , there is little high-quality dynamical data for field spheroidals. van Dokkum et al. (2009) undertook an heroic observation of a single source with a stellar mass and an effective radius kpc typical of compact galaxies at . The spectrum has a claimed stellar velocity dispersion of km s-1, suggesting a remarkably dense system. van Dokkum et al. postulate the initial dissipative collapse at of a high mass “core” but are unable to account for its subsequent evolution onto the scaling relations. The quantitative effect of minor mergers on the physical size of a galaxy involves many variables, and it is unclear whether such dramatic size evolution is possible while maintaining the tightness of the fundamental plane and its projections (Nipoti et al., 2009).
Interpretation of the observed trends at fixed Mdyn is further complicated by the so-called “progenitor bias” (van der Wel et al., 2009): if galaxies grow by dry mergers, the main progenitor of a present-day massive galaxy did not have the same mass at . Similarly, if galaxies become recognizable as spheroidals only above a certain threshold in stellar velocity dispersion that depends on redshift, it is clear that the addition of a new – and less dense – population could mimic a false evolutionary trend. This bias can be reduced by considering galaxy sizes at fixed . Foremost, changes very little under a variety of growth mechanisms (e.g., Hopkins et al., 2010) and it is therefore a better “label” than Mdyn to track the assembly history. Secondly, is closely correlated with stellar age (van der Wel et al., 2009) and therefore offers the most direct way to track the evolving population.
Given there is no clear consensus in understanding the continuity between the galaxy population at and that at , we have embarked on a campaign to measure and Mdynfor a large sample of field spheroidals at . This has recently become practical using multi-object optical spectrographs equipped with deep depletion red-sensitive CCDs. Our goal is to extend the earlier work at (T05, vdW08) to within 1 Gyr of the sample of ultracompact galaxies at . In this first analysis, we present new results spanning the redshift range .
We adopt a CDM cosmology with ; all magnitudes are in the AB system. A Chabrier IMF is assumed where necessary.
2. Sample and Observations
Our targets were selected from archival HST/ACS data in the EGS (GO 10134, PI: Davis), SSA22 (GO 9760, PI: Abraham & GO 10403, PI: Chapman), and GOODS-N (PI: Giavalisco) fields. For the EGS, we used the Bundy et al. (2006) catalog which matches CFHT (, Coil et al. 2004; , CFHTLS) and Palomar () photometry. Photometric redshifts are supplemented by spectroscopic redshifts from the DEEP2 survey. For SSA22, we used a photometric redshift catalog based on Subaru () and UH 2.2m () imaging kindly provided by P. Capak (2004). In GOODS-N, we used the Bundy et al. (2009) catalog which matches ACS and Subaru photometry. Galactic extinction corrections were based on the dust maps of Schlegel et al. (1998). The parent sample for spectroscopic study in EGS and SSA22 was defined by , , and ; in GOODS-N, the photometric criteria were and . All galaxies satisfying these criteria were visually inspected in the ACS images by one of us (RSE) and those with E/S0 or early-disk morphology retained.
Keck I LRIS observations were made for 14 EGS and SSA22 targets on 2009 June 26–28 in median seeing of . The 600 mm-1 grating blazed at 1 m was used, providing a velocity resolution of km s-1 at 9000 Å. The total integration times were 40.8 ks and 32.4 ks in the EGS and SSA22 fields, respectively. On 2010 April 5–6 LRIS observations were made of 7 GOODS-N targets with 34.8 ks of integration in seeing. One additional GOODS-N spectrum was secured with Keck II DEIMOS observations on 2010 April 11–12 using the 831 mm-1 grating. The LRIS data were reduced using the code developed by Kelson (2003). Spectra were extracted using optimal weighting based on Gaussian fits to the spatial profile. Telluric absorption correction and relative flux calibration were provided by a DA star observed at matching airmass at the end of each night.
3. Velocity Dispersions and Photometry
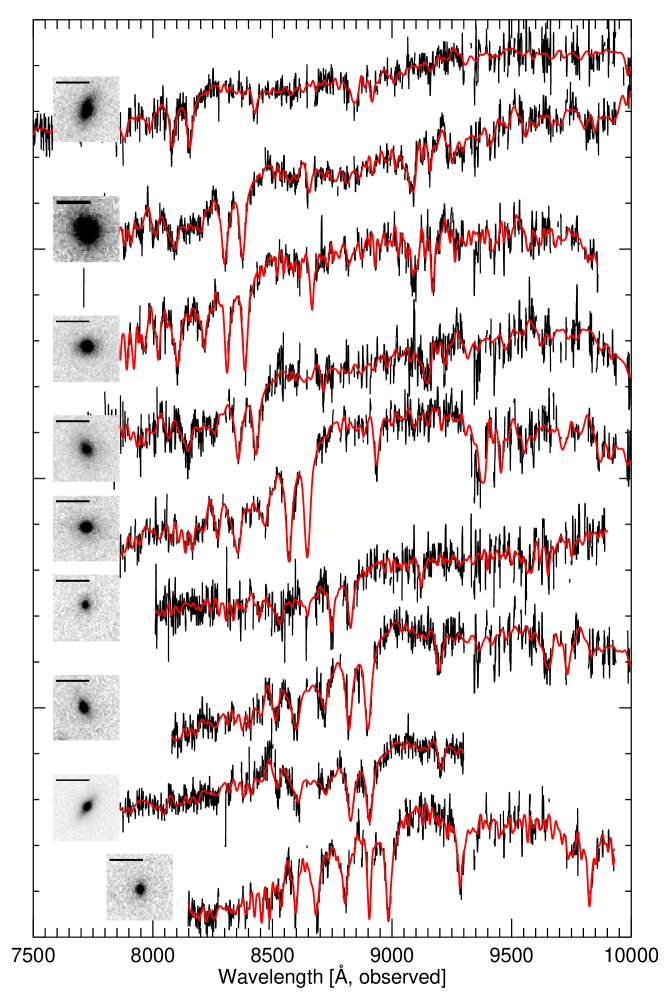
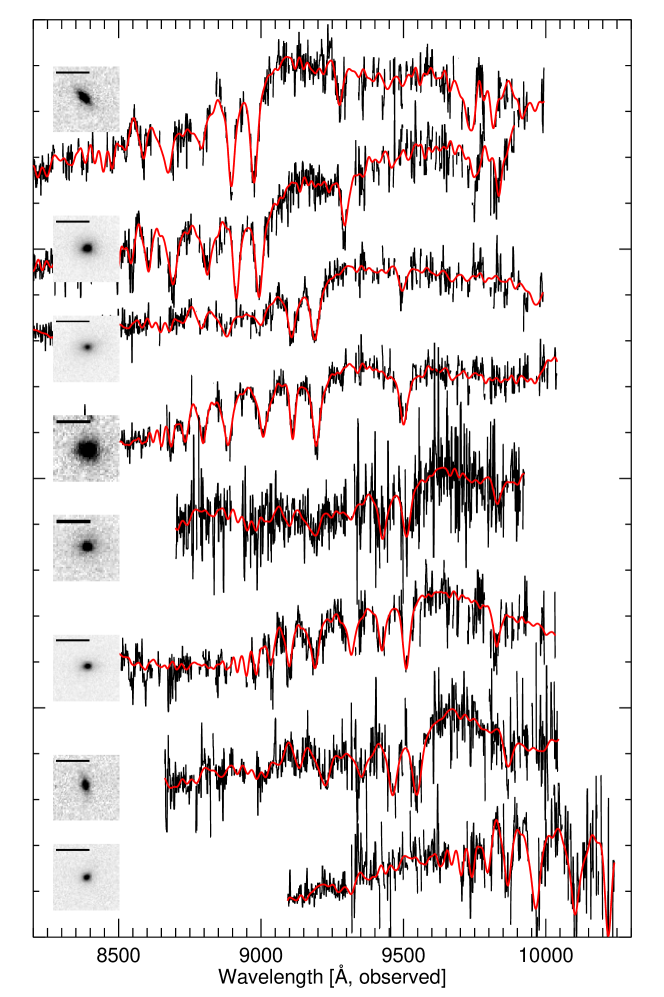
We measured stellar velocity dispersions, , by fitting broadened stellar templates using the PPXF code of Cappellari & Emsellem (2004). The instrumental resolution was measured using unblended sky lines; their variation with wavelength was well fit by a low-order polynomial. The template collection comprised 348 stars of type F0–G9 from the Indo-US coudé library (Valdes et al., 2004) with a range of metallicities and luminosities (classes III–V). We verified that including A star templates does not affect our measurements. For each galaxy, PPXF constructed an optimal template as a linear combination of these stellar spectra, although our results do not significantly differ if the best-fitting single template is used. To avoid systematic errors, we masked pixels contaminated by OH emission. Based on tests with the continuum filtering, sky masking threshold, and stellar template choices, we assigned a systematic uncertainty to each velocity dispersion, typically . We were able to secure a reliable dispersion for 17/22 galaxies (see Figs. 1 and 2). Velocity dispersions were corrected to an effective circular aperture of radius as described in Treu et al. (1999); the mean correction factor is 1.13.
Surface photometry was measured in the HST images using GALFIT (Peng et al., 2002) with a PSF determined from a nearby isolated star. F814W imaging was used in EGS and SSA22, while F850LP data were adopted in GOODS-N. For consistency with the local SDSS sample, we fit de Vaucouleurs profiles and determine circularized radii. We also fit Sérsic profiles but found that the mean Séersic index is consistent with 4 (i.e., de Vaucouleurs). We estimate uncertainties of in based on testing the background level, simulating the recovery of synthetic de Vaucouleur profiles placed in blank sky patches, and comparing with the independent measurements of vdW08 for the T05 subsample.
We convert the observed ACS magnitude to the rest magnitude by matching the observed color to a grid of Bruzual & Charlot (2003) single-burst models of varying age and metallicity. The uncertainty in this -correction is . Based on the optical and NIR photometry discussed in §2, stellar masses were estimated using the Bayesian stellar population analysis code developed by Auger et al. (2009). An exponentially-decaying star formation history was assumed. Table 1 summarizes the dynamical and photometric properties for our sample of 17 1 galaxies.
Our data allow us to compare photometrically-derived stellar masses to dynamical masses, which we define as . Overall these are in good agreement: , consistent with the difference between local dynamical and stellar masses inferred by Cappellari et al. (2006) and with the dark matter fractions (or heavier IMFs) found by independent methods (e.g., Graves & Faber, 2010; Treu et al., 2010).
| R.A. | Dec. | Morph. | MB | |||||||||
|---|---|---|---|---|---|---|---|---|---|---|---|---|
| E1 | 214.9853 | 52.9513 | S0? | 1.054 | 6.44 | -22.32 | 2.14 | 1.70 | 19.79 | 11.17 | ||
| S1 | 334.3529 | 0.2734 | E | 1.110 | 4.74 | -22.72 | 2.63 | 1.81 | 19.58 | 11.23 | ||
| E2 | 214.9702 | 52.9911 | E/S0 | 1.113 | 4.02 | -22.18 | 2.15 | 1.69 | 20.16 | 10.91 | ||
| E3 | 215.0061 | 52.9755 | Sab | 1.124 | 6.11 | -22.20 | 2.40 | 2.01 | 20.04 | 11.01 | ||
| E4 | 214.9847 | 52.9614 | E/S0 | 1.179 | 2.65 | -22.21 | 2.23 | 1.76 | 20.02 | 11.00 | ||
| E5 | 214.9815 | 52.9501 | E | 1.225 | 1.43 | -21.20 | 2.45 | 1.93 | 21.16 | 10.57 | ||
| E6 | 215.0351 | 52.9830 | S0 | 1.243 | 2.38 | -22.20 | 2.57 | 2.06 | 19.79 | 11.19 | ||
| GN1* | 189.2681 | 62.2264 | Sab | 1.253 | 1.29 | -22.19 | 2.79 | 2.07 | 20.26 | 11.07 | ||
| E7 | 215.1319 | 53.0163 | E/S0 | 1.262 | 1.57 | -21.83 | 2.58 | 2.02 | 20.43 | 10.90 | ||
| E8 | 215.1371 | 53.0173 | Sab | 1.262 | 1.38 | -21.90 | 2.38 | 1.90 | 20.76 | 10.91 | ||
| GN2 | 189.0634 | 62.1623 | E/S0 | 1.266 | 1.58 | -22.24 | 2.54 | 1.74 | 20.55 | 10.88 | ||
| GN3 | 188.9345 | 62.2068 | E/S0 | 1.315 | 3.44 | -22.32 | 2.77 | 2.07 | 20.45 | 11.01 | ||
| S2 | 334.3502 | 0.3032 | Sab | 1.315 | 2.47 | -22.37 | 2.29 | 1.51 | 20.80 | 10.69 | ||
| S3 | 334.4233 | 0.2256 | E/S0 | 1.394 | 2.50 | -22.01 | 3.20 | 2.44 | 20.74 | 11.09 | ||
| GN4 | 189.1132 | 62.1325 | E | 1.395 | 0.77 | -21.93 | 2.24 | 1.71 | 21.24 | 10.55 | ||
| E9 | 215.1219 | 52.9576 | S0/a | 1.406 | 1.19 | -22.02 | 2.39 | 2.19 | 20.82 | 10.83 | ||
| GN5 | 188.9625 | 62.2286 | E | 1.598 | 0.68 | -22.51 | 2.71 | 2.25 | 20.69 | 11.02 |
Note. — denotes systems with strong Balmer absorption. * denotes the DEIMOS observation. R.A. and Dec. are in the J2000 equinox. is in kpc. Velocity dispersions (in km s-1) are standardized to a circular aperture of radius , and uncertainties include the systematic component added in quadrature. MB is the rest-frame band absolute magnitude. and photometry has been interpolated to a uniform system of Bessell and SDSS . Dynamical mass uncertainties reflect the total uncertainty (statistical and systematic) in . Stellar masses assume a Chabrier IMF. The order of galaxies (by redshift) matches Figs. 1 and 2.
4. Size Evolution
Size evolution has commonly been studied by comparing spheroids of the same mass at different epochs. Although an unlikely evolutionary path for individual galaxies, it is the most observationally convenient approach, particularly at where dynamical measures are scarce. We first conduct this comparison in § 4.1. Following our discussion in §1, we then examine size evolution at fixed velocity dispersion in § 4.2.
4.1. Size evolution at fixed mass
We constructed a local reference sample for comparison purposes using SDSS DR7 spectroscopic data (Stoughton et al., 2002). Red sequence galaxies with were selected using a color cut (Eq. 1 of Yan et al., 2006). Velocity dispersions were corrected to a standard aperture of as in Jorgensen et al. (1995). The resulting mean dynamical mass–radius relation is kpc, based on de Vaucouleurs radii measured in SDSS and interpolated to rest band.111The relation is consistent with that of vdW08, taking into account the different apertures to which we normalize velocity dispersions.
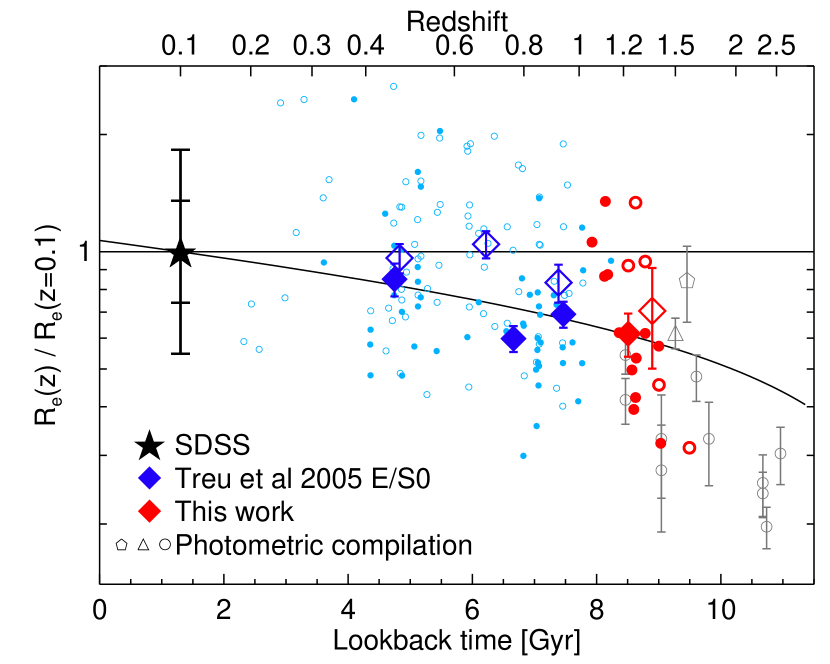
Figure 3 shows the size evolution inferred by comparing the present sample and the T05 E/S0 galaxies to this SDSS relation. The T05 and present samples are well-matched in morphology and rest optical colors and so comprise an excellent dataset for studying evolution over a wide redshift interval. A simple power law fit to the sample is indicated by the solid line. This corresponds to a 40% decrease in size by , and marginally slower evolution than that inferred by vdW08 for spheroidals (; corresponding to a 50% decrease at ). However, the difference is partly explained by the correction applied by vdW08 to their measured sizes based on simulations. In contrast, we do not apply any corrections to our measured sizes given the lack of consensus on this matter in the literature (see also Hopkins et al., 2009b; Mancini et al., 2010) and the results of our own simulations.
Our sample probes an epoch within 2 Gyr of the samples whose compact sizes have motivated the present work. Figure 3 illustrates that, given the size dispersion in the dynamical sample at a given redshift and the difficulties of comparing our dynamical sample with one whose masses are likely less precise, the sharp drop in size seen over this short time interval may not be that significant. If confirmed, however, the implied size evolution is quite large compared to the expected accretion from mergers over the same period, which we estimate to be 40% of a typical galaxy at .222Estimated using the merger rate calculator presented in Hopkins et al. (2009a). Thus, if minor mergers are responsible, these results imply a very high efficiency of for growing spheroids, just consistent with the upper end of estimates determined from merger simulations (e.g., Hopkins et al., 2010).
Also striking is the different trend seen in less massive galaxies (open diamonds in Figure 3). Although the high- samples are small and include some compact examples, we find no evidence for mean size evolution over , i.e. . This is consistent with a picture in which more massive galaxies formed earlier and from wetter mergers with more dissipation, creating more compact remnant spheroids (e.g., Khochfar & Silk, 2006; Trujillo et al., 2006), and at variance with the model proposed by van der Wel et al. (2009) in which lower-mass galaxies are the most strongly affected by progenitor bias and display the strongest evolution. However, we caution that the lower mass samples may be affected by selection effects, since the brighter – and therefore possibly larger – objects may be preferentially selected given our flux limits. This is not a concern for the 1011 M⊙ sample, where we are complete for any reasonable mass-to-light ratio. A characterization of the bias requires a self-consistent model with Monte Carlo simulations, which is beyond the scope of this Letter and is left for future work when larger samples will be available.
4.2. Size evolution at fixed velocity dispersion
Comparisons at fixed mass may be affected by “progenitor bias.” A preferred approach, when dynamical data are available, is to examine galaxies of the same velocity dispersion. This offers the two advantages discussed in § 1 and is illustrated in Figure 4. A cut in Mdyn includes only the largest galaxies at a fixed . Therefore, if galaxies below some threshold are missing from the high-redshift samples, this could mimic an evolutionary trend in mass-selected samples. According to the preferred prescription of van der Wel et al. (2009), km s-1 at . Therefore we should expect to see some effect for our sample, even though the presence of lower objects in our sample already suggests that the progenitor bias is not as strong.
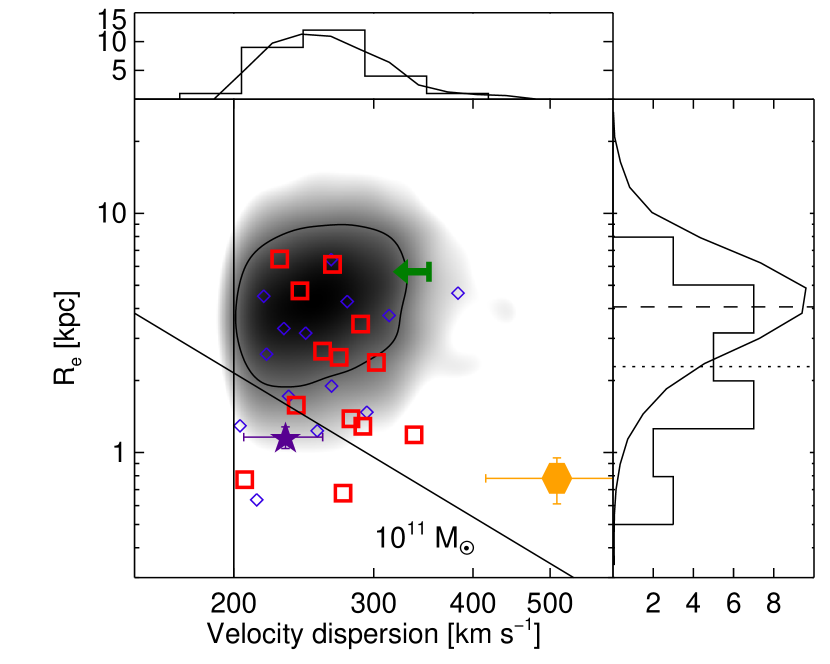
Figure 4 shows this comparison in terms of the plane. To avoid luminosity selection biases, we consider only galaxies with km s-1, where we are 90% complete, based on the SDSS distribution of luminosity at fixed and a conservative estimate of luminosity evolution, consistent with passive evolution of an old stellar population formed at . The SDSS galaxies (grayscale) are weighted so as to match the distribution of the sample (top panel). The right panel of Figure 4 then compares the size distributions of the local and samples at matching . By fitting for size evolution at fixed we find that sizes evolve as . The good agreement with the size evolution inferred at fixed mass rules out strong progenitor bias. A full evolutionary model with selection effects is needed to include objects with lower and quantify progenitor bias and size evolution more accurately. This is left for future work with larger samples.
5. Conclusions
Our Keck spectra have shown the utility of securing individual spectroscopic and photometric measures for a representative sample of massive spheroidals. By probing to , we are sampling velocity dispersions, sizes and dynamical masses within 1.2 Gyr of the puzzling population of compact red galaxies at .
Importantly, the size evolution we infer over at fixed dynamical mass is modest: for the most massive () examples but much smaller for lower mass systems. If the compact red galaxies at are their precursors, they must have grown dramatically in size over a very short time interval.
References
- Auger et al. (2009) Auger, M. W., Treu, T., Bolton, A. S., Gavazzi, R., Koopmans, L. V. E., Marshall, P. J., Bundy, K., & Moustakas, L. A. 2009, ApJ, 705, 1099
- Bruzual & Charlot (2003) Bruzual, G., & Charlot, S. 2003, MNRAS, 344, 1000
- Buitrago et al. (2008) Buitrago, F., Trujillo, I., Conselice, C. J., Bouwens, R. J., Dickinson, M., & Yan, H. 2008, ApJ, 687, L61
- Bundy et al. (2006) Bundy, K., et al. 2006, ApJ, 651, 120
- Bundy et al. (2009) Bundy, K., Fukugita, M., Ellis, R. S., Targett, T. A., Belli, S., & Kodama, T. 2009, ApJ, 697, 1369
- Capak (2004) Capak, P. L. 2004, Ph.D. thesis, University of Hawai’i
- Cappellari et al. (2006) Cappellari, M., et al. 2006, MNRAS, 366, 1126
- Cappellari et al. (2009) Cappellari, M., et al. 2009, ApJ, 704, L34
- Cappellari & Emsellem (2004) Cappellari, M., & Emsellem, E. 2004, PASP, 116, 138
- Cassata et al. (2009) Cassata, P., et al. 2009, arXiv:0911.1158
- Coil et al. (2004) Coil, A. L., Newman, J. A., Kaiser, N., Davis, M., Ma, C., Kocevski, D. D., & Koo, D. C. 2004, ApJ, 617, 765
- Daddi et al. (2005) Daddi, E., et al. 2005, ApJ, 626, 680
- Damjanov et al. (2009) Damjanov, I., et al. 2009, ApJ, 695, 101
- Graves & Faber (2010) Graves, G. J., & Faber, S. M. 2010, arXiv:1005.0014
- Hopkins et al. (2009a) Hopkins, P. F., et al. 2009a, arXiv:0906.5357
- Hopkins et al. (2010) Hopkins, P. F., Bundy, K., Hernquist, L., Wuyts, S., & Cox, T. J. 2010, MNRAS, 401, 1099
- Hopkins et al. (2009b) Hopkins, P. F., Bundy, K., Murray, N., Quataert, E., Lauer, T. R., & Ma, C. 2009b, MNRAS, 398, 898
- Jorgensen et al. (1995) Jorgensen, I., Franx, M., & Kjaergaard, P. 1995, MNRAS, 276, 1341
- Kelson (2003) Kelson, D. D. 2003, PASP, 115, 688
- Khochfar & Silk (2006) Khochfar, S., & Silk, J. 2006, ApJ, 648, L21
- Mancini et al. (2010) Mancini, C., et al. 2010, MNRAS, 401, 933
- Muzzin et al. (2009) Muzzin, A., Marchesini, D., van Dokkum, P. G., Labbé, I., Kriek, M., & Franx, M. 2009, ApJ, 701, 1839
- Naab et al. (2009) Naab, T., Johansson, P. H., & Ostriker, J. P. 2009, ApJ, 699, L178
- Nipoti et al. (2009) Nipoti, C., Treu, T., Auger, M. W., & Bolton, A. S. 2009, ApJ, 706, L86
- Onodera et al. (2010) Onodera, M., et al. 2010, arXiv:1004.2120
- Peng et al. (2002) Peng, C. Y., Ho, L. C., Impey, C. D., & Rix, H. 2002, AJ, 124, 266
- Saracco et al. (2010) Saracco, P., Longhetti, M., & Gargiulo, A. 2010, arXiv:1004.3403
- Schlegel et al. (1998) Schlegel, D. J., Finkbeiner, D. P., & Davis, M. 1998, ApJ, 500, 525
- Shen et al. (2003) Shen, S., Mo, H. J., White, S. D. M., Blanton, M. R., Kauffmann, G., Voges, W., Brinkmann, J., & Csabai, I. 2003, MNRAS, 343, 978
- Stoughton et al. (2002) Stoughton, C., et al. 2002, AJ, 123, 485
- Treu et al. (2010) Treu, T., Auger, M. W., Koopmans, L. V. E., Gavazzi, R., Marshall, P. J., & Bolton, A. S. 2010, ApJ, 709, 1195
- Treu et al. (2005) Treu, T., et al. 2005, ApJ, 633, 174
- Treu et al. (1999) Treu, T., Stiavelli, M., Casertano, S., Møller, P., & Bertin, G. 1999, MNRAS, 308, 1037
- Trujillo et al. (2007) Trujillo, I., Conselice, C. J., Bundy, K., Cooper, M. C., Eisenhardt, P., & Ellis, R. S. 2007, MNRAS, 382, 109
- Trujillo et al. (2006) Trujillo, I., et al. 2006, ApJ, 650, 18
- Valdes et al. (2004) Valdes, F., Gupta, R., Rose, J. A., Singh, H. P., & Bell, D. J. 2004, ApJS, 152, 251
- van der Wel et al. (2009) van der Wel, A., Bell, E. F., van den Bosch, F. C., Gallazzi, A., & Rix, H. 2009, ApJ, 698, 1232
- van der Wel et al. (2008) van der Wel, A., Holden, B. P., Zirm, A. W., Franx, M., Rettura, A., Illingworth, G. D., & Ford, H. C. 2008, ApJ, 688, 48
- van Dokkum et al. (2008) van Dokkum, P. G., et al. 2008, ApJ, 677, L5
- van Dokkum et al. (2009) van Dokkum, P. G., Kriek, M., & Franx, M. 2009, Nature, 460, 717
- Yan et al. (2006) Yan, R., Newman, J. A., Faber, S. M., Konidaris, N., Koo, D., & Davis, M. 2006, ApJ, 648, 281