Measurement of the slope parameter with the KLOE detector
Abstract
We present a measurement of the slope parameter for the decay, with the KLOE experiment at the DANE -factory, based on a background free sample of 17 millions mesons produced in radiative decays. By fitting the event density in the Dalitz plot we determine . The result is in agreement with recent measurements from hadro- and photo-production experiments.
keywords:
collisions , radiative decays , decaysPACS:
12.15Ff , 14.40Aq , 13.25JX1 Introduction
The decay , and 3, though is a major decay mode of the meson, violates isospin symmetry. Since contributions from the electromagnetic interaction are strongly suppressed by chiral symmetry [1] this decay is mainly due to the isospin breaking part of the QCD Lagrangian:
| (1) |
so that in principle it offers a way to determine the mass difference of the up-down quarks. Moreover, the selection rule allows us to relate the amplitudes for the two decays using isospin symmetry:
| (2) |
Theoretical predictions for the decay amplitude have been obtained in
the framework of Chiral Perturbation Theory (ChPT): the low energy
effective field theory for QCD. Leading order (LO) ChPT
predictions [2] based on current algebra
underestimate the decay rates by a factor of . One loop (NLO)
calculations which include the
rescattering effects [3] predict higher rates but
still below the observed values. Some improvements are obtained by
computing unitary corrections [4] to NLO using a dispersion relation for the decay amplitude
derived by Khuri and Treiman [5]. Recently, more
advanced calculations have become available. In reference [6] the
authors use U(3) ChPT, in combination with a coupled channels method,
and treat final state interactions by means of the Bethe Salpeter
equation obtaining good agreement with measured decay widths and
spectral shapes. In Reference [7] a full NNLO computation is performed showing
sizable corrections to the NLO result.
The Dalitz plot of a three body decay is described by two
kinematical variables which for three identical
particles in the final state, reduce to a single.
In the decay this variable is chosen by
convention to be:
| (3) |
where denote the energy of the i-th pion in the rest
frame (CM).
The variable lies in the interval , where
corresponds to events with
3 having all the same energy while for one is
at rest and the remaining two are emitted back to back.
The decay amplitude is represented at leading order in terms of
a single quadratic slope parameter :
| (4) |
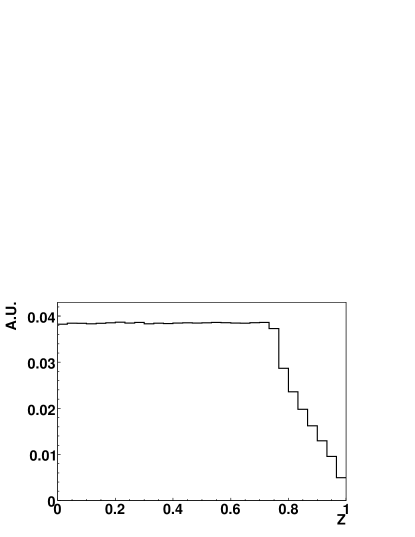
In case of pure phase space ( i.e. at leading order in ChPT) one has and the distribution is flat from to and then falls to zero at , see Fig. 1.
Recent measurements of with -mesons produced almost at rest in hadro- and photo-production experiments are reported in Table 1.
| Crystal Ball (2001) [8] | -0.031 0.004 |
|---|---|
| CELSIUS WASA [9] | -0.026 0.014 |
| WASA at COSY [10] | -0.027 0.009 |
| Crystal Ball at MAMI-B [11] | -0.032 0.003 |
| Crystal Ball at MAMI-C [12] | -0.032 0.003 |
| ChPT / LO | 0.000 |
| ChPT / NLO [3] | 0.015 |
| ChPT / NLO + unit. corrections [4] | -0.014 -0.007 |
| U(3) ChPT + Bethe Salpeter [6] | -0.031 0.003 |
| ChPT / NNLO [7] | 0.013 0.032 |
In the same Table are also shown the theoretical
estimates for previously described. The
predicted values show differences - due to large
cancellations in the amplitude computation - even quoting in some
case a positive sign for contrary to the experimental
evidence. A precise measurement of therefore
poses a significant constraint to theoretical models.
We present a new measurement of based on a large sample of
mesons produced in collisions via the radiative
decay .
2 DANE and KLOE
Data were collected with the KLOE detector at DANE [13],
the Frascati collider, which operates at a
center of mass energy MeV.
The beams collide with a crossing angle of mrad,
producing mesons with a small transverse momentum , 13 MeV/c.
The KLOE [14] detector is inserted in a 0.52 T magnetic field and it consists of a large cylindrical drift chamber (DC), surrounded by a fine
sampling lead-scintillating fibers electromagnetic calorimeter
(EMC).
The DC [15], 4 m diameter and 3.3 m long, has full stereo
geometry and operates with a gas mixture of 90% helium and 10%
isobutane.
Momentum resolution is . Position resolution in is 150 m and 2
mm. Charged tracks vertices are reconstructed with an accuracy of 3 mm.
The EMC [16] is divided into a barrel and two endcaps, and covers 98% of the solid angle.
It is segmented into 2440 cells of cross section cm2 in the plane perpendicular to the fibers. Each cell is read out
at both ends by photomultiplier tubes.
Arrival times of particles
and space positions of the energy deposits are obtained
from the signals collected at the two
ends; cells close in time and space are grouped into a calorimeter
cluster. The cluster energy is the sum of the cell energies, while
the cluster time and its position are energy weighted
averages. The energy and time resolutions are respectively
and . Cluster positions are measured with a resolution of 1.3
cm in the coordinate transverse to the fibers, and, by timing, of
in the longitudinal coordinate.
The KLOE trigger [17] is based on the coincidence of two
energy deposits with MeV in the barrel and MeV in the
endcaps. Moreover, to reduce the trigger rate due
to cosmic rays crossing the detector, events with a large energy
release in the outermost calorimeter planes are vetoed.
3 Event selection
The measurement is based on an integrated luminosity of 420 pb-1
corresponding to mesons produced.
This data sample contains about 17 millions of mesons.
The detector response to the decay of interest was studied by using
the KLOE MonteCarlo (MC) simulation program [18]. The MC
takes into account variations in the machine operation and background
conditions on a run-by-run basis.
A MC sample for both signal and backgrounds was produced for an integrated luminosity five times that of the collected data.
In the MC simulation of the decay, the
signal has been generated using our preliminary
measurement [19] of .
We search for: with and events.
To select the final state, we require to have seven prompt photons in the event.
A photon is defined as an EMC cluster not associated to a DC track.
We further require that , where is the arrival time at the EMC, is the
distance of the cluster from interaction point, IP, is speed of light.
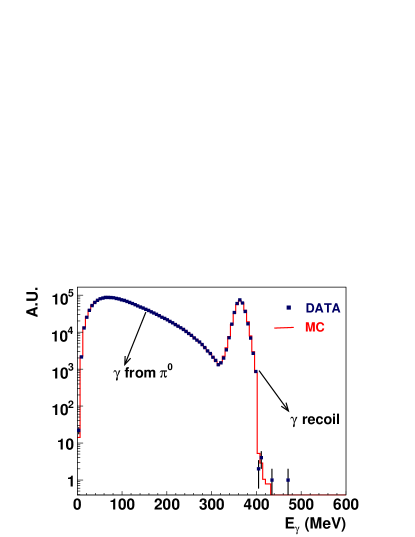
Fig. 2 shows the photon energy spectrum.
The recoil photon from the two body decay
is almost monochromatic, with MeV and
separated from the softer photons from decay.
All events must pass a first-level selection to filter machine background and an event classification procedure [18]. Events with the expected final state signature are selected by requiring:
-
1.
and only prompt photons with and MeV. The angle between any photon pair, , must be to reduce split showers. After these selection cuts we are left with events.
-
2.
A constrained kinematic fit imposing total momentum conservation and for each photon is performed. Input variables to the fit are the energies, times of flight and the coordinates of clusters in the EMC and the beam energies. The fit improves the photon energies resolution: the mass resolution of MeV improves to MeV after applying the kinematic fit. The selected events must satisfy the requirement corresponding to . After this cut we are left with 1.9 millions of events corresponding to a signal efficiency of . At this level, the residual background contamination, mainly due to decays to neutral channels, is estimated by MC to be %.
-
3.
To find the best combination (among 15) of the six less energetic photons into three a pairing procedure is applied. The procedure uses a pseudo- variable:
(5) where is the invariant mass of the photon pair, in corrispondence of the combination; is the corresponding mass resolution parametrized, as function of the photon energy resolution:
(6) the angular resolution contribution is negligible. In Fig. 3 a data-MC comparison of the minimum value of the pseudo-, is shown.
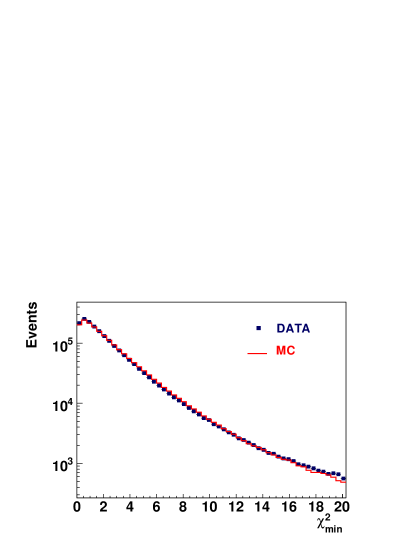
Figure 3: Distribution of , used to pair photons.(Dots: data, histogram: MC) The fraction of events with correctly paired photons, estimated from MC, is named in the following as purity, P, of the data sample. While we define WPf = 1 - P the wrong pairing fraction to ’s. To improve the purity a further cut is applied: . The distribution of the invariant mass of the two photons from decay, is shown in Fig. 4.
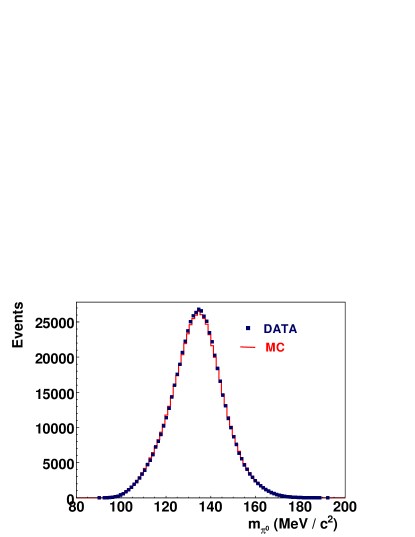
Figure 4: Invariant mass of the two photons from decay after cut . (Dots: data, histogram: MC). -
4.
After the photons pairing procedure a second kinematic fit is performed where the constraints on and mass are also imposed. For the mass we used the value MeV measured by our experiment [20]. This fit improves the resolution by a factor two.
We define three samples with different purity applying
different cuts on the difference of the two lowest values of
, , as reported in Table 2.
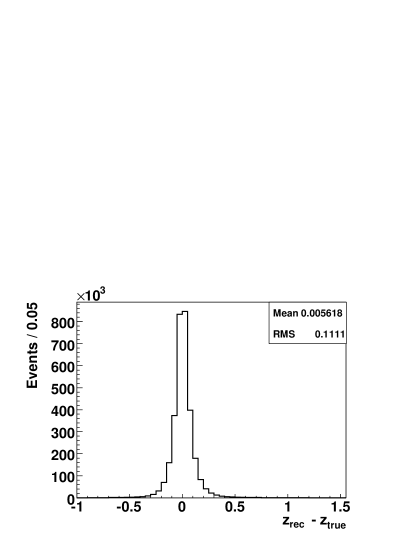
The resolution and efficiency as function of are shown in
Fig. 5 for the Medium purity sample.
The reconstruction efficiency, , is obtained by MC for each bin, as the ratio: where are respectively the
generated and reconstructed events.
 |
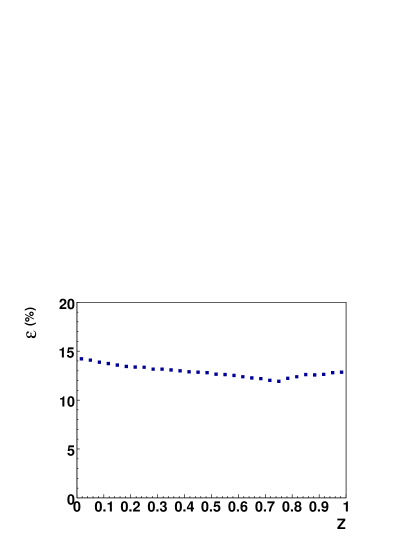 |
| cut | Samples | Purity | Efficiency | N. events |
|---|---|---|---|---|
| 2.5 | Low | 90.4 % | (20.07 0.01)% | 948471 |
| 5 | Medium | 95.0 % | (12.96 0.01) % | 614663 |
| 9 | High | 97.3 % | (7.04 0.01)% | 333493 |
The photon energy resolution is compared between data and MC looking at the distribution of ; i.e. the difference between photons energy in the rest frame. In Fig. 6 the distribution of is plotted.
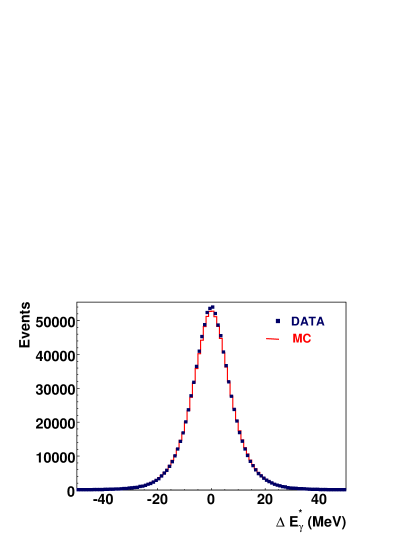
Estimating the r.m.s.
of the for
slices of 10 MeV in a difference of ( 1 1.5)% between data and MC is observed.
Consequently, the MC photon energies
have been smeared by this amount.
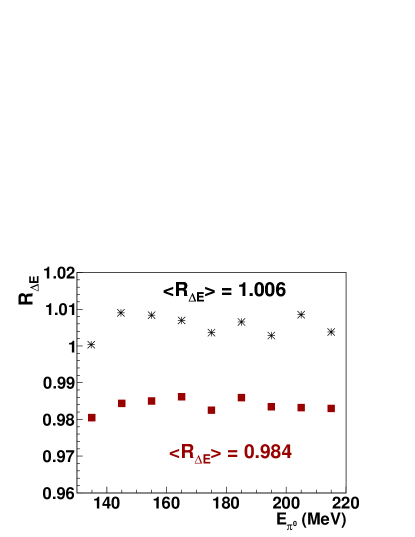
Fig. 7 shows the ratio .
The correction improves the agreement between data and MC
on this variable.
The residual difference, of %, is taken into account directly in the
evaluation of the result.
4 Measurement of the slope parameter
The fit to the Dalitz plot is done minimizing a log–Likelihood function built as follows:
| (7) |
where, for each bin: are the number of reconstructed events, the number of expected events, obtained from MC taking into account the detector resolution and WPf and weighted with . Moreover we correct for the data-MC differences in the WPf. To estimate it on data we use the distribution of variable reconstructed using the second best pairing combination,. This distribution is fit with the superposition of the MC shapes for events with good and wrong pairing respectively. The uncertainty on the WPf data-MC difference is taken into account in evaluating the systematic error.
The fit procedure has been tested on MC by verifying that the
fit reproduces in output the same input value, within the statistical
error.
To obtain the final result the
fit range , corresponding to the region of the phase
space in which the distribution is flat, and the
Medium purity sample is chosen.
The fit results for the three different Purity samples are shown in Table 3. Moreover, we have
applied a shift of on the slope parameter
to correct the residual data-MC
discrepancy in the photons energy resolution, see Section 3.
| Low Purity | Medium Purity | High Purity | |
|---|---|---|---|
| % | % | % |
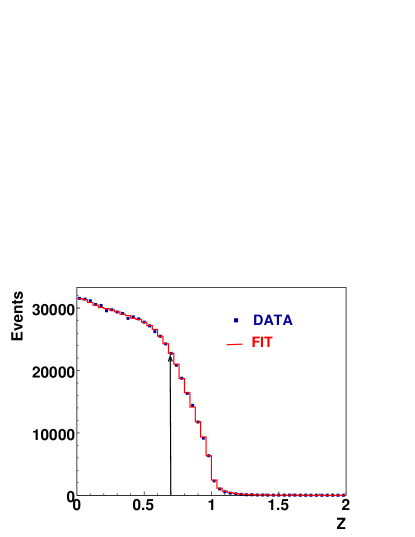
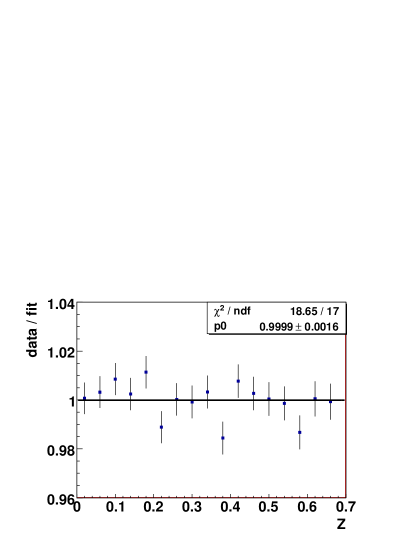
In Fig. 8 a comparison between the observed and fitted distributions is shown.
 |
 |
5 Systematic uncertainties
In the following we describe the sources of systematics. For each of them, the fit has been repeated varying the related sources and assuming as systematic error the difference with respect to the reference value. In Table 4 we have summarized all the systematic errors.
-
1.
Analysis cuts To control the stability of the result respect to our analysis cuts we have moved them independently. The cut on to reject split showers,, was varied in the interval in steps of . The photon energy threshold was also increased from 10 MeV to 40 MeV with a step of 5 MeV. The related systematic error is very small.
-
2.
Energy Resolution As shown in Fig. 7, the data-MC comparison of after correction shows a residual discrepancy of %. While the 0.6% correction has already been applied, we estimate the systematics related to its uncertainty to be
-
3.
mass This systematic effect has been estimated varying the mass on data by MeV accordingly to our measurement [20].
-
4.
Wrong pairing fraction For the sample used the data-MC ratio of WPf is 1.1 0.1. As mentioned in Section 4 the fit procedure takes into account this difference. To assign the systematic error we repeated the fit procedure varying the WPf within the % uncertainty quoted above.
-
5.
Purity As a check of the MC capability to reproduce the samples purity and its dependence upon , we show in Fig. 9 the ratio between the number of events for the High and the Low purity sample, , as a function of . A good agreement between data and MC throughout the fit range is observed. As systematic error, we take the difference between the values estimated using the Low and the High purity sample, see Table 3.
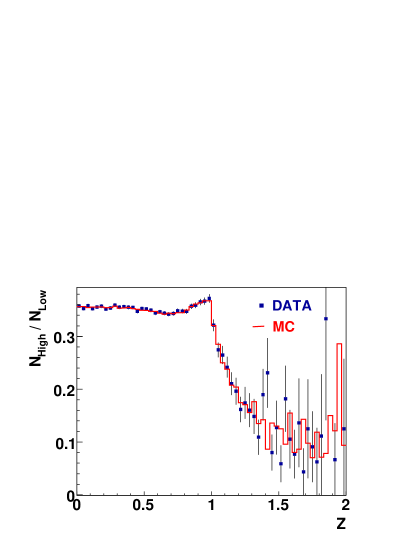
Figure 9: Ratio as a function of . (Dots: data, histogram: MC). -
6.
Fit range and binning The fit was repeated with different values of the fit range· from to with a step of 0.1. This is the largest systematic effect. Instead we find negligible effect when changing the bin size by a factor 2 from 0.04 to 0.02.
| Source | |
|---|---|
| Analysis cuts | -1 +1 |
| Energy resolution | -3 +3 |
| Mass | -2 +6 |
| Wrong pairing | -6 +5 |
| Purity | -18 +0 |
| Fit range | -29 +20 |
| Total | -35 +22 |
6 Conclusions
Using a clean sample of decays we have
measured the Dalitz Plot slope parameter obtaining
in
agreement with other recent results of comparable precision.
The above value is also consistent with
obtained from the KLOE study of the decay [21]
using the theoretical correlations between the two decay modes.
Our measurement confirms the inadequacy of simple
NLO ChPT computations and the need to take into account higher order
corrections.
Acknowledgements
We thank the DAFNE team for their efforts in maintaining low background running conditions and their collaboration during all data-taking. We want to thank our technical staff: G.F.Fortugno and F.Sborzacchi for their dedicated work to ensure an efficient operation of the KLOE computing facilities; M.Anelli for his continuous support to the gas system and the safety of the detector; A.Balla, M.Gatta, G.Corradi and G.Papalino for the maintenance of the electronics; M.Santoni, G.Paoluzzi and R.Rosellini for the general support to the detector; C.Piscitelli for his help during major maintenance periods. This work was supported in part by EURODAPHNE, contract FMRX-CT98-0169; by the German Federal Ministry of Education and Research (BMBF) contract 06-KA-957; by the German Research Foundation (DFG),’Emmy Noether Programme’, contracts DE839/1-4; and by the EU Integrated Infrastructure Initiative HadronPhysics Project under contract number RII3-CT-2004-506078.
References
References
- [1] D.G. Sutherland, Phys.Lett. 23 (1966) 384.
- [2] J. Bijnens and J. Gasser, Physica Scripta T99 (2002) 34.
- [3] J. Gasser and H. Leutwyler, Nucl. Phys. B 250 (1985) 539.
- [4] J. Kambor, C. Wiesendanger, D. Wyler, Nucl. Phys. B 465 (1996) 215.
- [5] N.N. Khuri and S.B. Treiman, Phys. Rev. 119 (1960) 1115.
- [6] B. Borasoy and R. Nissler, Eur. Phys. J. A 26 (2005) 383.
- [7] J. Bijnens and K. Ghorbani, JHEP 0711 (2007) 030.
- [8] W.B. Tippens, et al.,Crystal Ball Collaboration, Phys. Rev. Lett. 87 (2001) 192001.
- [9] M. Bashkanov, et al., CELSIUS/WASA Collaboration, Phys. Rev. C 76 (2007) 048201
- [10] C. Adolph, et al., WASA-at-COSY Collaboration, Phys. Lett. B 677 (2009) 24.
- [11] M. Unverzagt, et al., Crystal Ball at MAMI, TAPS and A2 Collaborations, Eur. Phys. J. A 39 (2009) 169.
- [12] S. Prakhov, et al., Crystal Ball at MAMI and A2 Collaborations, Phys. Rev. C 79 (2009) 035204.
- [13] M. Zobov, DAFNE Collaboration, Phys. Part. Nucl. Letters 5 (2008) 560.
- [14] F. Bossi,E. De Lucia,J. Lee-Franzini, S. Miscetti, M. Palutan and KLOE Collaboration, Rivista del Nuovo Cimento Vol.31, N.10 (2008).
- [15] M. Adinolfi, et al., Nucl. Instrum. Methods. A 488 (2002) 51.
- [16] M. Adinolfi, et al., Nucl. Instrum. Methods. A 482 (2002) 364.
- [17] M. Adinolfi, et al., Nucl. Instrum. Methods. A 492 (2002) 134.
- [18] F. Ambrosino, et al., Nucl. Instrum. Methods. A 534 (2004) 403.
- [19] F. Ambrosino, et al., KLOE Collaboration, arXiv: 0707.4137
- [20] F. Ambrosino et al., KLOE Collaboration, JHEP 12 (2007) 073.
- [21] F. Ambrosino et al., KLOE Collaboration, JHEP 05 (2008) 006.