Response to Comment on “X-ray Absorption Reveals Collapse of Single-Band Hubbard Physics in Overdoped Cuprates”
Abstract
A recent article suggested that the saturation of low energy spectral weight observed by X-ray absorption spectroscopy in the cuprates at high hole doping could be explained within the single-band Hubbard model. We show that this result is an artifact of inappropriate integration limits.
Recent measurements Schneider2005 ; Peets2009 by X-ray absorption spectroscopy (XAS) have shown an abrupt saturation in the oxygen edge low energy spectral weight at a hole doping around in several different overdoped cuprate systems. It has been argued Peets2009 that this could not be explained within the single-band Hubbard approaches commonly used to model the cuprates, possibly associated with the inapplicability in that doping regime of the basis state underpinning such approaches. Calculations have since indicated that the conclusions may be more general and more significant Wang2010 , being apparently at odds with the three-band Hubbard model which the single-band model is intended to approximate. However, calculations have recently been presented contending that the saturation can be explained within a single-band model Phillips2010 . We examine this assertion.
Since the (where is the nearest neighbor hopping integral and is the band width in a 2 dimensional square lattice) spectra that Phillips and Jarrell present are, as they mention, continuous, with no gap below the upper Hubbard band (UHB), a nontrivial choice of upper integration limit is required to generate the integrated density of states shown in the inset to their Figure 1. The cutoffs used, in units of , were for at all dopings and for at all dopings, or ( being the antiferromagnetic nearest neighbor exchange interaction). These somewhat arbitrary choices of integration cutoff are problematic to the point of effecting the qualitative doping dependence presented in their inset, for two reasons.
First, these narrow integration windows fail to capture a large fraction of the low energy spectral weight (i.e. the weight below the upper Hubbard band). Indeed, this cutoff is near the peak of one of the features of interest at low dopings, inherently missing around half of that peak’s weight. Clear evidence of the appropriateness of the authors’ cutoff can be seen in the unphysically low integrated weights in their inset — before even considering dynamical spectal weight transfer (DSWT), which is central to their argument, slopes at low doping in a Hubbard model must exceed unity per spin state to be physically meaningful. DSWT should increase this slope substantially at low dopings, particularly for the parameters chosen, which will tend to strongly enhance the spectral weight transfer. The slope in the inset for is clearly well below unity, making those points unphysical and in disagreement with the results in their references [7] Harris1967 and [8] Eskes1991 . The slope for is also below unity for all segments present (this curve extrapolates to a positive intercept, not zero as in the physical system which is an insulator, because the bandwidth exceeds ).
A paper by Meinders et al Meinders1993 provides a useful demonstration of the behavior expected within the Hubbard model. Meinders’ low energy spectral weight increases strongly with doping for low dopings, as seen in their Figure 3. Meinders’ points must be reduced by a factor of two for comparison to those in Phillips2010 , which are per spin. This results in expected slopes of about for the most comparable parameters, well above unity. Phillips and Jarrell used a more sophisticated approach Hettler1998 ; Jarrell2001 and in two dimensions rather than one, but the general arguments for spectral weight transfer are dimension-independent. The factor of 2 disagreement at low dopings between Meinders and Phillips is anomalously large, and that the parameters chosen by Phillips ought to result in even steeper slopes at low doping makes this disagreement particularly striking.
As for the choice of an , apart from the reasoning that integrating the low energy spectral weight (i.e. the weight below the UHB) requires integrating all of the weight below the UHB, comparisons to existing theory Meinders1993 ; Wang2010 or experiment Peets2009 require integrating to the gap or minimum below the upper Hubbard band as was done in that previous work. Choosing integration cutoffs consistent with experiment is particularly important in this case, since the purpose of Phillips’ paper is to explain the experimental data. The integration cutoff must be in the broad minimum found well above Phillips2010 ’s integration cutoff. The minimum below the UHB should be significantly clearer in the simulations, which were not shown.
Second, and more crucially, the cutoff must change with doping. Since hole doping (removing electrons) manifestly shifts the chemical potential, to which all energies in Phillips2010 are referenced, the low energy spectral weight and UHB are shifting with respect to the energy axis and integration window. This effect is clearly visible in Phillips’ paper itself, where the UHB weakens and moves to significantly higher energy on doping, consistent with the results in Meinders’ Figure 2 Meinders1993 . Indeed, Phillips’ UHB shifts by roughly three times the width of the integration window between and ; the peak of the low energy spectral weight shifts by about half that, but it should be gaining states on its low energy side, so this is unsurprising.
Experimental data Peets2009 clearly show the addition of weight on the low energy side of the lowest-energy prepeak as holes are added, moving the chemical potential further below the UHB. The upper integration limit in this paper, located in the minimum between the low energy prepeak and the UHB as mentioned above, was not changed with doping because zero in this case corresponds not to the chemical potential but to the energy of removing an electron from a 1s orbital, and should have negligible doping dependence (this electron does not exist in the single-band picture). It should be noted that the experimental data are broadened by about 0.5eV due to resolution and core hole lifetime effects, masking small features such as any pseudogap; the fact that the UHB can be clearly distinguished experimentally from the low-energy weight, especially at low doping, is indicative of a correlation-based gap significantly larger than that used by Philips. Meinders Meinders1993 had the benefit of a gap between the low energy spectral weight and the UHB, and integrated the former in its entirety and none of the latter. In this paper’s second figure, a shift in the density of states relative to the chemical potential may be clearly observed.
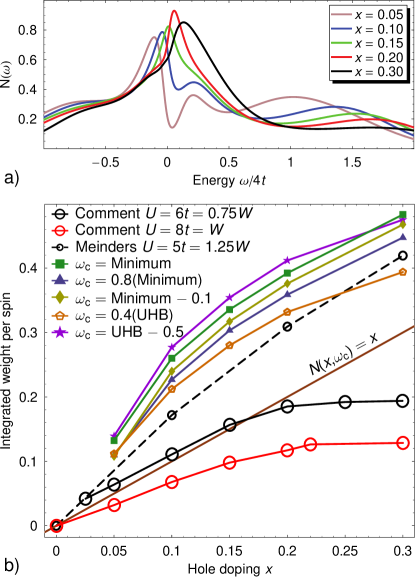
Failure to change the integration cutoff with doping can create Phillips’ reported doping dependence as an artifact, since the integration window effectively moves to exclude more spectral weight on doping. We reanalyzed Phillips’ and Jarrells’ spectra, integrating from zero to the minimum immediately below the UHB, using several different schemes to choose a cutoff (Figure 1). This captured roughly twice as much weight, gave physically reasonable slopes at low doping, and consistently failed to produce saturation at high dopings. The qualitative results were not sensitive to reasonable choices of cutoffs here, so long as the cutoffs were consistent. The reanalysed results have essentially the same doping evolution as that obtained by 1D exact diagonalization Meinders1993 , and are just as inconsistent with the experimental data.
A further qualitative explanation for the saturation is offered in Phillips2010 ’s final paragraph, in which the closing of the pseudogap halts the dynamical spectal weight transfer (DSWT). In fact, this is seen in the reanalyzed weights (Figure 1), where the slope returns to roughly unity around . Phillips’ and Jarrell’s weights do not return to a slope of unity when the slope ceases to be enhanced by DSWT, they fall to a slope of nearly zero. The slope per spin in a Hubbard model without DSWT is unity and with DSWT is well above unity, at least at low dopings, and in a Fermi liquid is 0.5. The Fermi liquid slope is easy to see: If we start electron doping a completely empty () Hubbard system, then each electron blocks one electron addition state; the UHB has vanishing weight here, so the slope is 1 per electron, or 0.5 per spin. If we had a system in this picture, we would start from an empty (, not half filled) band and add electrons at a slope of -1 (-0.5 per spin). Since there are two electron states per Cu (or one per spin), our initial value would be two (one) and we would cross half filling at a weight of 1 (0.5). In a Hubbard system at half filling there is no low-energy weight, and removing one electron creates two low energy electron-addition states, the second of which had previously been blocked by the electron thanks to the on-site repulsion . This leads to a slope of 2, or 1 per spin. Exact diagonalization in 1D has shown a smooth evolution from one regime to the other, with a slope of 0.5 per spin at . Having a slope of zero would require that one of these regimes evolve into the other nontrivially via a saddle compatible with neither picture.
Having reanalyzed Phillips’ and Jarrell’s calculations using integration limits consistent with those used on the experimental data and in previous theoretical work, we have shown their results to be consistent with 1D exact diagonalization and inconsistent with the experimental data. Unfortunately, we are forced to conclude that the substance of Phillips2010 is based entirely on an artifact of an inappropriate choice of integration cutoff. There remains no evidence that single-band Hubbard approaches can explain the XAS data at high dopings.
The authors gratefully acknowledge interesting discussions with P. Phillips, M. Jarrell, A. Millis, Xin Wang, and A. Liebsch. This work was supported by NSERC, the CRC program and BCSI.
Note: in the original PRL Peets2009 , the upper integration cutoff for Tl-2201 was incorrectly reported as 529.4eV, the same as for LSCO. In fact, the upper integration cutoff used for Tl-2201 was 528.8eV. All other cutoffs are correct in the published paper. This would not have come to our attention were it not for the work of P. Phillips and M. Jarrell, to whom the authors are grateful.
References
- (1) M. Schneider et al., Phys. Rev. B 72, 014504 (2005), arXiv:1003.3412v1.
- (2) D. C. Peets et al., Phys. Rev. Lett. 103, 087402 (2009), arXiv:0910.3457v1.
- (3) X. Wang, L. de’ Medici, and A. J. Millis, Phys. Rev. B 81, 094522 (2010), arXiv:1001.4791v2.
- (4) P. Phillips and M. Jarrell, (2010), arXiv:1003.3412v1.
- (5) A. B. Harris and R. V. Lange, Phys. Rev. 157, 295 (1967).
- (6) H. Eskes, M. B. J. Meinders, and G. A. Sawatzky, Phys. Rev. Lett. 67, 1035 (1991).
- (7) M. B. J. Meinders, H. Eskes, and G. A. Sawatzky, Phys. Rev. B 48, 3916 (1993).
- (8) M. H. Hettler, A. N. Tahvildar-Zadeh, M. Jarrell, T. Pruschke, and H. R. Krishnamurthy, Phys. Rev. B 58, R7475 (1998), arXiv:cond-mat/9803295v2.
- (9) M. Jarrell, T. Maier, C. Huscroft, and S. Moukouri, Phys. Rev. B 64, 195130 (2001), arXiv:cond-mat/0108140v1.