GRB 021004: Tomography of a gamma-ray burst progenitor and its host galaxy ††thanks: Based on observations taken with the ESO´s 8.2m Very Large Telescope in Chile.
Abstract
Aims. Analyse the distribution of matter around the progenitor star of gamma-ray burst GRB 021004 as well as the properties of its host galaxy with high-resolution echelle as well as near-infrared spectroscopy.
Methods. Observations were taken by the 8.2m Very Large Telescope with the Ultraviolet and Visual Echelle spectrograph (UVES) and the Infrared Spectrometer And Array Camera (ISAAC) between 10 and 14 hours after the onset of the event.
Results. We report the first detection of emission lines from a GRB host galaxy in the near-infrared, detecting H and the [O III] doublet. These allow an independent measurement of the systemic redshift () which is not contaminated by absorption as the Ly line is, and the deduction of properties of the host galaxy. From the visual echelle spectroscopy, we find several absorption line groups spanning a range of about 3,000 km s-1 in velocity relative to the redshift of the host galaxy. The absorption profiles are very complex with both velocity-broadened components extending over several 100 km s-1 and narrow lines with velocity widths of only 20 km s-1. By analogy with QSO absorption line studies, the relative velocities, widths, and degrees of ionization of the lines (“line-locking”, “ionization–velocity correlation”) show that the progenitor had both an extremely strong radiation field and several distinct mass loss phases (winds).
Conclusions. These results are consistent with GRB progenitors being massive stars, such as Luminous Blue Variables (LBVs) or Wolf–Rayet stars, providing a detailed picture of the spatial and velocity structure of the GRB progenitor star at the time of explosion. The host galaxy is a prolific star-forming galaxy with a SFR of 40 M⊙yr-1.
Key Words.:
(Stars:) Gamma-ray bust – Techniques: spectroscopic – Stars: Wolf-Rayet – Galaxies: starburst – Cosmology: observations1 Introduction
The afterglows of long-duration Gamma-Ray Bursts (GRBs), which are linked with the explosions of massive stars (see Woosley & Bloom, 2006, for a recent review), are the most luminous optical sources in the universe for short periods of time (Kann et al., 2007; Bloom et al., 2009). Low-resolution optical spectroscopy was initially only usable to determine the redshift and thus place them at cosmological distances (Metzger et al., 1997). Deeper insight came with the first medium-resolution spectrum, obtained with Keck ESI of the afterglow of GRB 000926 (Castro et al., 2003). The first true high-resolution echelle spectra were obtained for GRB 020813 (Fiore et al., 2005), but they were of low signal-to-noise ratio. The first echelle spectra with good S/N were finally obtained for GRB 021004, the focus of this work (see also Fiore et al., 2005).
Such spectroscopy allows deep insight into the environments of GRBs (Prochaska et al., 2006). Some highlights include the possible detection of a Galactic superwind in the host galaxy of GRB 030329 (Thöne et al., 2007), and variable absorption lines which result from direct UV pumping by the luminous GRB afterglow (Dessauges-Zavadsky et al., 2006; Vreeswijk et al., 2007; D’Elia et al., 2009). These detections have recently been possible for more afterglows due to the rapid localization capabilities of the Swift satellite (Gehrels et al., 2004) in combination with the rapid-response mode (RRM) which is now available for the Ultraviolet-Visual Echelle Spectrograph (UVES) at the Very Large Telescope (VLT) (e.g., Vreeswijk et al., 2007; D’Elia et al., 2009). Recently, the covered wavelength region has been expanded all the way from the ultraviolet into the band near-infrared (nIR) by the second-generation instrument X-Shooter at VLT (D’Odorico et al., 2006, see de Ugarte Postigo et al. 2009 for a first result).
GRB 021004 was detected at 12:06:14 universal time (UT) on 2002, October 4 with the gamma-ray instrument FREGATE, the wide-field X-ray Monitor (WXM) and the soft X-ray camera (SXC) aboard the High-Energy Transient Explorer (HETE-2) (Shirasaki et al., 2002). GRB~021004, was a moderately bright, long-duration ( s) event with fluences of erg cm-2 (7-30 keV) and erg cm-2 (30-400 keV) (Barraud et al., 2002).
The GRB was rapidly localized in flight and the position was reported in less than a minute, allowing rapid ground-based follow-up which revealed the presence of the fading optical afterglow of GRB 021004 (Fox et al., 2003). This prompted follow-up observations at many observatories, which led to an extensive long-term coverage at X-ray Sako & Harrison (2002a, b), radio (Frail & Berger, 2002; Berger et al., 2002; Pooley, 2002a, b)111See http://www.aoc.nrao.edu/dfrail/grb021004.dat for the complete VLA data set., millimeter (de Ugarte Postigo et al., 2005), near-IR (de Ugarte Postigo et al., 2005; Fynbo et al., 2005) and optical wavelengths, both ground-based (Fox et al., 2003; Bersier et al., 2003; Uemura et al., 2003; Holland et al., 2003; Pandey et al., 2003; Mirabal et al., 2003; Kawabata et al., 2004; de Ugarte Postigo et al., 2005) as well as space-based (Fynbo et al., 2005).
The isotropic energy release during the prompt emission of this GRB was modest, with log (Kann et al., 2010), and the dust extinction for this somehow reddish afterglow (R-K 3) was also low as is typical for many well-observed afterglows (Kann et al., 2006). Despite the low energy promptly released, this is among the most luminous afterglows ever detected (Kann et al., 2006), even in comparison with a much larger Swift-era sample (Kann et al., 2010). The multiwavelength temporal evolution of the GRB 021004 afterglow can be explained by multiple energy injections (Björnsson et al., 2004; de Ugarte Postigo et al., 2005), nevertheless other scenarios can not be discarded (Lazzati et al., 2002). GRB 021004 remains one of the most well-observed afterglows ever.
Early-time low and medium resolution spectroscopic observations allowed a redshift of to be determined on the basis of Ly- absorption and emission lines (Chornock & Filippenko, 2002). Several absorption systems with outflows velocities of few 1000 km s-1 were also reported (Salamanca et al., 2002; Savaglio et al., 2002) and studied in detail by Møller et al. (2002b), Wang et al. (2003), Matheson et al. (2003), Schaefer et al. (2003), Mirabal et al. (2003), Starling et al. (2005) and Lazzati et al. (2006). Jakobsson et al. (2005) also report the detection of the host galaxy Ly line in narrow-band imaging.
Fiore et al. (2005) have constrained the ionization parameters of the various absorption components detected above Ly (at an observer restframe of 4,050 Å) in GRB 021004, interpreting them as density fluctuations, like Lazzati et al. (2002) did. Within the context of larger samples, the UVES spectra of this GRB have also been studied by Chen et al. (2007) (the general lack of wind signatures in high-resolution spectra of GRB afterglows), Prochaska et al. (2008) (N V absorption lines toward GRB afterglows), Fox et al. (2008) (high-ionisation line systems toward GRB afterglows) and Tejos et al. (2007, 2009); Vergani et al. (2009) (study of Mg II foreground absorption systems).
The original expectation, as detailed high quality spectroscopy of GRB afterglows became possible, was that we would rapidly learn much about the GRB progenitors via the study of the complex absorption line systems they were expected to exhibit due to ejection events leading up to the final collapse. This expectation has far from proven true.
Despite the large number of long GRB afterglow spectra obtained since, GRB 021004 still stands out as the one with the most complex set of intrinsic (0-3,000 km/s ejection velocity) absorption systems. At the time it also held the place as the lowest detected HI column density, and it still ranks between the lowest seven found. The complexity originally suggested that it indeed represented a display of ejecta (Møller et al., 2002a; Mirabal et al., 2003; Fiore et al., 2005) but this interpretation was later disputed by Chen et al. (2007). A final interpretation of the complex systems has not yet been agreed on, and this object still stands our as the best candidate of a seemingly rare case where the signatures of events prior to the collapse are displayed. The rarity alone would warrant a more detailed discussion of the spectral features. In addition we are adding UVES data below 4050 ang for a more detailed discussion of the absorption systems (para 3.1) and near-IR VLT/ISAAC spectroscopy allowing a more accurate determination of host properties and redshift (para 3.2). We discuss our results in the light of progenitor models for GRBs in § 4, and summarize the work in § 5.
For a Hubble constant of H0 = 72 km s-1 Mpc-1, a matter density = 0.3, and a cosmological constant = 0.7, the luminosity distance to the host is dL = 18.22 Gpc, and the look-back time is 10.42 Gyr. All errors are given at a level of confidence for a parameter of interest unless stated otherwise.
2 Observations and data reduction
2.1 Optical observations
Observations were conducted with 8.2-m Very Large Telescope Units 1 (VLT/UT1, Antu) and 2 (VLT/UT2, Kueyen) at the European Southern Observatory (ESO) in Cerro Paranal (Chile). We obtained optical spectroscopy of the GRB afterglow starting 0.6 days after the burst using the Ultraviolet-Visual Echelle Spectrograph (UVES) on UT2. Contemporaneous nIR observations were taken using the Infrared Spectrometer And Array Camera (ISAAC) on UT1 (see Table 1 for a log of the observations).
The optical data reduction was performed using the UVES context running under MIDAS222MIDAS (Munich Imaging Data Analysis System) is developed and maintained by the European Southern Observatory (ESO). www.eso.org/projects/esomidas/midas-distrib.html. The UVES context is structured into reduction recipes allowing for data reduction in a semi-automatic manner. A master bias frame was used for the bias subtraction. The order tracing was performed taking advantage of a first guess calibration solution based on the UVES physical model. In all cases, except for the red spectrum centered at 8,600 Å which is affected by fringing effects, the flat field correction was applied after the order extraction. A Th-Ar lamp was used for wavelength calibration. The spectra were extracted using an optimal extraction method, which provides the object signal and the variance. After the extraction the spectra were resampled to constant wavelength bins and the orders merged into a single spectrum. Finally, both the standard heliocentric and vacuum wavelength corrections were applied.
2.2 Near-infrared observations
For the nIR observations we used the short wavelength mode in low resolution, which yields a spectral coverage of 1.42-1.83 m and 1.84-2.56 m in the H and K bands, respectively. The pixel scale of the ESO-Hawaii detector is 0146/pixel. For each band, 50 individual exposures of 60 seconds each were taken, shifting the target along the slit every 5 exposures in H (3 in K) in order to be able to remove the sky background, a standard technique in infrared astronomy. We also collected dark and flat field images, which were used in the reduction process performed with IRAF333IRAF is the Image Reduction and Analysis Facility, a general purpose software system for the reduction and analysis of astronomical data. IRAF is written and supported by the IRAF programming group at the National Optical Astronomy Observatories (NOAO) in Tucson, Arizona, USA.. After combining the groups of exposures and extracting the individual spectra, we calibrated them using the air-glow OH emission lines present in the 2 dimensional images. This allows an accurate wavelength calibration with dispersion of 4 and 8 Å/pix for H and K respectively. Finally, the individual spectra were median-combined into a single one. In the case of the H band spectrum we used a G2 spectral type star to remove the telluric absorption bands. The spectra were flux calibrated by means of the JHK-band observations that we obtained bracketing the spectral observations.
| UT Time | Instr. | Exp. | Spectral | S/N | Resolution |
|---|---|---|---|---|---|
| (start) | time (s) | Range (Å) | ratio444per resolution element. | ||
| 03:02 | UVES | 3600 | 3290-4520 | 1 | 56000 |
| 4620-5595 | 2.2 | 51500 | |||
| 5675-6645 | 2.7 | 51500 | |||
| 03:02 | ISAAC | 3600 | 14200-18300 | 5.2 | 500 |
| 04:10 | UVES | 3600 | 3050-3870 | 1 | 51300 |
| 4780-5755 | 3.7 | 50500 | |||
| 5835-6805 | 5.4 | 50500 | |||
| 05:15 | UVES | 3600 | 3750-4650 | 2.4 | 51500 |
| 6705-8520 | 4.1 | 52300 | |||
| 8665-10400 | 2.2 | 48700 | |||
| 05:27 | ISAAC | 3000 | 18400-25800 | 2.3 | 450 |
| Line ID | C2 | C1 | D | E2 | E1 |
|---|---|---|---|---|---|
| Si III 1,206 | y 555y = yes; = no; ? = doubtful, low significance due to low S/N ratio in the S IV region. | y | y | y | y |
| H I Ly 1,216 | y | y | y | y | y |
| N V 1,238-1,242 | y | y | |||
| Si II 1,260-1,264 | y | ? | y | ||
| C II 1,334 | y | y | |||
| Si IV 1,394-1,403 | ? | ? | ? | ? | y |
| C IV 1,548-1,551 | y | y | y | y | y |
| Al II 1,671 | y | y | y | ||
| Al III 1,855-1,863 | y | ||||
| Fe II 2,344-2,382 | y | ||||
| 2.29671 | 2.29935 | 2.3216 | 2.3275 | 2.32891 | |
| v (km/s)666relative to the systemic velocity of the host galaxy at z = 2.3304, which we set as zero. | 3,050777Embedded as C1 in the wide C complex (2,730-3,250 km s-1). | 2,810888Two subcomponents at 2,837 and 2,803 km s-1 (low ionization) and 2,860 and 2,810 km s-1 (high ionization). | 795999 Wide complex spanning 585-1,005 km s-1. | 262101010Embedded as E1 in the wide E complex (40-390 km s-1). | 134111111Two subcomponents at 150 and 114 km s-1. |
| (observed) (Å) | Line ID | EW (Å)121212Gaussian profile fitting (for non saturated lines only). Star symbols refer to complex systems. | z |
|---|---|---|---|
| 4008 | H I Ly 1215.670 | 2.2967 | |
| 4015 | Si III 1206.499 | 2.3275 | |
| 4016 | Si III 1206.499 | 2.3289 | |
| 4028 | C IV 1548.203 | 1.6024 | |
| 4038 | H I Ly 1215.670 | 2.3216 | |
| 4041 | H I Ly 1215.670 | 2.3243 | |
| 4045 | H I Ly 1215.670 | 2.3275 | |
| 4047 | H I Ly 1215.670 | 2.3289 | |
| 4049131313Emission line. Partially absorbed, Ly flux = (1.5 0.2) 10-16 erg cm-2 s-1. | H I Ly 1215.670 | 2.3304 | |
| 4084.0 | N V 1238.821 | 0.46 0.16 | 2.2967 |
| 4097.2 | N V 1242.804 | 0.35 0.15 | 2.2967 |
| 4123.9 | N V 1238.821 | 0.90 0.14 | 2.3289 |
| 4137.2 | N V 1242.804 | 0.66 0.12 | 2.3289 |
| 4158.5 | Si II 1260.422 | 0.25 0.10 | 2.2993 |
| 4195.8 | Si II 1260.422 | 0.71 0.19 | 2.3289 |
| 4210.2 | Si II 1264.738 | 0.51 0.16 | 2.3289 |
| 4347.4 | Al II 1670.787 | 0.49 0.17 | 1.6020 |
| 4399.6 | C II 1334.530 | 0.38 0.15 | 2.2968 |
| 4403.0 | C II 1334.530 | 0.79 0.14 | 2.2994 |
| 4639.7 | Si IV 1393.754 | 1.39 0.83 | 2.3289 |
| 4669.7 | Si IV 1402.770 | 1.29 0.46 | 2.3289 |
| 5104.0 | C IV 1548.203 | 1.77 0.12 | 2.2967 |
| 5107.8 | C IV 1548.203 | 0.16 0.03 | 2.2992 |
| 5108.5 | C IV 1548.203 | 0.84 0.10 | 2.2998 |
| 5112.5 | C IV 1550.777 | 1.15 0.09 | 2.2967 |
| 5116.2 | C IV 1550.777 | 0.06 0.04 | 2.2992 |
| 5117.0 | C IV 1550.777 | 0.67 0.08 | 2.2998 |
| 5138.3 | C IV 1548.203 | 2.3189 | |
| 5140.0 | C IV 1548.203 | 2.3200 | |
| 5143.1 | C IV 1548.203 | 2.3220 | |
| 5146.7 | C IV 1550.777 | 2.3188 | |
| 5146.7 | C IV 1548.203 | 2.3243 | |
| 5148.5 | C IV 1550.777 | 2.3200 | |
| 5148.5 | C IV 1548.203 | 2.3255 | |
| 5151.7 | C IV 1550.777 | 2.3220 | |
| 5152.9 | C IV 1548.203 | 2.3275+2.3289 | |
| 5155.2 | C IV 1550.777 | 2.3243 | |
| 5157.6 | C IV 1550.777 | 2.3255 | |
| 5161.5 | C IV 1550.777 | 2.3275+2.3289 | |
| 5235.4 | Si I 1572.718 | 0.80 0.10 | 2.3289 |
| 5559.5 | Al II 1670.787 | 0.23 0.07 | 2.3275 |
| 5561.9 | Al II 1670.787 | 1.73 0.12 | 2.3289 |
| 5578.0 | Fe II 2344.214 | 1.01 0.15 | 1.3796 |
| 5651.2 | Fe II 2374.461 | 0.52 0.06 | 1.3800 |
| 5652.4 | Fe II 2374.461 | 0.16 0.05 | 1.3805 |
| 5652.9 | Fe II 2374.461 | 0.13 0.02 | 1.3807 |
| 5671.2 | Fe II 2382.765 | 0.86 0.07 | 1.3801 |
| 5671.9 | Fe II 2382.765 | 0.41 0.06 | 1.3804 |
| 5672.6 | Fe II 2382.765 | 0.37 0.06 | 1.3807 |
| 6099.6 | Fe II 2344.214 | 0.59 0.04 | 1.6020 |
| 6101.7 | Fe II 2344.214 | 0.28 0.04 | 1.6029 |
| 6154.5 | Fe II 2586.650 | 0.67 0.08 | 1.3794 |
| 6155.0 | Fe II 2586.650 | 0.50 0.09 | 1.3798 |
| Fe II 2365.552 | 0.50 0.09 | 1.6020 | |
| 6174.2 | Al III 1854.716 | 1.15 0.09 | 2.3289 |
| 6178.0 | Fe II 2374.461 | 0.52 0.08 | 1.6020 |
| 6187.0 | Fe II 2600.173 | 0.67 0.10 | 1.3794 |
| 6187.5 | Fe II 2600.173 | 0.44 0.08 | 1.3798 |
| 6188.0 | Fe II 2599.147 | 0.50 0.09 | 1.3808 |
| 6201.0 | Al III 1862.790 | 0.73 0.12 | 2.3289 |
| 6202.0 | Fe II 2382.765 | 0.94 0.16 | 1.6028 |
| 6654.0 | Mg II 2796.352 | 1.95 0.11* | 1.3796 |
| 6655.5 | Mg II 2796.352 | 1.95 0.11* | 1.3802 |
| 6657.0 | Mg II 2796.352 | 0.71 0.08 | 1.3808 |
| 6671.0 | Mg II 2803.531 | 1.89 0.41* | 1.3796 |
| 6673.0 | Mg II 2803.531 | 1.89 0.41* | 1.3802 |
| 6729.0 | Fe II 2586.650 | 0.25 0.07 | 1.6016 |
| 6730.2 | Fe II 2586.650 | 0.60 0.07 | 1.6020 |
| 6732.5 | Fe II 2586.650 | 0.18 0.06 | 1.6029 |
| 6764.0 | Fe II 2600.173 | 0.56 0.10 | 1.6015 |
| 6765.5 | Fe II 2600.173 | 0.71 0.09* | 1.6020 |
| Fe II 2599.147 | 0.71 0.09* | 1.6030 | |
| 6768.0 | Fe II 2600.173 | 0.46 0.09 | 1.6029 |
| 6788.0 | Fe II 2607.866 | 0.14 0.05 | 1.6030 |
| 7274.2 | Mg II 2796.352 | 1.11 0.10 | 1.6015 |
| 7275.5 | Mg II 2796.352 | 0.83 0.08 | 1.6020 |
| 7277.0 | Mg II 2796.352 | 0.44 0.07 | 1.6025 |
| 7278.5 | Mg II 2796.352 | 0.83 0.08 | 1.6029 |
| 7293.0 | Mg II 2803.531 | 0.89 0.09 | 1.6015 |
| 7294.5 | Mg II 2803.531 | 0.98 0.09 | 1.6020 |
| 7296.0 | Mg II 2803.531 | 0.24 0.06 | 1.6025 |
| 7297.0 | Mg II 2803.531 | 1.00 0.10 | 1.6029 |
| 7803.7 | Fe II 2344.214 | 0.71 0.28 | 2.3289 |
| 7931.8 | Fe II 2382.765 | 0.46 0.21 | 2.3288 |
| 16520141414 Emission line.[O III] flux = (4 3) 10-17 erg cm-2 s-1. | [O III] 4960.295 | -(16 7) | 2.3304 |
| 16679151515Emission line.[O III] flux = (12 3) 10-17 erg cm-2 s-1. | [O III] 5008.240 | -(21 6) | 2.3304 |
| 21863161616Emission line. H flux = (11 2) 10-17 erg cm-2 s-1. | H I 6564.610 | -(37 10) | 2.3304 |
3 Results
3.1 The blueshifted absorption line systems
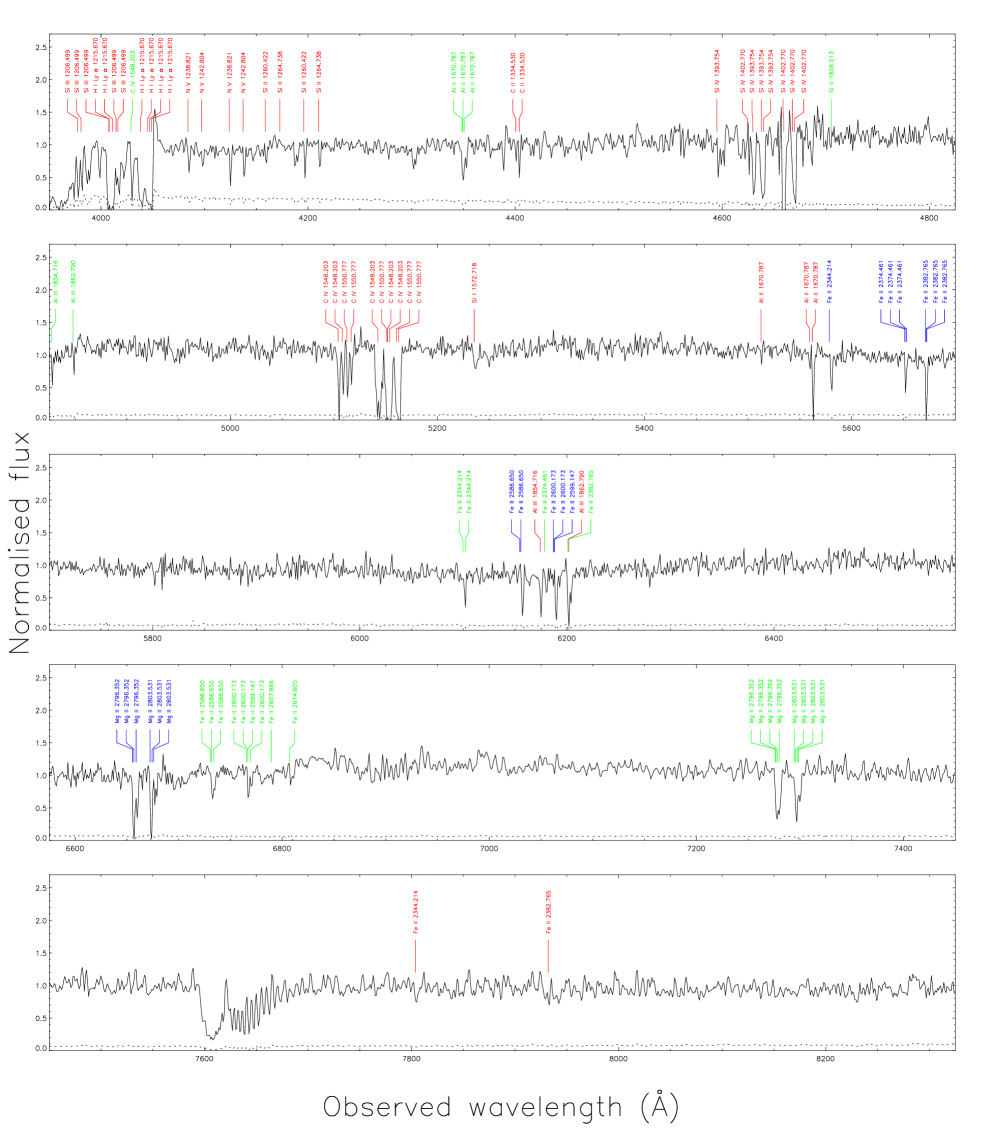
The VLT/UVES data set (Fig. 1) shows a large number of absorption lines, as well as Ly in emission (see Table 3 for a list, and also Møller et al. 2002b; Starling et al. 2005; Jakobsson et al. 2005 on the Ly emission line). Some of the absorption lines are due to two foreground systems at redshifts and (Møller et al., 2002b; Mirabal et al., 2003, see Tejos et al. 2007, 2009; Vergani et al. 2009 for further discussions on the foreground absorbers), but the remaining lines are from multiple systems found in the redshift range .
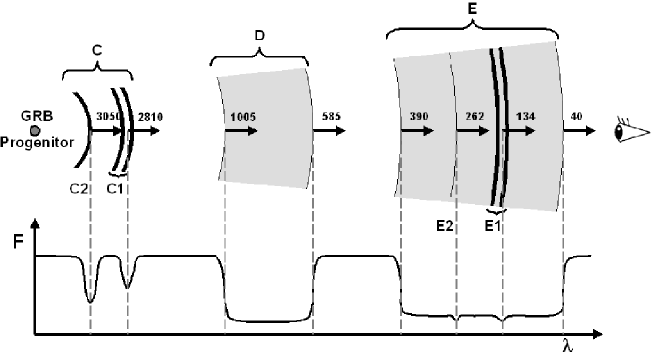
In Fig. 2 we show the three wide absorption line complexes in the redshift range . The absorption profiles are plotted in velocity space and marked C, D, and E following the naming convention used by Møller et al. (2002a). The higher resolution of the UVES spectrum allowed us to identify four narrow line systems embedded inside the velocity structure of the broad systems C and E. We name those systems C1, C2, E1 and E2. In the following we discuss all of those systems in more detail in order of increasing velocity relative to the host redshift (, see § 3.2).
E complex: The Ly absorption width translates to velocities in the range 40–470 km s-1, while in C IV (where we observe the narrowest trough), the range is 40–390 km s-1. The difference in the high-velocity cut-offs (390 vs. 470 km s-1) is most easily understood as a column density effect, i.e., the column density of the high velocity end is too low for C IV to be detectable. Alternatively it could be caused by lower metallicity in the higher velocity gas of system E, or a different ionization. The simplest interpretation of the E complex is that it is caused by gas, spanning velocities from 40–470 km s-1 and densities decreasing from the slowest to the fastest moving part. Similar profiles have been observed in QSO broad absorption line (BAL) systems, where velocities up to have been found. BAL systems are interpreted as velocity broadening due to ejection and/or radiative acceleration. Such BAL-like absorption troughs are not meaningfully fitted by standard (Voigt) profiles that assume a Gaussian velocity field.
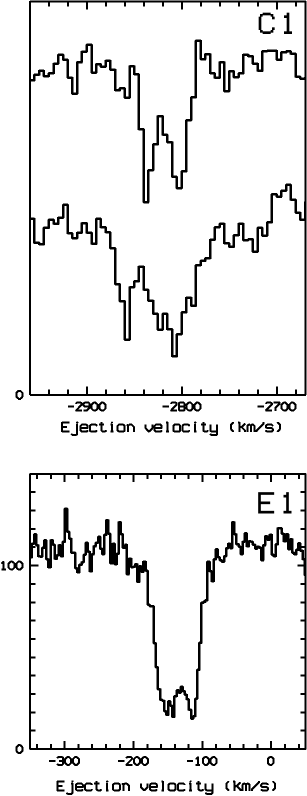
Embedded in the E complex are two narrow line systems at 134 km s-1 (E1) and 262 km s-1 (E2). The strongest component, E1, splits equally into two subcomponents at 114 km s-1 and 150 km s-1 (see Fig 3) and exhibits absorption from a large number of both high and low ionic species (N V, C IV, Fe II, Al II, Al III, Si II, Si III, Si IV). The metal line absorption of E1 has similarities to so-called damped Ly (DLA) systems, which in a few cases have been identified with high redshift, star forming galaxies (Møller et al., 2002b) but it has too low HI column density in this sightline to be considered a DLA. Still, E1 is the system most likely to be identified with the interstellar medium (ISM) in the host galaxy of the GRB, whereby the velocity offset between the host and the ISM ( 134 km s-1) represents the velocity of the local absorbing cloud within the host. High and low ionic species are also seen in the second system (E2), but at lower significance. The two rightmost dotted vertical lines in Fig 2 mark the systems E1 and E2.
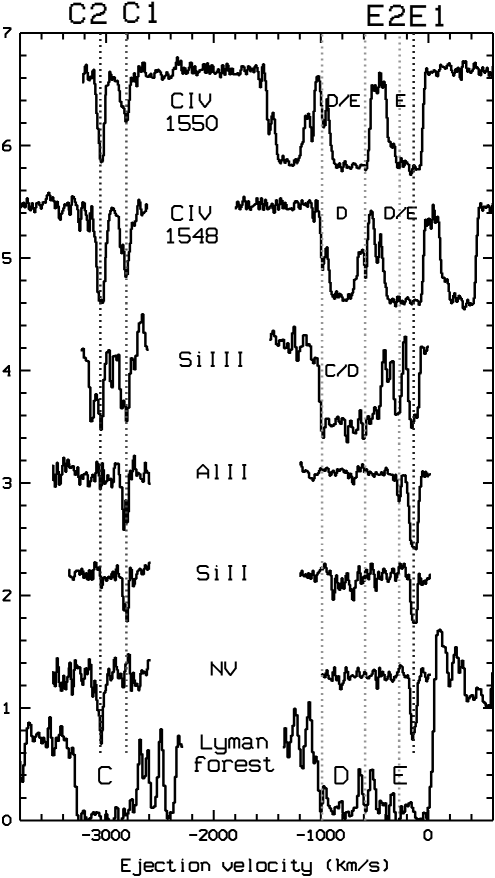
D Complex: The D complex consists of a single, wide BAL-like component seen in Ly, C IV, and Si III. Both the C IV (1,548 Å) and the Ly troughs give a consistent relative velocity range from 585 to 1,005 km s-1. We find residual flux at the bottom of both the Ly and C IV (1,548 Å) troughs indicating that the gas is optically thin. We also see significant variations in the optical thickness as a function of relative velocity; in particular one will notice the two sharp “dips” marking shells of higher column density at the leading and the trailing edge. Those dips are seen in Ly, in both C IV lines and in Si III (marked by dotted lines in Fig 2). The Si III trough is optically thick between those two edges, but then appears to have an optically thin extension towards lower ejection velocities. However, this trough overlaps with Ly of system C, and the extension is found to belong to system C (see below). .
It is remarkable that the D and E systems are separated in velocity by exactly the amount required to shift the C IV 1,550 Å line complex right on top of the C IV 1,548 Å one in the spectrum (Møller et al., 2002b; Savaglio et al., 2002). Such a shift is known as absorption-absorption “line-locking” and is not uncommon in QSO spectra where radiative acceleration is important (e.g., Srianand et al. 2002). The line-locking between the D and E systems strongly suggests that a process similar to that seen in intrinsic QSO absorption systems is indeed involved here, i.e. radiative acceleration.
C Complex: As discussed above, the wide Ly trough of system C is partly due to Si III absorption from system D, but also contains Ly absorption of a wide component spanning the velocity range 2,730–3,250 km s-1 as we detect C II, C IV, Si II, Si III, Al II and N V absorption in this velocity range (Fig. 2). The finely tuned velocity offset which causes a precise overlap between the Ly (C complex) and Si III (D complex) lines could be due to chance coincidence (although with small probability, see below). Given the evidence for line-locking between the two C IV lines between systems D and E, the overlap is most likely the result of radiative acceleration leading to line-locking of two expanding shells corresponding to the C and D complexes.
Embedded in C we identify two narrow systems at 3,050 km s-1 (C2) and at 2,810 km s-1 (C1). C2 is a high ionisation system displaying strong N V and C IV absorption, but no absorption from singly ionized ions. C1 is a low ionization system with moderate C IV absorption and clear detections of the singly ionized species Al II and Si II, which usually identifies a cloud optically thick at the Lyman limit (see Table 3). Most likely C2, although farthest away from the host redshift in velocity space,corresponds to the part of the wind that is nearest to the progenitor site in physical space. This ionization–velocity correlation is also observed in QSOs: the high ionization lines are often seen at the highest relative velocities for the absorption systems in QSO spectra (e.g., Møller et al. 1994). As for E1, C1 splits into two subcomponents, detected at 2,803 km s-1 and 2,837 km s-1 (low ionization) and at 2,810 km s-1 and 2,860 km s-1 (high ionization). Again, we here have the ionization-velocity correlation seen already between C1 and C2 (Fig. 2). Similarly to Fiore et al. (2005) we do consider C1 as part of the ejected systems simply on the basis of the low probability for it to be extrinsic, although we cannot exclude its association to the neighbour galaxy detected by HST (Chen et al., 2007). In that case, it should be realized that the comparatively low H I column density reported by Fynbo et al. (2005) would be the sum of the H I column of the two galaxies, such that they both have even lower H I columns.
3.2 The near-IR emission lines
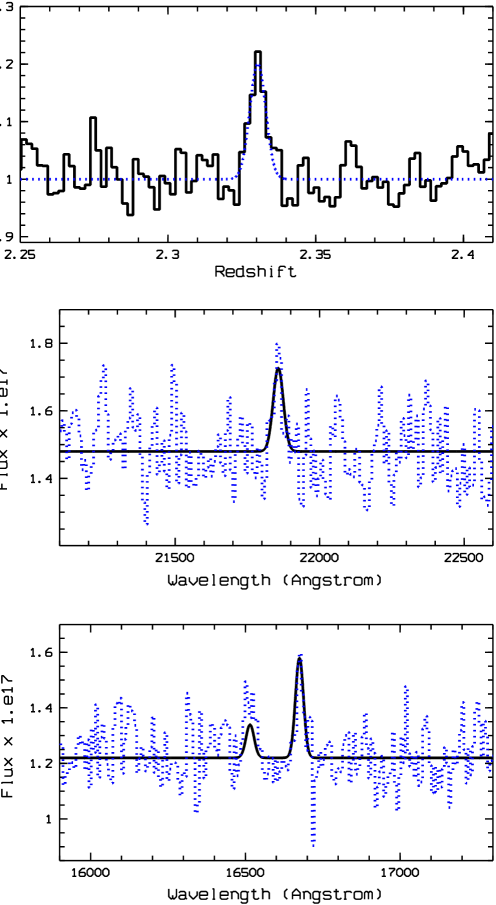
Assuming a redshift of the host of (Møller et al. 2002b, based on Ly emission) we searched the ISAAC spectra for redshifted lines of H I (H, H) and [O III] (4,959 Å/5,007 Å). There are tentative detections at low significance of H and the [O III] lines. In order to confirm the reality of the lines we used the method we introduced in Jensen et al. (2001). Briefly the method involves rebinning the spectra into redshifts for the rest wavelength of each expected line, in our case the lines of H and [O III] (4,959 Å/5,007 Å). The three “redshift spectra” were then coadded (with weights 2, 1 and 1 because of the slightly higher S/N of the tentative H detection). The resulting combined line is clearly detected, as shown in Fig. 4.
To this combined line we fit a Gaussian (overplotted as a blue dotted line) and we measure the systemic redshift to be , which is significantly different from the values derived from the Ly emission line (which may be absorbed or modified by resonant scattering) or from the absorption systems (which are affected by the local velocity of the absorbing cloud in the host galaxy). The width of the Gaussian is found to be exactly the spectral resolution, so the lines are unresolved and we can place an upper limit on the intrinsic line width of 600 km s-1 FWHM.
Using a redshift of 2.3304 and the width of the resolution profile, we now fitted Gaussian profiles to the data (with continuum level and amplitude of the Gaussian as the only free parameters) using min-square deviation. For the two [O III lines we further imposed a 1:3 flux ratio (Osterbrock (1989)), we found the following fluxes: flux = (4 1) 10-17 erg cm-2 s-1 ([O III] 4,959 Å), (12 3) 10-17 erg cm-2 s-1 ([O III] 5,007 Å) and (11 2) 10-17 erg cm-2 s-1 (H). The H flux is consistent with zero.
4 Discussion
Following the suggestion that there is often a link between long-duration GRBs and core-collapse supernovae (Stanek et al., 2003; Hjorth et al., 2003) as proposed in 1993 (Woosley, 1993) we know that GRBs arise as the end stages of massive-star evolution. As we describe below, the results presented here provide independent evidence for a massive star ( 40 M⊙) progenitor and give additional insight into the immediate surroundings and prior evolution of the star leading up to the catastrophic event.
4.1 A LBV / Wolf-Rayet progenitor
The probability that the three absorption systems C1, C2, and D lie in front of the GRB host galaxy as a chance coincidence is very small and can be computed using the number density of intervening C IV absorbers at of per unit redshift (Sargent et al., 1998). We find that the probability to find three of them within the redshift range spanned by C1, C2, and D is . Fiore et al. (2005) used a similar argument but added the column densities to obtain an even smaller probablility. Like Fiore et al. (2005) we conclude that the absorbers must be intrinsic to the host galaxy. The large blue shift then makes it unlikely that the physical location can be anywhere else than close to the GRB progenitor.
Furthermore, the probability that the C IV 1,550 Å line for complex E falls on top of the C IV 1,548 Å line for complex D and the Ly line for system C falls on top of the Si III line for system D by chance is small, of order a few percent for each, although difficult to quantify due to the complex profiles. Therefore, it makes sense to seek a physical explanation for the complex structure of the C, D, and E systems.
The multiple absorption line systems found in the spectrum of GRB 021004 are naturally explained by multiple shell structures formed by the stellar winds of a massive progenitor star (Schaefer et al., 2003). Such line-driven winds are expected for very massive stars (Castor et al., 1975; García Segura et al., 1996) that end their lives as Wolf–Rayet stars (WR) (de Koter et al., 1997), after passing through an unstable Luminous Blue Variable (LBV) phase (Langer et al., 1999). Stellar evolution calculations for massive stars predict a number of different phases in which the wind properties associated with those phases, i.e., the velocities and mass-loss rates, become strongly time-varying (Langer et al., 1999; Maeder, 1983). The minimum initial mass for a star to become a LBV is 40 M⊙ (Langer et al., 1994; Maeder and Meynet, 2000). During the course of their evolution, starting as O-class stars (O LBV WR SN), stars have distinct winds in which their velocities are proportional to the escape velocities. Thus, for each transition where a fast wind (i.e., when the stellar radius was small) follows a slow one (larger stellar radius), a shell of swept-up material is formed. Within this simple scheme, computations of the circumstellar medium around a 60 M⊙ star at the zero-age main sequence (García Segura et al., 1996) may produce the number of distinct compressed shells in the kinematic range seen in Fig. 2.
During the LBV phase, when hydrogen shell burning occurs, the stellar models are affected by several instabilities that cannot yet be modelled self-consistently and thus the unstable LBV phase can not be fully resolved (Langer et al., 1994). However, several LBV observations show that a number of different swept-up shells can be formed. In particular, the D complex discussed above is akin to the Homunculus nebula around Car, which contains 1 M⊙ and expands in the range 700 and 1,000 km s-1 (Humphreys and Davidson, 1994). As the formation of each of these swept-up shells occurs when the LBV reaches the Eddington limit (Langer et al., 1999), massive stars are able to form several compressed shells before ending their lives.
We note that, since the LBV stellar wind is asymmetric and often leads to a bipolar or at least asymmetric nebula (Gruendl et al., 2000), the GRB has to be beamed in the same direction as the wind for us to see the shells in absorption. Similar, but less spectacular, complex absorption has been detected in GRB 030226 (Klose et al., 2004, but see Shin et al. 2006) and GRB 050505 (Berger et al., 2006); this effect is not seen, however, in several other cases with similar quality data (Chen et al., 2007). It is possible, therefore, that GRBs where no such complex velocity structure is seen have a different orientation of the wind and GRB jet. Highly ionized gas ( K) like C IV, N V or Si IV, similar to that found in the environment of GRB 021004, has already been reported in a number of galactic ring nebulae surrounding Wolf-Rayet stars (Boronson et al., 1997). To form such gas shells, forward shocks with km s-1, or reverse shocks with – km s-1 are required. The most natural explanation for the C complex is that it has been formed at the WR phase, with C1 and C2 lying in an expanding free wind, before reaching the shocked stellar wind. In fact, the ionization-velocity correlation seen in the systems C1 and C2 has also been detected in WR nebulae, but at lower velocities ( 100–150 km s-1; Smith et al. 1984).
In addition to the detailed picture of the spatial and velocity structure of the GRB progenitor star at the time of explosion (Fig. 5) our observations have also provided insight into the physical mechanism producing the progenitor shell structure. The fact that the C1 and C2 profiles are not P-Cygni, but almost symmetric profiles, rules out that they are very close to the burst (within 0.2 pc) and being accelerated by the GRB ionizing flux to the observed velocities, as has been proposed elsewhere (Schaefer et al., 2003; Mirabal et al., 2003). The detected line-locking also favours radiative acceleration by the progenitor star.
4.2 A starburst host galaxy
An extremely blue host galaxy has been revealed in late time imaging (Fynbo et al., 2005; de Ugarte Postigo et al., 2005; Jakobsson et al., 2005). In order to derive the star-forming rate (SFR), we have studied the emission lines seen in the combined optical-nIR spectrum.
The emission line parameters are measured with a Gaussian fit to the emission line and a flat fit to the continuum. If all the H emission is attributed to star formation in the host galaxy we can compute the SFR as (M⊙yr-1) = (erg/s) (Kennicut et al., 1994). In our assumed cosmology, the measured H intensity transforms into a H luminosity erg s-1. This implies a SFR (without any corrections) of 40 7 M⊙yr-1, which is much larger than the present-day rate in our Galaxy. From the total measured Ly intensity (Castro-Tirado et al., 2002), we derive a Ly luminosity (9 1) 1042 erg s-1, which implies a SFR 10 M⊙yr-1 in agreement with Fynbo et al. (2005) and Jakobsson et al. (2005). The Ly/H ratio of 2 implies a low dust content in the GRB host galaxy, as also inferred by de Ugarte Postigo et al. (2005) and Kann et al. (2006) from the afterglow SED; there is also no excess absorption beyond the (low) Galactic value detected in Chandra X-ray observations (Sako & Harrison, 2002a). This is a large value for the SFR (see also Castro-Tirado et al. (2007)), although the signal-to-noise ratio of the nIR spectrum implies a large uncertainty. The derived SFR implies that most of the ongoing star formation is unobscured, which is also in agreement with the SCUBA results at 850 m (Tanvir et al., 2004).
The Ly photons produced in the ionized nebula suffer a continuous resonant scattering in the presence of HI. In a dust free nebula this mechanism effectively traps the Ly photons producing a typical P Cygni line profile in emission and absorption, depending on the details of the density and velocity field. However, if even a little dust is present, most Ly photons will disappear by heating dust grains, because radiation absorption by dust has a maximum cross section near the wavelength of Ly. Thus, the observed complex Ly profile is the result of both mechanisms, resonance scattering which sets the profile shape, and dust absorption which further decreases the intensity of the emission line. The Ly P Cygni profile can be understood in terms of these mechanisms acting during the evolution of the swept up HI supershell produced by a massive starburst in the host galaxy of GRB 021004. It corresponds to stage 4 in the evolutionary scheme developed by Tenorio-Tagle et al. (1999) and Más-Hesse et al. (2003); an stage compatible with GRB 021004 being the evolution endpoint of a WR star.
5 Conclusions
We find several absorption line groups spanning a range of about 3,000 km s-1 in velocity relative to the redshift of the host galaxy. The absorption profiles are very complex with both velocity-broadened components extending over several 100 km s-1 and narrow lines with velocity widths of only 20 km s-1. By analogy with QSO absorption line studies, the relative velocities, widths, and degrees of ionization of the lines (“line-locking”, “ionization–velocity correlation”) show that the progenitor had both an extremely strong radiation field and several distinct mass loss phases (winds). These results are consistent with GRB progenitors being massive stars, such as LBVs or Wolf–Rayet stars, and provide further insight into the nature of these progenitors and their immediate environments.
The host galaxy is a prolifically star-forming galaxy at a systemic redshift , with a SFR of 40 M⊙yr-1 as also found by Fynbo et al. (2005) and de Ugarte Postigo et al. (2005), reinforcing the potential association of some GRB with starburst galaxies (Christensen et al. (2004); Gorosabel et al. (2005) and references there in).
The Swift mission with a predicted lifetime of ten years (Gehrels et al., 2004) will certainly bring us the opportunity to carry out high-resolution spectroscopy for dozens of future GRBs, and to set physical/chemical properties common to all GRB outflows.
Acknowledgements.
We are grateful to M. Cerviño, M. Más-Hesse, R. González, G. Tenorio-Tagle and S. Vergani for fruitful discussions as well as the anonymous referee for the useful suggestions. This research has also been partially supported by the Spanish Ministry programmes AYA2004-01515, AYA 2007-06377, AYA 2009-14000-C03-01 and ESP2002-04124-C03-01 (including FEDER funds). The Dark Cosmology Centre is funded by the DNRFSome of the authors acknowledge benefits from collaboration within the EU FP5 Research Training Network “Gamma-Ray Bursts: An Enigma and a Tool”.References
- Barraud et al. (2002) Barraud, C., Olive, J.-F., Lestrade, J. P., et al. 2002, A&A, 400, 1021
- Berger et al. (2002) Berger, E., Frail, D. A., & Kulkarni, S. R. 2002, GCN Circ. 1613, http://gcn.gsfc.nasa.gov/gcn/gcn3/1613.gcn3
- Berger et al. (2006) Berger, E., Penprase, B. E., Cenko, S. B., Kulkarni, S. R., Fox, D. B., Steidel, C. C., & Reddy, N. A. 2006, ApJ, 642, 979
- Bersier et al. (2003) Bersier, D., Stanek, K. Z., Winn, J. N., et al. 2003, ApJ, 584, L43
- Björnsson et al. (2004) Björnsson, G., Gudmundsson, E. H., & Johánesson, G. 2004, ApJ, 615, L77
- Bloom et al. (2009) Bloom, J. S., Perley, D. A., Li, W., et al. 2009, ApJ, 691, 723
- Boronson et al. (1997) Boroson, B., McCray, R., Oelfke Clark, C., et al. 1997, ApJ, 478, 638
- Castor et al. (1975) Castor, J. I., Abbott, D. C., & Klein, R. I. 1975 ApJ, 195, 157
- Castro et al. (2003) Castro, S., Galama, T. J., Harrison, F. A., Holtzman, J. A., Bloom, J. S., Djorgovski, S. G. & Kulkarni, S. R., 2003 ApJ, 586, 128
- Castro-Tirado et al. (2002) Castro-Tirado, A. J., Pérez, E., Gorosabel, J., et al. 2002, GCN Circ. 1635, http://gcn.gsfc.nasa.gov/gcn/gcn3/1635.gcn3
- Castro-Tirado et al. (2007) Castro-Tirado, A. J., Bremer, M., McBreen, S. et al. 2007, A&A 475, 101
- Chen et al. (2007) Chen, H.-W., Prochaska, J. X., Ramirez-Ruiz, E., Bloom, J. S., Dessauges-Zavadsky, M., & Foley, R. J. 2007, ApJ, 663, 420
- Chornock & Filippenko (2002) Chornock, R., & Filippenko, A. 2002, GCN Circ. 1605, http://gcn.gsfc.nasa.gov/gcn/gcn3/1605.gcn3
- Christensen et al. (2004) Christensen, L., Hjorth, J., & Gorosabel, J., 2004, A&A, 425, 913
- de Koter et al. (1997) de Koter, A., Heap, S. R., & Hubeny, I. 1997, A&A, 477, 792
- de Ugarte Postigo et al. (2005) de Ugarte Postigo, A., Castro-Tirado, A. J., Gorosabel, J., et al. 2005, A&A, 443, 841
- de Ugarte Postigo et al. (2009) de Ugarte Postigo, A., D’Elia, V., Goldoni, P., et al. 2009, A&A, submitted (arXiv:0911.3901)
- D’Elia et al. (2009) D’Elia, V., Fiore, F., Perna, R., et al. 2009, ApJ, 694, 332
- Dessauges-Zavadsky et al. (2006) Dessauges-Zavadsky, M., Chen, H.-W., Prochaska, J. X., Bloom, J. S., & Barth, A. J. 2006, ApJ, 648, L89
- D’Odorico et al. (2006) D’Odorico, S., Dekker, H.,Mazzoleni, R., et al. 2006, in SPIE Conf. Series, Vol. 6269
- Fiore et al. (2005) Fiore, F., D´Elia, V., Lazzati, D., et al. 2005, ApJ, 624, 583
- Fox et al. (2003) Fox, D. W., Yost, S., Kulkarni, S. R., et al. 2003, Nature, 422, 284
- Fox et al. (2008) Fox, A. J., Ledoux, C., Vreeswijk, P. M., Smette, A., & Jaunsen, A. O. 2008, A&A, 491, 189
- Frail & Berger (2002) Frail, D. A., & Berger, E, 2002, GCN Circ. 1574, http://gcn.gsfc.nasa.gov/gcn/gcn3/1574.gcn3
- Fynbo et al. (2005) Fynbo, J. P. U., Gorosabel, J., Smette, A., et al. 2005, ApJ, 633, 317
- García Segura et al. (1996) García-Segura, G., Mac Low, M.-M., & Langer, N. 1996, A&A, 305, 229
- Gehrels et al. (2004) Gehrels, N., Chincarini, G., Giommi, P., et al. 2004, ApJ, 611, 1005
- Gorosabel et al. (2005) Gorosabel, J., Pérez-Ramírez, D., Sollerman, J., et al. 2005, A&A, 444, 711
- Gruendl et al. (2000) Gruendl, R. A., Chu, Y.-H., Dunne, B. C., & Points, S. D. 2000, AJ, 120, 2670
- Hjorth et al. (2003) Hjorth, J., Sollerman, P., Møller, P., et al. 2003, Nature, 423, 847
- Holland et al. (2003) Holland, S. T., Weidinger, M., Fynbo, J. P. U., et al. 2003, AJ, 125, 2291
- Humphreys and Davidson (1994) Humphreys, R. M., & Davidson, K. 1994, PASP, 106, 1025
- Jakobsson et al. (2005) Jakobsson, P., Björnsson, G., Fynbo, J. P. U., et al. 2005, MNRAS, 362, 245
- Jensen et al. (2001) Jensen, B. L., Fynbo, J. P. U., Gorosabel, J., et al. 2001, A&A, 370, 909
- Kann et al. (2006) Kann, D. A., Klose, S., & Zeh, A. 2006, ApJ, 641, 993
- Kann et al. (2007) Kann, D. A., Masetti, N., Klose, S. 2007, AJ, 133, 1187
- Kann et al. (2010) Kann, D. A., Klose, S., Zhang, B., et al. 2010, ApJ, submitted (arXiv:0712.2186v2)
- Kawabata et al. (2004) Kawabata, T., Matsumoto, K., Ayani, K., Kawai, N., Urata, Y, & Yamaoka, H. 2004, IBVS 5576
- Kennicut et al. (1994) Kennicutt, R. C., Tamblyn, P., & Congdon, C. E. 1994, ApJ, 435, 22
- Klose et al. (2004) Klose, S., Greiner, J., Rau, A., et al. 2004, AJ, 128, 1942
- Langer et al. (1994) Langer, N., Hamann, W.-R., Lennon, M., Najarro, F., Pauldrach, A. W. A., & Puls, J. 1994, A&A, 290, 819
- Langer et al. (1999) Langer, N., García-Segura, G., & Mac Low, M.-M. 1999, ApJ, 520, L49
- Lazzati et al. (2002) Lazzati, D., Rossi, E., Covino, S., Ghisellini, G., & Malesani, D. 2002, A&A, 396, L5
- Lazzati et al. (2006) Lazzati, D., Perna, R., Flasher, J., Dwarkadas, V. V., & Fiore, F. 2006, MNRAS, 372, 1791
- Maeder and Meynet (2000) Maeder, A., & Meynet, G. 2000, A&A, 361, 159
- Maeder (1983) Maeder, A. 1983, A&A,120, 113
- Más-Hesse et al. (2003) Más-Hesse, J. M., Kunth, D., Tenorio-Tagle, G., et al., Star Formation through Time, PASP Conference series, 297, 177, eds.: E. Pérez, R. González-Delgado & G. Tenorio-Tagle
- Matheson et al. (2003) Matheson, T., Garnavich, P. M., Foltz, C., et al. 2003, ApJ, 582, L5
- Metzger et al. (1997) Metzger, M. R., Djorgovski, S. G., Kulkarni, S. R., Steidel, C. C., Adelberger, K. L., Frail, D. A., Costa, E., & Frontera, F. 1997, Nature, 387, 878
- Mirabal et al. (2003) Mirabal, N., Halpern, J. P., Chornock, R., et al. 2003, ApJ, 595, 935
- Møller et al. (1994) Møller, P., Jakobsen P., & Perryman, M. A. C. 1994, A&A, 287, 719
- Møller et al. (2002a) Møller, P., Warren, S. J., Fall, S. M., Fynbo, J. P. U., & Jakobsen, P. 2002a, ApJ, 574, 51
- Møller et al. (2002b) Møller, P., Fynbo, J. P. U., Hjorth, J., et al. 2002b, A&A, 396, L21
- Osterbrock (1989) Osterbrock, D. E. 1989, Astrophysics of Gaseous Nebulae and Active Galactic Nuclei, University Science Books, Mill Valley
- Pandey et al. (2003) Pandey, S., Sahu, D. K., Resmi, L., et al. 2003, Bull. Astro. Soc. India 31, 19
- Pooley (2002a) Pooley, G. 2002a, GCN Circ. 1575, http://gcn.gsfc.nasa.gov/gcn/gcn3/1575.gcn3
- Pooley (2002b) Pooley, G. 2002b, GCN Circ. 1588, http://gcn.gsfc.nasa.gov/gcn/gcn3/1588.gcn3
- Prochaska et al. (2006) Prochaska, J. X., Chen, H.-W., & Bloom, J. S. 2006, ApJ, 648, 95
- Prochaska et al. (2008) Prochaska, J. X., Dessagues-Zavadsky, M., Ramirez-Ruiz, E., 2008, ApJ, 685, 344
- Salamanca et al. (2002) Salamanca, I., Rol, E., Wijers, R. A. M. J., Ellison, S., Kaper, L., & Tanvir, N., 2002, GCN Circ. 1611, http://gcn.gsfc.nasa.gov/gcn/gcn3/1611.gcn3
- Salvaterra et al. (2009) Salvaterra, R., Della Valle, M., Campana, S., et al. 2009, Nature, 461, 1258
- Sako & Harrison (2002a) Sako, M., & Harrison, F. A. 2002a, GCN Circ. 1624, http://gcn.gsfc.nasa.gov/gcn/gcn3/1624.gcn3
- Sako & Harrison (2002b) Sako, M., & Harrison, F. A. 2002b, GCN Circ. 1716, http://gcn.gsfc.nasa.gov/gcn/gcn3/1716.gcn3
- Sargent et al. (1998) Sargent, W. L. W., Boksenberg, A., & Steidel, C. C. 1988, ApJS, 68, 539
- Savaglio et al. (2002) Savaglio, S., Fiore, F., Israel, G., et al. 2002, GCN Circ. 1633, http://gcn.gsfc.nasa.gov/gcn/gcn3/1533.gcn3
- Schaefer et al. (2003) Schaefer, B. E., Gerardy, C. L., Höflich, P., et al. 2003, ApJ, 588, 387
- Shin et al. (2006) Shin, M.-S., Berger, E., Penprase, B. E., et al. 2006, ApJ, submitted (astro-ph/0608327)
- Shirasaki et al. (2002) Shirasaki, Y., Graziani, C., Matsuoka, M., et al. 2002, GCN Circ. 1565, http://gcn.gsfc.nasa.gov/gcn/gcn3/1565.gcn3
- Smith et al. (1984) Smith, L. J., Pettini, M., Dyson, J. E., & Hartquist, T. W. 1984, MNRAS211, 679
- Srianand et al. (2002) Srianand, R., Petitjean, P., Ledoux, C., & Hazard, C. 2002, MNRAS, 336, 753
- Stanek et al. (2003) Stanek, K., Matheson, T., Garnavich, P. M., et al. 2003, ApJ, 591, L17
- Starling et al. (2005) Starling, R. L. C., Wijers, R. A. M. J., Hughes, M. A., Tanvir, N. R., Vreeswijk, P. M., Rol, E., & Salamanca, I. 2005, MNRAS, 360, 305
- Tanvir et al. (2004) Tanvir, N. R., Barnard, V. E., Blain, A. W., et al. 2004, MNRAS, 352, 1073
- Tanvir et al. (2009) Tanvir, N. R., Fox, D. B., Levan, A. J., et al. 2009, Nature, 461, 1254
- Tejos et al. (2007) Tejos, N., Lopez, S., Prochaska, J. X., Chen, H.-W., & Dessauges-Zavadsky,M. 2007, ApJ, 671, 622
- Tejos et al. (2009) Tejos, N., Lopez, S., Prochaska, J. X., Bloom, J. S., Chen, H.-W., Dessauges-Zavadsky, M., & Maureira, M. J. 2009, ApJ, 706, 1309
- Tenorio-Tagle et al. (1999) Tenorio-Tagle, G., Silich, S. A., Kunth, D., Terlevich, E., & Terlevich, R. 1999, MNRAS, 309, 332
- Thöne et al. (2007) Thöne, C. C., Greiner, J., Savaglio, S., & Jehin, E. 2007, ApJ, 671, 628
- Uemura et al. (2003) Uemura, M., Kato, T., Ishioka, R., & Yamaoka. H. 2003, PASJ, 55, L31
- Vergani et al. (2009) Vergani, S., D., Petitjean, P., Ledoux, C., Vreeswijk, P., Smette, A., & Meurs, E. V. J. 2009, A&A, 503, 771
- Vreeswijk et al. (2007) Vreeswijk, P. M., Ledoux, C., Smette, A., et al. 2007, A&A, 468, 83
- Wang et al. (2003) Wang, L., Baade, D., Höflich, P., Wheeler, J. C. 2003, ApJ, submitted (astro-ph/0302166)
- Woosley & Bloom (2006) Woosley, S. E., Bloom, J. S. 2006, ARA&A, 44, 507
- Woosley (1993) Woosley, S. E. 1993, ApJ, 405, 273