Antimatter spectra from a time-dependent modeling of supernova remnants
Abstract
We calculate the energy spectra of cosmic rays (CR) and their secondaries produced in a supernova remnant (SNR), taking into account the time-dependence of the SNR shock. We model the trajectories of charged particles as a random walk with a prescribed diffusion coefficient, accelerating the particles at each shock crossing. Secondary production by CRs colliding with gas is included as a Monte Carlo process. We find that SNRs produce less antimatter than suggested previously: The positron/electron ratio and the antiproton/proton ratio are a few percent and few , respectively. Both ratios do not rise with energy.
pacs:
98.70.Sa, 95.30.CqIntroduction—Measurements of the antimatter fraction of cosmic rays (CR) provide not only insight into CR physics itself galprop , as e.g. their propagation in the galaxy, but are also valuable probes for cosmology and particle physics. In particular, the annihilation of dark matter (DM) leads to an equal injection rate of matter and antimatter particles into the Galaxy, while the CR flux from astrophysical sources is matter-dominated. A possible way to detect DM is therefore to estimate carefully the expected antimatter fluxes from astrophysical sources and to search then for any excess DM .
The PAMELA collaboration presented recently results of their measurement of the positron fraction in CRs, which is rising rapidly from 10 to 100 GeV PAMELA . At the same time, the antiproton ratio measured by PAMELA declines above 10 GeV Adriani:2008zq , consistent with expectations. The conventional estimate for antimatter fluxes from astrophysical sources uses as only production mechanism of antimatter the scattering of CRs on interstellar gas galprop . As discussed e.g. in Ref. Serpico:2008te , the energy dependence of the Galactic diffusion coefficient, with , is inconsistent with an increase of the antimatter fraction with energy. By contrast, the spectral shape of fragmentation functions leads quite naturally to such a rise in the case of DM annihilations.
The DM interpretation of the PAMELA excess faces however several difficulties DM : First, the required rate of positron production is larger than expected for a stable thermal relic. As a consequence, either the annihilation rate has to be enhanced, or the DM particle should be unstable with the appropriate life-time. Second, in gauge boson or quark fragmentation, positron, antiproton and photon production are tied together and thus one has to postulate a DM particle annihilating only into electrons and muons. More importantly, assuming antimatter production by diffusing CRs as the only astrophysical source for antimatter falls short: Since electrons lose fast energy, the high-energy part of the spectrum should be dominated by local sources as nearby pulsars, as pointed out already 20 years ago pulsar . Moreover, electromagnetic pair cascades in pulsars result naturally in a large positron fraction together with a “standard” antiproton flux.
More recently, supernova remnants (SNR) were put forward as an alternative astrophysical explanation for a rising positron fraction B09 : Positrons created as secondaries of hadronic interactions in the shock vicinity participate in the acceleration process and, according to Ref. B09 , should thus have a flatter energy spectrum than primary electrons. It was estimated that the resulting positron fraction can explain the PAMELA excess and rise up to 50% at higher energies B09 , while subsequently a similar mechanism for antiprotons was suggested in Ref. pp . Since shock acceleration in SNR is expected to be the main source for Galactic CRs SNR , such a scenario has also important consequences for the interpretations of CR data as, e.g., the boron-to-carbon ratio BC .
The present work examines the production of secondary and in SNRs, improving on previous studies B09 ; pp ; sarkar in two respects: First, we use a Monte Carlo (MC) approach calculating the trajectory of each particle individually in a random walk picture. This makes it easy to include interactions and the production of secondaries. Second, our approach allows us to include the time (and spatial) dependence of relevant parameters describing the evolution of a SNR as, e.g., the shock radius and its velocity, the magnetic field or the CR injection rate and to test their influence on the CR spectra. We should also stress what are not the aims of the present work: We do address neither the problem of acceleration from a microscopic point of view nor consider any feedback of CRs on the shock or the magnetic field. Although the latter processes are important to obtain accurate CR escape fluxes, we shall show that our simplified treatment leads to an upper limit on the secondary fluxes.
Simulation procedure—Shocks around SNRs are supposed to be collisionless, with charged particle scattering mainly on inhomogeneities of the turbulent magnetic field. We model such trajectories by a random walk in three dimensions with step size determined by an energy-dependent diffusion coefficient . Diffusion close to the shock is usually assumed to proceed in the Bohm regime with the mean free path proportional to the Larmor radius . Thus , where denotes the ratio of the energy density in the turbulent and in the total magnetic field. We neglect the coupling between CRs and the turbulent magnetic field, assuming that a layer with Bohm diffusion extends far enough into the up-stream region. For a constant magnetic field, CRs do not escape but are confined in the SNR, corresponding to an “age-limited” scenario for the CR flux from SNRs.
We describe the evolution of the shock in the rest frame of the SNR. Then the (yet unshocked) up-stream region is at rest, , and has the density of the surrounding interstellar medium (ISM), . Assuming a strong shock with Mach number , the shocked down-stream region flows with the velocity and has the density . Here, denotes the compression ratio for a mono-atomic gas with . We account for the flow, adding in the down-stream region on top of the random walk an ordered movement of the particle with velocity that is directed radially outwards. Thus a particle trajectory evolves during the time step as
| (1) |
where denotes a random step, the position of the shock, and the step function.
Crossing the shock front, particles are accelerated. We neglect that the relative energy gain per cycle depends on the angle of the trajectory to the shock front, and use for simplicity that on average for a non-relativistic shock . For the position and the velocity of the SNR shock we use the case of the analytical solutions derived in Ref. TM99 . These solutions connect smoothly the ejecta-dominated phase with free expansion and the Sedov-Taylor stage . The acceleration of CRs is assumed to cease after the transition to the radiative phase at the time .
As the injected particles diffuse, electrons lose energy via synchrotron radiation and inverse Compton scattering, while protons can scatter on gas of the ISM producing secondaries that include antiprotons and positrons. Cross sections and the final state of pp-interactions are simulated using QGSJET-II qgsjet , while we use SIBYLL 2.1 sibyll1.7 for decays of unstable particles.
The last ingredient for our simulation procedure is an injection model. To ease the comparison with the results of B09 , we fix the electron/proton ratio at injection to . As injection energy we use GeV. In the first model used, the injection rate
| (2) |
is proportional to the volume swept out per time by the shock, i.e. (thermal leakage model in1 ). In the second model, the injection rate is proportional to the CR pressure in2 and . In the case of model 2, the fraction of particles injected very early is significantly larger than in model 1.
We use the following parameters to describe the SNR: We choose the injected mass as , the mechanical explosion energy as erg, and the density of the ISM as cm-3. The end of the Sedov-Taylor phase follows then as yr TM99 . For the magnetic field we use G and to ease the comparison with the stationary approach of Refs. B09 ; pp ; sarkar .
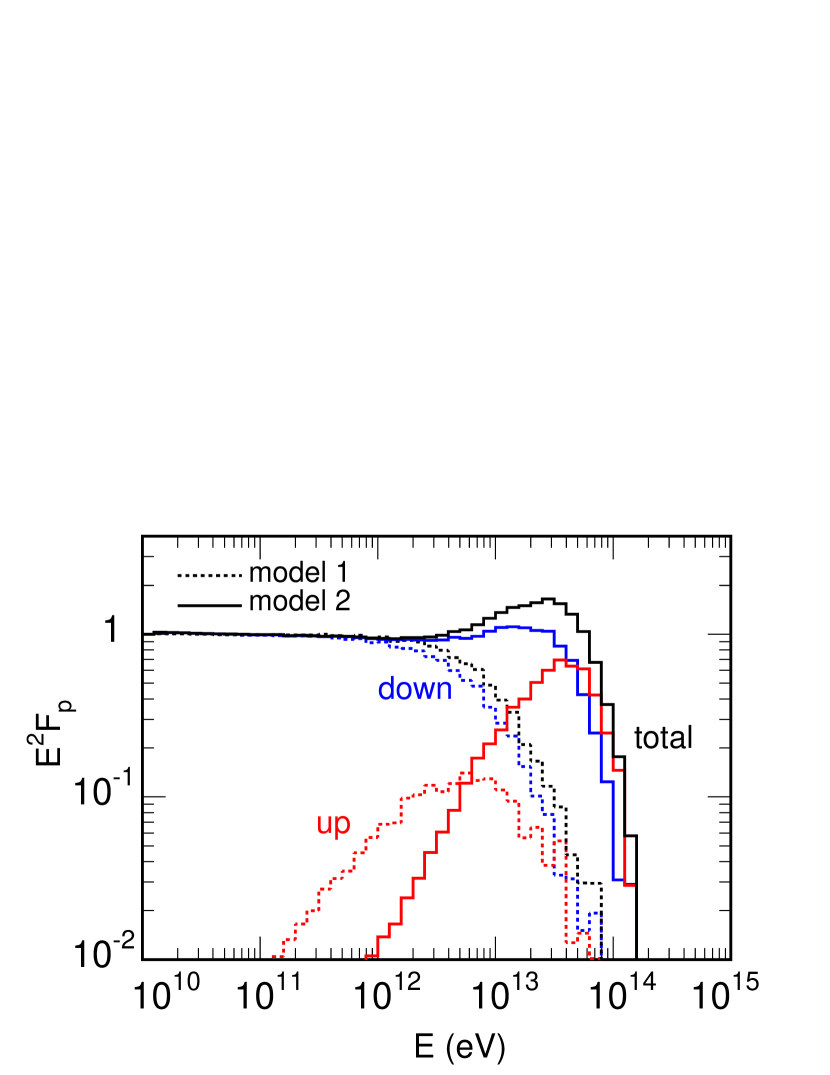
Numerical results—In Fig. 1, we show the energy dependence of the proton spectra in model 1 and 2. Additionally to the total spectra, the contribution of protons staying at in the up-stream region is shown in red, while the spectra of protons advected down-stream are shown in blue. The spectra of electrons are not shown, since they have the same shape as the proton spectra apart from a somewhat lower cutoff energy. While the total energy spectra at low energies agree well with a power-law, changing the injection model leads to large differences at high energies. The strong dependence of the spectra close to on the injection model is expected, since this part is sensitive to how many particles are injected early, when shock acceleration is most effective.
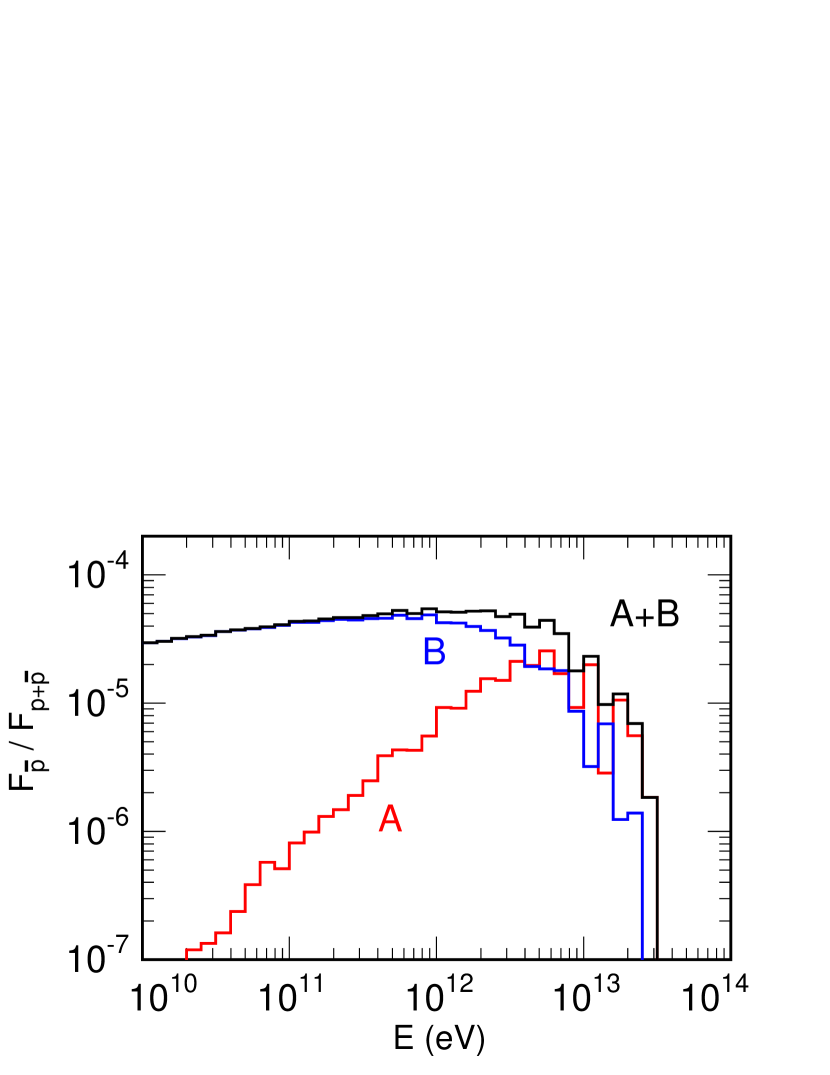
We switch now to the produced secondaries and show in Fig. 2 for injection model 2 and G the antiproton flux split into a part produced in the acceleration zone (A) and a part produced in the inner part of the SNR (B). More exactly, we define the contribution A as all secondaries that crossed at least once the shock. This contribution increases fast, since the time primary protons stay in the acceleration zone and can interact increases as . Hence for the relative rise of not the acceleration of secondaries but of primary protons is important. For example, the component A for neutral secondaries as e.g. photons, defined formally as all the particles produced up-stream, rises with energy in the same way as the one of antiprotons. Since the inelasticity, i.e. the energy fraction transferred to all antiprotons is practically constant in the relevant energy range, eV, its does not influence the shape of the antiproton flux 111Note also that, in contrast to the assumptions of Refs. B09 ; pp ; sarkar , the average energy fraction per single antiproton (or positron) decreases strongly with energy, since the multiplicity in pp interaction increases fast.. At eV, the increase of contribution A stops, the total flux retains its approximate slope and stays small in contrast to the result of Ref. pp .
How can we understand this behavior and the maximal value of ? We may assume in a gedankenexperiment that in each interaction the most energetic antiproton carries away all the energy, with . Then interactions just convert part of the into a flux. But since and diffuse and are accelerated in the same way, the total flux is not affected if the or the parent proton is accelerated. Hence the total flux of antiprotons produced in the acceleration zone and inside the SNR, i.e. the sum of A and B, should be simply the proton flux scaled down by a constant factor. In particular, the secondary flux of the species is bounded by the proton interaction depth and the (spectrally averaged) energy fraction transferred to . The maximal conversion rate during the life-time of a SNR is with mb as inelastic pp cross section at 100 GeV given by . The mean energy fraction of antiprotons (plus antineutrons) is , so we may expect a maximal ratio of . The obtained ratio shown in Fig. 2 is indeed close to this estimate.
The relative size of the partial contributions A and B can be understood considering the relation between the time spent by protons in A, their final energy and thus the interaction depth in A as function of energy, . In particular, it takes all the life-time of the SNR to accelerate protons to the highest energies, cf. the up-stream component in Fig. 1. For the component B, the optical depth of the parent proton is , which explains why the two components A and B sum up to a flat spectrum. Note that the relative normalization of component A and B in the stationary approach of Refs. B09 ; pp ; sarkar has to be imposed by hand, since B is formally infinite.
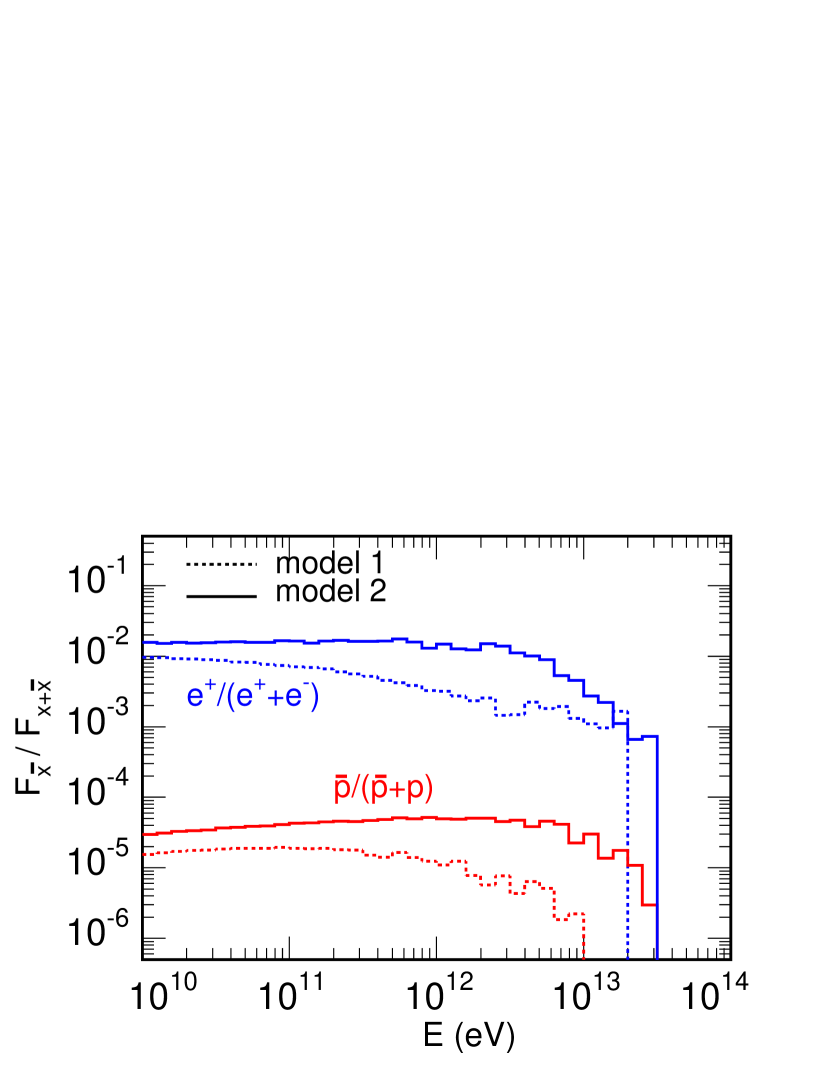
The same discussion applies to the case of positrons, with the sole exception that the primary electron flux is scaled down by the factor and that the energy fraction transferred to positrons is . The results of our simulation are shown in Fig. 3, confirming with the maximal value of this simple picture. Note that while above GeV the ratio from SNR starts to be larger than the conventional prediction using only secondary production on the ISM, it cannot explain the rise to at 10 GeV in the PAMELA data PAMELA .
Up to now, we have discussed only our numerical results for constant G and one may wonder if a “better” choice of parameters can increase the antimatter fluxes. In particular, the analytical formula of Ref. B09 ; pp ; sarkar seem to imply that the contribution A increases for weaker diffusion, i.e. larger . However, the term regulating the importance of A limits also via the maximal proton energy. Using a constant value as in Ref. B09 ; pp ; sarkar thus reduces by the same factor. In the stationary approach, however, is an external parameter and by increasing relative to its natural value given by one enlarges the relative contribution of A. This approach has been justified as a method to account in an effective way for amplification and damping of the magnetic field.
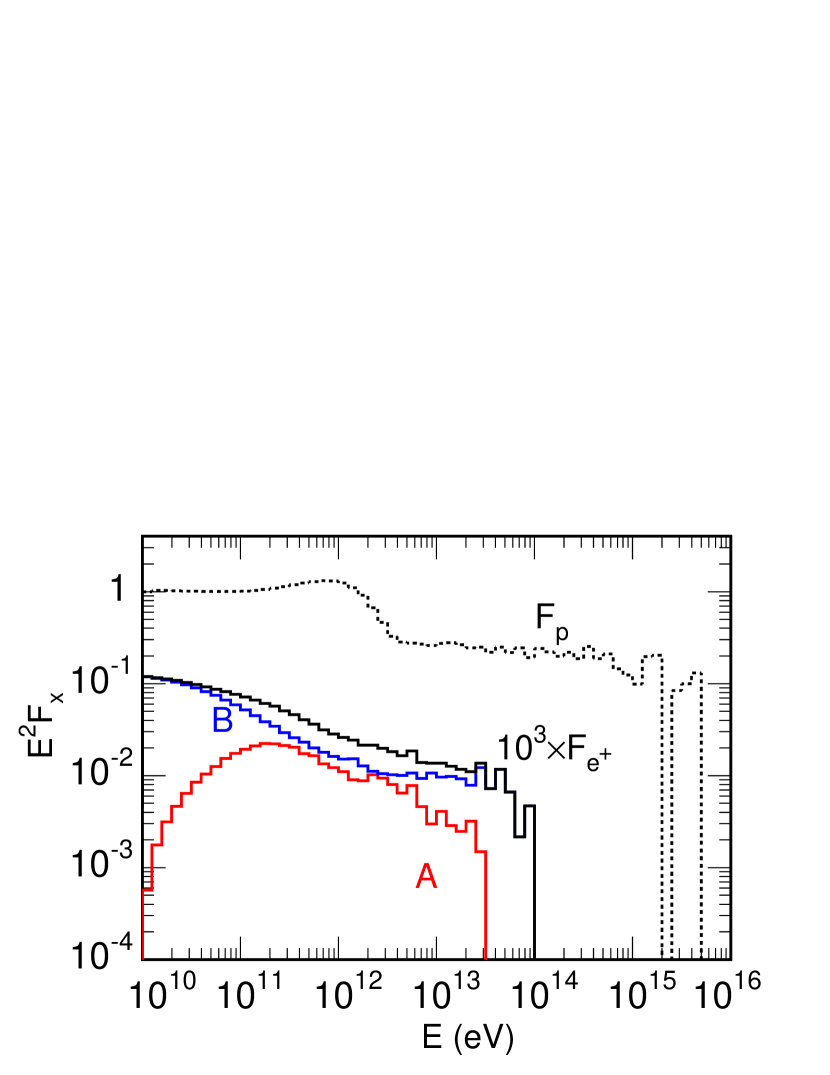
In our time-dependent approach, we test this suggestion considering a time-dependent magnetic field: assuming that non-linear effects amplify magnetic fields in the early phase B , with G before the transition to the Sedov-Taylor phase at yr, while in the late stage magnetic fields are damped, G at . In Fig. 4, we show for this case the proton and positron spectra using the injection model 2. Protons that were injected early are accelerated up to few eV, while the bulk of CRs injected when the tubulent magnetic field is damped has a cutoff around eV. The contribution A to the positron flux saturates at eV, i.e. at the energy expected for G. In contrast to Fig. 2, the component B dominates now the high-energy end of the positron flux: Most CRs escape from the acceleration zone during the transition and those advected downward contribute the new high-energy extension of component B, while those escaping up-stream contribute to A but are not longer accelerated.
Finally, we stress that the splitting between contribution A and B is artificial and depends as well as the total flux on the definition of the escape flux: If the diffusion coefficient drops above a certain energy and/or outside a sufficiently small radius to a value close to the one typical for the Galaxy, then CRs can escape up-stream instead of being confined down-stream. Clearly, this effect reduces the contribution B. On the other hand, the bounds and will become stronger, since also the time for interactions in the acceleration zone will be shortened. Since our maximal values of and depend only on , which is lower in escape-limited than in age-limited models, we conclude that the contribution of SNR to the observed antimatter in CRs does not lead to rising antimatter fractions and is smaller than estimated in earlier works.
Summary—We calculated the energy spectra of CRs and their secondaries produced in a supernova remnant using a simple random walk picture. In contrast to a previous prediction that the positron fraction can rise up to 40%–50% for , we found that the ratio levels off at a few percent. This value corresponds to the expectation combining the interaction depth of a proton during the life-time of a SNR with the energy fraction transferred to positrons. Similarly, the antiproton ratio does not rise beyond few. Our results suggest that antimatter production in SNRs cannot explain the rise of the positron fraction observed by PAMELA. Since a rising antiproton fraction is neither expected from CR interactions with the ISM nor from pulsars, such a measurement could be used as a signature for dark matter.
Acknowledgments—We thank Pasquale Blasi and Pasquale Serpico for critical comments. S.O. acknowledges a Marie Curie IEF fellowship. This work was partially supported by the Deutsche Forschungsgemeinschaft (SFB 676) and Norsk Forskningsradet (Romforskning).
References
- (1) A. W. Strong and I. V. Moskalenko, Adv. Space Res. 27, 717 (2001); N. Prantzos, arXiv:1003.2317 [astro-ph.GA].
- (2) L. Bergström, New J. Phys. 11, 105006 (2009).
- (3) O. Adriani et al.,Nature 458, 607 (2009).
- (4) O. Adriani et al.,Phys. Rev. Lett. 102, 051101 (2009).
- (5) P. D. Serpico, Phys. Rev. D 79, 021302 (2009).
- (6) A. K. Harding and R. Ramaty, Proc. 20th ICRC, Moscow, 2, 92 (1987); A. Boulares, Astrophys. J. 342, 807 (1989); F. A. Aharonian, A. M. Atoyan and H. J. Völk, Astron. Astrophys. 294, L41 (1995).
- (7) P. Blasi, Phys. Rev. Lett. 103, 051104 (2009).
- (8) P. Blasi and P. D. Serpico, Phys. Rev. Lett. 103, 081103 (2009).
- (9) S. P. Reynolds, Ann. Rev. Astr. Astrophys. 46, 89 (2008).
- (10) P. Mertsch and S. Sarkar, Phys. Rev. Lett. 103, 081104 (2009).
- (11) M. Ahlers, P. Mertsch and S. Sarkar, Phys. Rev. D 80, 123017 (2009).
- (12) J. K. Truelove and Ch. F. McKee, Astrophys. J. Suppl. 120, 299 (1994).
- (13) S. Ostapchenko, Nucl. Phys. Proc. Suppl. 151, 143 (2006); Phys. Rev. D 74, 014026 (2006).
- (14) R. Engel et al., Proc. 26th ICRC, Salt Lake City, 1, 415 (1999); E.-J. Ahn et al., Phys. Rev. D 80, 094003 (2009).
- (15) M. A. Malkov and H. J. Völk, A & A 300, 605 (1995).
- (16) V. S. Ptuskin and V. N. Zirakashvili, Astron. Astrophys. 429, 755 (2005).
- (17) A. R. Bell and S. G. Lucek, Mon. Not. R. Astron. Soc. 321, 433 (2001).