Evidence of different star formation histories for high- and low-luminosity radio galaxies
Abstract
We present the results of our investigation into the stellar populations of 24 radio galaxies at drawn from four complete, low-frequency selected radio surveys. We use the strength of the 4000 break as an indicator of recent star formation, and compare this with radio luminosity, optical spectral classification and morphological classification. We find evidence of different star formation histories for high- and low-luminosity radio sources; our group of low radio luminosity sources (typically FRI-type sources) has systematically older stellar populations than the higher radio luminosity group. Our sample is also fairly well divided by optical spectral classification. We find that galaxies classified as having low excitation spectra (LEGs) possess older stellar populations than high excitation line objects (HEGs), with the HEGs showing evidence for recent star formation. We also investigate the link between radio morphology, as used by Owen & Laing (1989), and the stellar populations. We find that there is a preference for the “fat-double” sources to have older stellar populations than the “classical double” sources, although this is also linked to these sources lying predominantly in the LEG and HEG categories respectively. These results are consistent with the hypothesis that HEGs are powered by accretion of cold gas, which could be supplied, for example, by recent mergers, secular instabilities, or filamentary cold flows. These processes could also trigger star formation in the host galaxy. The host galaxies of the LEGs do not show evidence for recent star formation and an influx of cold gas, and are consistent with being powered by the accretion of the hot phase of the inter-stellar medium.
keywords:
galaxies: active – galaxies: nuclei – galaxies: stellar content.1 Introduction
There is increasing evidence that active galactic nuclei (AGNs) have an important role to play in the formation and evolution of galaxies via AGN-driven feedback. Various relationships exist between the central black hole of an AGN and the stellar population of the galaxy: for example, the relation between black hole mass and stellar velocity dispersion (-) (Gebhardt et al. 2000; Ferrarese & Merritt 2000; Merritt & Ferrarese 2001; Gültekin et al. 2009) and the relation between black hole mass and bulge luminosity (e.g. McLure & Dunlop 2001; McLure & Dunlop 2002; Gültekin et al. 2009). The latter may also be expressed as the Magorrian relation between black hole mass and bulge stellar mass (Magorrian et al. 1998). These tight correlations provide compelling evidence for links between galaxy formation and evolution and the growth of black holes through AGN (accretion) activity. One suggested mechanism is that of quasar outflows limiting black hole masses, dependent on the depth of the potential wells of dark matter halos (Silk & Rees 1998).
The current models of galaxy formation and evolution also invoke AGN-driven feedback to halt the overproduction of stars in the most massive galaxies. For example, Croton et al. (2006) include AGN-driven feedback phenomena in their semi-analytic model, separated into “quasar-mode” (associated with the efficient accretion of cold gas) and “radio-mode” (associated with the less efficient accretion of warm gas) feedback. Sijacki et al. (2007) also include AGN-driven feedback in their full hydrodynamical model, once again separated into two modes: the “quasar regime” (corresponding to central black holes with high accretion rates) and mechanical feedback (corresponding to central black holes with low accretion rates). Studying the host galaxies of radio-loud AGN should therefore enable us to place important constraints on the validity of the feedback mechanisms in the models.
One method of investigating the cold- and hot-mode accretion in AGNs is with radio samples. Selecting AGNs on the basis of their low-frequency radio emission enables the selection of type-2, or obscured AGNs, in the same way as radio-loud quasars. This is because the radio waves are unaffected by dust obscuration, and the radio emission from the extended lobes is optically thin and therefore orientation independent. Furthermore, selecting the type-2 radio-loud quasars, or radio galaxies, allows the study of the stellar populations in the AGN host galaxy, as the central nuclear emission is obscured by the putative dusty torus invoked in unified schemes (e.g. Antonucci 1993; Hill, Goodrich & DePoy 1996). We also note that in the lower power AGNs this optical faintness may arise not merely from obscuration, but also from an inherent lack of bright optical-UV continua due to the absence of an accretion disc (e.g. Chiaberge, Capetti & Celotti 1999). The obscuration-related optical faintness in powerful AGN has enabled many authors to study the evolution of their host galaxies, with most work based on the near-infrared () Hubble diagram (Lilly & Longair 1982; Jarvis et al. 2001; Willott et al. 2003) and broad-band colours (e.g. Lilly 1989) suggesting that the hosts of powerful radio galaxies are comprised of an old stellar population which forms at high redshift () and then passively evolves.
Radio galaxies are commonly classified by their radio morphologies into Fanaroff-Riley type I (FRI) and Fanaroff-Riley type II (FRII) classes (Fanaroff & Riley 1974). An alternative division is that introduced by Hine & Longair (1979) based on optical spectra into high excitation galaxies (HEGs) and low excitation galaxies (LEGs); this was further refined by Laing et al. (1994) and Jackson & Rawlings (1997) who classified 3CR radio galaxies on this basis (see section 3.2).
There is increasing evidence that this emission line classification scheme, rather than the FR-class, has a direct link to the accretion mode of the AGN. Hardcastle, Evans & Croston (2007) showed that Bondi accretion of the hot phase of the intergalactic medium (IGM) is sufficient to power all low excitation radio sources, whereas the HEGs are powered by the accretion of cold gas typically thought to be driven towards the central engine during a galaxy merger. There are, however, other theories for the origin of the accreted cold gas in these galaxies. For example, in the hydrodynamical model of Ciotti & Ostriker (2007), gas from dying stars can be recycled by cooling radiatively and falling to the nuclear region where a small fraction ( or less) is accreted onto the central black hole. Alternatively, various authors (Kereš et al. 2005; Dekel & Birnboim 2006; Ocvirk, Pichon & Teyssier 2008; Dekel et al. 2009; Brooks et al. 2009; Kereš et al. 2009) have used hydrodynamic simulations to show that cold mode accretion via streams or filaments of cold gas could be responsible for the majority of the gas supplied to massive galaxies at high redshifts. For lower mass galaxies this cold mode accretion could be the dominant source of cold gas right up to the present day.
Following on from earlier work by Lilly & Longair (1984), Baldi & Capetti (2008) studied a sample of nearby 3CR radio galaxies and compared optical and UV images in order to detect evidence of recent star formation. They found evidence of recent star formation in the HEGs in their sample, but not in the LEGs. They suggest that the HEGs have undergone recent major mergers which both trigger star formation and power the AGN by providing a supply of cold gas for accretion. The LEGs in their picture, which supports the one put forward by Hardcastle et al. (2007), have experienced no such mergers. In this case no bursts of star formation are triggered and the AGN are powered by accretion of the hot interstellar medium (ISM).
In complementary work, Emonts et al. (2008) find no evidence for large-scale Hi structures in the host galaxies of FRI-type sources, but find that the host galaxies of most of the FRII-type sources in their sample contain significant amounts of Hi. They suggest that this dichotomy is a result of different formation histories for FRI and FRII-type radio sources. This is again consistent with the picture outlined above in which high- and low-luminosity radio galaxies have undergone different star formation histories and this also influences the mode of accretion on to the central supermassive black hole.
In recent work using the vast data set available from the Sloan Digital Sky Survey, Kauffmann, Heckman & Best (2008) study a sample of radio-loud AGNs with emission lines. They find a strong correlation between the presence of emission lines and the presence of a young stellar population, consistent with the findings of Baldi & Capetti (2008). They also find a correlation between the age of the stellar population and the radio luminosity normalised by the black hole mass. They note that strong optical AGNs have a significantly enhanced probability of hosting radio jets, and thus the radio and optical phenomena are not independent. However, although the SDSS is a wide-area survey, it does not probe the necessary volume to obtain a significant sample of the more luminous FRII-type or HEG populations. Therefore, in order to study these effects further, we need to use a complete sample of radio sources selected by other methods.
In this paper we present the results of our study into the star formation histories (SFHs) of 24 radio galaxies at . We compare our 4000 break indices with radio luminosity, spectral classification and morphological classification. We begin in section 2 of the paper by describing our sample, our observations and our data reduction. Section 3 describes our 4000 break strength measurements and our spectral and morphological classifications. We present our findings in section 4 before concluding in section 5. Throughout the paper we assume a standard cosmology in which = 70 km s-1, = 0.3 and = 0.7.
2 The Sample
Our full 41-object radio-galaxy sample (the ZP5 sample) consists of all of the radio galaxies without broad optical emission lines in the redshift interval from four complete, low-frequency selected radio surveys; 3CRR (Laing, Riley & Longair 1983), 6CE (Eales et al. 1997; Rawlings, Eales & Lacy 2001), 7CRS (Lacy et al. 1999; Willott et al. 2003) and TexOx-1000 (Hill & Rawlings 2003; Vardoulaki et al. 2009). The objects from this last survey probe towards the SDSS regime (Kauffmann et al. 2008), although SDSS galaxies still have a lower luminosity in the radio. Full details of the sample, along with the motivations for this choice of sample, can be found in McLure et al. (2004).
Using the 4.2-metre William Herschel Telescope (WHT) and the 8.1-metre Gemini North telescope we have obtained optical spectra for a subsample comprising 24 of the objects from the full ZP5 sample. Details of the subsample can be found in Table 1. Objects observed using the WHT were chosen to have so that satisfactory signal to noise ratios could be obtained without excessively long integration times. This constraint aside, the objects in our subsample were chosen at random from the objects in the full sample that were visible on the dates of observation. Details of the observations and data reduction can be found in Herbert et al. (in preparation).
| Source | RA | Dec | z | L151 | Telescope | Dn(4000) | Spec. Class | Morph. Class |
|---|---|---|---|---|---|---|---|---|
| 3C16 | 00 37 45.39 | +13 20 09.6 | 0.405 | 26.82 | WHT | HEG | CD/FD | |
| 3C19 | 00 40 55.01 | +33 10 07.3 | 0.482 | 26.96 | WHT | LEG | CD | |
| 3C46 | 01 35 28.47 | +37 54 05.7 | 0.437 | 26.84 | WHT | HEG | CD | |
| 3C172 | 07 02 08.32 | +25 13 53.9 | 0.519 | 27.17 | Gemini | HEG | CD | |
| 3C200 | 08 27 25.38 | +29 18 45.5 | 0.458 | 26.92 | Gemini | LEG | CD | |
| 3C244.1 | 10 33 33.97 | +58 14 35.8 | 0.428 | 27.10 | WHT | HEG | CD | |
| 3C295 | 14 11 20.65 | +52 12 09.0 | 0.464 | 27.68 | Gemini | HEG | CD | |
| 3C341 | 16 28 04.04 | +27 41 39.3 | 0.448 | 26.88 | WHT | HEG | CD | |
| 3C427.1 | 21 04 07.07 | +76 33 10.8 | 0.572 | 27.53 | Gemini | LEG | CD | |
| 3C457 | 23 12 07.57 | +18 45 41.4 | 0.428 | 27.00 | WHT | HEG | CD | |
| 6C0825+3407 | 08 25 14.59 | +34 07 16.8 | 0.406 | 26.09 | WHT | LEG | FD | |
| 6C0850+3747 | 08 50 24.77 | +37 47 09.1 | 0.407 | 26.15 | WHT | HEG | CD | |
| 6C0857+3945 | 08 57 43.56 | +39 45 29.0 | 0.528 | 26.34 | Gemini | HEG | CD | |
| 6C1303+3756 | 13 03 44.26 | +37 56 15.2 | 0.470 | 26.29 | Gemini | HEG | CD | |
| 7C0213+3418 | 02 13 28.39 | +34 18 30.6 | 0.465 | 25.66 | WHT | LEG | FD | |
| 7C0219+3423 | 02 19 37.83 | +34 23 11.2 | 0.595 | 25.98 | Gemini | HEG | FD | |
| 7C0810+2650 | 08 10 26.10 | +26 50 49.1 | 0.435 | 25.58 | WHT | HEG | CD | |
| 7C1731+6638 | 17 31 43.84 | +66 38 56.7 | 0.562 | 25.52 | Gemini | HEG | FD | |
| 7C1806+6831 | 18 06 50.16 | +68 31 41.9 | 0.580 | 26.36 | Gemini | HEG | FD | |
| TOOT0009+3523 | 00 09 46.90 | +35 23 45.1 | 0.439 | 24.79 | WHT | LEG | FD | |
| TOOT0018+3510 | 00 18 53.93 | +35 10 12.1 | 0.416 | 25.16 | WHT | LEG | J? | |
| TOOT1626+4523 | 16 26 48.50 | +45 23 42.6 | 0.458 | 25.03 | WHT | LEG | FD | |
| TOOT1630+4534 | 16 30 32.80 | +45 34 26.0 | 0.493 | 25.17 | WHT | LEG | J | |
| TOOT1648+5040 | 16 48 26.19 | +50 40 58.0 | 0.420 | 25.12 | WHT | LEG | - |
3 Analysis
3.1 4000Å Break Strength
The strength of the 4000 break can be used as a measure of recent star formation, as outlined by Kauffmann et al. (2003). Younger stellar populations contain hotter stars which have multiply ionized elements. This leads to a decrease in opacity and consequently a smaller 4000 break. Conversely, the 4000 break is larger for older populations.
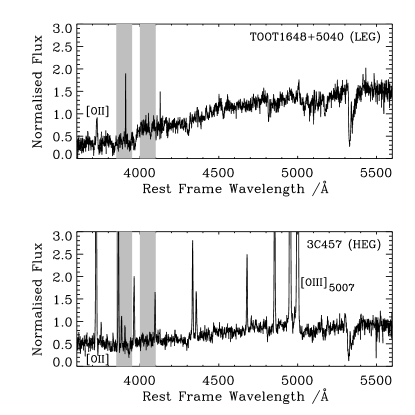
In order to measure the strength of the 4000 break we adopt the band definitions of Balogh et al. (1999) as used by Kauffmann et al. (2003); the break strength [Dn(4000)] is calculated as the mean flux in the 4000-4100 band divided by the mean flux in the 3850-3950 band (see Figure 1). We calculate Dn(4000) for each object directly from our spectra, masking out regions affected by emission lines from the central radio source.
Our calculated Dn(4000) indices can be found in Table 1. Our Dn(4000) indices lie in the range 1.17-1.90. From figure 6 of Kauffmann et al. (2003) we note that the galaxies at the upper end of this range correspond to old galaxies with no recent star formation. Those galaxies at the lower end of the range are consistent with galaxies where a small fraction of the stellar mass has been formed 0.1-2 Gyr ago.
The Dn(4000) index can be contaminated by dust and/or scattered quasar light. There are thus potential limitations in using Dn(4000) in isolation as an indicator of star formation histories. An additional indicator is the H index (see Worthey & Ottaviani 1997; Kauffmann et al. 2003). However, we are unable to measure H for our galaxies due to the presence of emission lines from the AGN. We therefore use Dn(4000) by itself, noting that there is no evidence for dust in any of our objects, i.e. they are all adequately fit by simple stellar populations without dust obscuration (Herbert et al. in preparation) and include the Ca H+K lines giving us confidence that the contribution to the blue light is stellar in origin. In Section 4 we also show that the Dn(4000) indices are unlikely to be affected by scattered quasar light.
3.2 Spectral and Morphological Classifications
We classify our radio galaxies as high-excitation (HEGs) or low-excitation (LEGs) according to the classification scheme of Jackson & Rawlings (1997). An object is classified as a LEG if it has an [OIII] rest frame equivalent width or an [OII]/[OIII] ratio (or both). Our classifications can be found in Table 1 111For objects where our wavelength range does not extend to the [OIII] emission line we use data from http://www.science.uottawa.ca/cwillott/3crr/3crr.html. Figure 1 illustrates the difference in the spectra between high-excitation and low-excitation objects.
To morphologically classify the radio source we adopt the classification scheme of Owen & Laing (1989) and classify our sources as Classical Doubles (CD), Jetted sources (J) or Fat Doubles (FD). In terms of their Fanaroff-Riley classification (Fanaroff & Riley 1974), Classical Doubles are always identified with FRII-type sources whilst Fat Doubles are identified as FRII or FRI/II radio galaxies and Jetted sources are generally identified with FRI-type sources. Our classifications can be found in Table 1 and full details can be found in Mitchell (2006).
4 Discussion
4.1 Dn(4000) versus Radio Luminosity
In Figure 2 we show Dn(4000) versus the low-frequency radio luminosity at 151 MHz, L151, for our galaxies, with symbols corresponding to their spectral classification. Motivated by figure 6 of Kauffmann et al. (2003), we include a dashed line at Dn(4000) = 1.6 in order to illustrate differences in star formation. Objects with Dn(4000) 1.6 may have formed a noticeable fraction (5% or greater) of their stellar mass in recent star bursts in the models of Kauffmann et al. (2003). On the other hand, objects with Dn(4000) 1.6 show little or no evidence for recent star formation. This division at Dn(4000) = 1.6 therefore represents a conservative division between objects which may have evidence of recent star formation, and those which do not. We reiterate that since we are unable to measure H for our objects we are unable to be more specific as regards the star formation histories of our galaxies.
Mindful of this note of caution, it is still readily apparent that the galaxies form two distinct populations. One population, with lower radio luminosities (L W Hz-1 sr-1), is composed exclusively of LEGs. The galaxies in this population have systematically higher Dn(4000) indices and thus older stellar populations. The second population, at higher radio luminosities (L W Hz-1 sr-1) and smaller Dn(4000) indices (younger stellar populations), consists mainly of HEGs, although a few LEGs are also present in this population. 6C0825+3407 and 7C0213+3418 could belong to either population (as discussed in Section 4.2). We illustrate the division between the two populations by the vertical dashed line in Figure 2. The traditional division between FRI type and FRII type radio galaxies falls at L W Hz-1 sr-1 and motivates our population division at this value. This is also the radio luminosity at which there is an apparent divergence in the evolution with redshift, the higher luminosity radio sources tending to evolve more strongly than the lower luminosity sources (Clewley & Jarvis 2004; Sadler et al. 2007). Performing a two sided K-S test on the Dn(4000) indices for the two populations enables us to reject at a significance of 99.96% that the two populations are drawn from the same distribution. We also perform a Mann-Whitney-Wilcoxon (MWW) test on the two populations and reject at a significance of the null hypothesis that they are drawn from the same distribution. We thus find evidence for different star formation histories for high- and low- luminosity radio galaxies. The transition occurs around L W Hz-1 sr-1, although it is not possible to make a clean divison at a single value of L151.

4.2 Dn(4000) versus Emission-line Classification
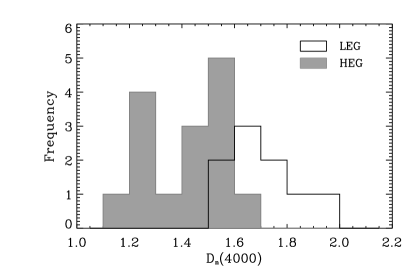
We also split our objects according to their optical classification (i.e. LEGs and HEGs) and perform another two sided K-S test on the Dn(4000) indices. In this case we reject the null hypothesis that the indices are drawn from the same distribution at a significance of 99.4%. An MWW test in this case rejects the null hypothesis at a significance of 99.8%. The difference in Dn(4000) between a LEG and a HEG is illustrated in Figure 1 and Figure 3 shows clearly that our HEGs and LEGs are divided into two separate populations on the basis of their Dn(4000) indices. We thus find evidence in support of the work of Kauffmann et al. (2008) and Baldi & Capetti (2008). The latter authors find evidence of recent star formation in HEGs but not in LEGs. They suggest that HEGs have undergone a recent major merger that triggered star formation and also provided the fuel to power the AGN via cold gas accretion. In their picture, LEGs on the other hand have had no such recent merger, and thus are fuelled by the hot ISM and show no evidence of recent star formation. However, whilst mergers seem a likely explanation of the origin of the influx of cold gas in HEGs, we note that there are alternative explanations of this influx, as discussed in Section 1. We also note that our population that shows evidence of more recent star formation contains three (or possibly four) LEGs. Thus a spectral line classification system may not be a clean method to study the history of the influx of cold gas into AGN hosts – rather the star formation history measured by studying the host galaxies may offer a better indication of the past influx of cold gas by mergers or other processes.
However, it is possible that even when the principal accretion mechanism is through the hot-mode, minor mergers and interactions could stimulate some star-formation activity which would result in smaller Dn(4000) values. Furthermore, the timescale on which a merger influences the AGN fuelling could be different from the timescale on which it triggers star formation which would also cause mixing of the populations. It is also interesting to note that the LEGs still have amongst the oldest stellar populations in the higher radio luminosity population. We also observe that some of the LEGs belonging to the higher radio luminosity population possess HEG-like features. 3C19 (labelled in Figure 2) would be classed as a HEG on the basis of its [OIII] rest frame equivalent width, but is classified as a LEG due to its [OII]/[OIII] ratio. Conversely 7C0213+3418 (also labelled in Figure 2) would be a HEG on the basis of its [OII]/[OIII] ratio, but is classified as a LEG because of its [OIII] rest frame equivalent width.
An important question is whether the dichotomy observed in Dn(4000) is primarily related to the radio luminosity (Section 4.1) or to the excitation state (this section). Given our current data we are unable to provide a conclusive answer to this question. However, given that the excitation state appears to be a better indicator of the accretion rate than the radio luminosity (Hardcastle et al. 2007), and thus is more closely linked to the state of the gas, we suggest that it is the excitation state, rather than the radio emission, which is primarily related to the strength of the 4000Å break (and thus the star formation history of the galaxy).

In Figure 4 we again show Dn(4000) versus L151, this time with symbols corresponding to the radio morphology of the galaxy. We find that our lower radio luminosity population is composed mainly of Fat Doubles and our higher radio luminosity population contains predominantly Classical Doubles. However, there is a great deal of mixing of the radio morphology types, and we find no clear difference between the two populations on the basis of radio morphology alone due to the strong relation between radio morphology classification and the high- and low-excitation populations (Hine & Longair 1979).
4.3 Contamination by Scattered Quasar Light?
Scattered quasar light has, in the past, been posited as an explanation for the alignment effect in radio galaxies (e.g. Tadhunter et al. 1992, Cimatti et al. 1993) and could possibly lead to uncertainties in the inferred properties of quasar host galaxies (e.g. Young et al. 2009). In this paper we use the strength of the 4000 break as an indicator of recent star formation. Care must therefore be taken to consider whether the dilution in the 4000 break arises as a result of a young stellar population or from other sources. Lilly & Longair (1984) and Lilly, Longair & Allington-Smith (1985) used the 3CR and ‘1-Jansky’ samples of radio galaxies to establish the trend for bluer galaxies to have stronger [OII]3727 line emission (from the AGN). More recent work (e.g. Tadhunter, Dickson & Shaw 1996; Aretxaga et al. 2001; Tadhunter et al. 2002; Holt et al. 2007) has emphasized the contribution of both young stellar populations and AGN-related components (e.g. nebular continuum, scattered and direct quasar light, emission lines) to the optical and UV continua in powerful radio galaxies.
As found by Lilly et al. (1985), we would expect the contamination by scattered quasar light to be highly correlated with the ionizing power of the central engine and thus the emission-line luminosity, assuming emission-line luminosity is a good proxy for ionizing power (see e.g. Rawlings & Saunders 1991). However, we find no evidence for a correlation between the [OII] luminosity and Dn(4000) with a Spearman Rank test giving only a 25 per cent probability that the relation deviates from the null hypothesis of no correlation.
Furthermore, for scattered quasar light to have a large effect on our results would require a very strong dependence on wavelength, i.e. over the range where we calculate Dn(4000). Using the most pronounced examples of scattered quasar light in the literature, i.e. in broad-line radio galaxies (see e.g. Tran et al. 1998) we find, by using the total polarized emission spectrum from these sources, that the spectrum of the scattered light gives a value of Dn(4000). Assuming that at 3900 up to 10 per cent of the total emission in our radio galaxies could be contributed by the scattered nuclear emission (e.g. figure 3 of Tran et al. 1998) we calculate that this would reduce our Dn(4000) by a maximum value of 0.1. Given that none of our radio galaxy spectra show any evidence for any scattered contribution, have pronounced absorption-line spectra and are all well fit by a simple stellar population, along with the lack of a correlation between [OII] emission-line luminosity and Dn(4000), we are confident that the dichotomy in Dn(4000) between the HEGs and LEGs is due to different star-formation histories rather than scattered quasar light.
5 Conclusions
In this paper we have used deep spectroscopic observations to determine how the age of the stellar populations in the host galaxies of powerful radio sources is related to the structure of the radio emission and the ionizing power of the AGN.
-
•
We have shown that our sample of radio galaxies forms two distinct populations in the Dn(4000) - L151 plane. The population at lower radio luminosity is composed entirely of LEGs, the one at higher radio luminosity predominantly of HEGs (although a few LEGs fall within this population).
-
•
Our lower radio luminosity population has systematically higher Dn(4000) indices than the higher radio luminosity population. We find that this is most likely due to the presence of a younger stellar population in the higher radio luminosity (or HEG) population after considering the possibility that scattered quasar light may significantly alter the Dn(4000). We find that scattered quasar light could only decrease Dn(4000) by a maximum value of 0.1, which is not sufficient to explain the dichotomy that we observe. However, we are unable to measure the H for our objects, which does leave some uncertainty in determining the actual extent of the star formation in our galaxies.
-
•
We find that there is a preference for “fat-double” sources to have older stellar populations than the “classical double” sources. However, this may simply reflect the underlying links between morphology and excitation state or radio morphology, which appear to be more strongly correlated with Dn(4000) than is the morphology.
-
•
Our results are consistent with the hypothesis that HEGs are powered by the accretion of cold gas, the influx of which could be due to mergers – which would also trigger star formation – or other processes, such as cooled, recycled gas from dying stars or cold mode accretion. On the other hand, we suggest that LEGs are powered by the accretion of the hot phase of the inter-stellar medium (as they have undergone no recent influx of cold gas).
The results presented here show that deep optical spectroscopy can provide important information on the host galaxy properties of moderate redshift, powerful radio galaxies. However, this also needs to be linked to other indicators of star formation and merger activity to obtain a comprehensive and consistent explanation for the observed differences between AGN and their corresponding effect on the evolution of massive galaxies.
In future work (Herbert et al. in preparation) we will use this sample to investigate where these radio sources fall on the Fundamental Plane and how they relate to the general massive galaxy population. Furthermore, we also have deep multi-band imaging data to assess the environmental richness of the full sample which will enable us to link how the power of the AGN, its host galaxy mass and star formation history are related to the environmental density of the AGN.
ACKNOWLEDGEMENTS
We thank Martin Hardcastle for useful discussions and the anonymous referee for careful reading and for suggestions which have improved the manuscript. PDH thanks the UK STFC for a studentship. MJJ ackowledges the support of an RCUK fellowship. RJM and JSD acknowledge the support of the Royal Society through a University Research Fellowship and a Wolfson Research Merit award respectively. The William Herschel Telescope is operated on the island of La Palma by the Isaac Newton Group in the Spanish Observatorio del Roque de los Muchachos of the Instituto de Astrofisica de Canarias. Based on observations obtained at the Gemini Observatory (programs GN-2008B-Q-103 & GN-2009A-Q-105), which is operated by the Association of Universities for Research in Astronomy, Inc., under a cooperative agreement with the NSF on behalf of the Gemini partnership: the National Science Foundation (United States), the Science and Technology Facilities Council (United Kingdom), the National Research Council (Canada), CONICYT (Chile), the Australian Research Council (Australia), Ministério da Ciência e Tecnologia (Brazil) and Ministerio de Ciencia, Tecnología e Innovación Productiva (Argentina).
References
- [1] Antonucci R., 1993, ARA&A, 31, 473
- [2] Aretxaga I., Terlevich E., Terlevich R. J., Cotter G., Díaz Á. I., 2001, MNRAS, 325, 636
- [3] Baldi R. D., Capetti A., 2008, A&A, 489, 989
- [4] Balogh M. L., Morris S. L., Yee H. K. C., Carlberg R. G., Ellingson E., 1999, ApJ, 527, 54
- [5] Brooks A. M., Governato F., Quinn T., Brook C. B., Wadsley J., 2009, ApJ, 694, 396
- [6] Chiaberge M., Capetti A., Celotti A., 1999, A&A, 349, 77
- [7] Cimatti A., di Serego-Alighieri S., Fosbury R. A. E., Salvati M., Taylor D., 1993, MNRAS, 264, 421
- [8] Ciotti L., Ostriker J. P., 2007, ApJ, 665, 1038
- [9] Clewley L., Jarvis M. J., 2004, MNRAS, 352, 909
- [10] Croton D. J., Springel V., White S. D. M. et al., 2006, MNRAS, 365, 11
- [11] Dekel A., Birnboim Y., 2006, MNRAS, 368, 2
- [12] Dekel A., Birnboim Y., Engel G. et al., 2009, Nature, 457, 451
- [13] Eales S., Rawlings S., Law-Green D., Cotter G., Lacy M., 1997, MNRAS, 291, 593
- [14] Emonts B., Morganti R., Oosterloo T., van Gorkom J., 2008, in Beswick R. J., Diamond P. J., Schilizzi R., eds, Proc. Sci., The Modern Radio Universe: From Planets to Dark Energy (arXiv:0801.4769)
- [15] Fanaroff B. L., Riley J. M., 1974, MNRAS, 167, 31P
- [16] Ferrarese L., Merritt D., 2000, ApJ, 539, L9
- [17] Gebhardt K., Bender R., Bower G. et al., 2000, ApJ, 539, L13
- [18] Gültekin K., Richstone D. O., Gebhardt K. et al., 2009, ApJ, 698, 198
- [19] Hardcastle M. J., Evans D. A., Croston J. H., 2007, MNRAS, 376, 1849
- [20] Hill G. J., Rawlings S., 2003, NewAR, 47, 373
- [21] Hill G. J., Goodrich R. W., DePoy D. L., 1996, ApJ, 462, 163
- [22] Hine R. G., Longair M. S., 1979, MNRAS, 188, 111
- [23] Holt J., Tadhunter C. N., González Delgado R. M., Inskip K. J., Rodriguez J., Emonts B. H. C., Morganti R., Wills K. A., 2007, MNRAS, 381, 611
- [24] Jackson N., Rawlings S., 1997, MNRAS 286, 241
- [25] Jarvis M. J., Rawlings S., Eales S., Blundell K. M., Bunker A. J., Croft S., McLure R. J., Willott C. J., 2001, MNRAS, 326, 1585
- [26] Kauffmann G., Heckman T. M., White S. D. M. et al., 2003, MNRAS, 341, 33
- [27] Kauffmann G., Heckman T. M., Best P. N., 2008, MNRAS, 384, 953
- [28] Kereš D., Katz N., Weinberg D. H., Davé R., 2005, MNRAS, 363, 2
- [29] Kereš D., Katz N., Fardal M., Davé R., Weinberg D. H., 2009, MNRAS, 395, 160
- [30] Lacy M., Rawlings S., Hill G. J., Bunker A. J., Ridgway S. E., Stern D., 1999, MNRAS, 308, 1096
- [31] Laing R. A., Riley J. M., Longair M. S., 1983, MNRAS, 204, 151
- [32] Laing R. A., Jenkins C. R., Wall J. V., Unger S. W., 1994, in Bicknell G. V., Dopita M. A., Quinn P.J., eds, The Physics of Active Galaxies, 54, 201
- [33] Lilly S. J., 1989, ApJ, 340, 77
- [34] Lilly S. J., Longair M. S., 1982, MNRAS, 199, 1053
- [35] Lilly S. J., Longair M. S., 1984, MNRAS, 211, 833
- [36] Lilly S. J., Longair M. S., Allington-Smith J. R., 1985, MNRAS, 215, 37
- [37] Magorrian J., Tremaine S., Richstone D. et al., 1998, AJ, 115, 2285
- [38] McLure R. J., Dunlop J. S., 2001, MNRAS, 327, 199
- [39] McLure R. J., Dunlop J. S., 2002, MNRAS, 331, 795
- [40] McLure R. J., Willott C. J., Jarvis M. J., Rawlings S., Hill G. J., Mitchell E., Dunlop J. S., Wold M., 2004, MNRAS, 351, 347
- [41] Merritt D., Ferrarese L., 2001, ApJ, 547, 140
- [42] Mitchell E. K., 2006, PhD thesis, University of Oxford
- [43] Ocvirk P., Pichon C., Teyssier R., 2008, MNRAS, 390, 1326
- [44] Owen F. N., Laing R. A., 1989, MNRAS, 238, 357
- [45] Rawlings S., Saunders R., 1991, Nature, 349, 138
- [46] Rawlings S., Eales S., Lacy M., 2001, MNRAS, 322, 523
- [47] Sadler E. M. et al., 2007, MNRAS, 381, 211
- [48] Sijacki D., Springel V., Di Matteo T., Hernquist L., 2007, MNRAS, 380, 877
- [49] Silk J., Rees M. J., 1998, A&A, 331, L1
- [50] Tadhunter C. N., Scarrott S. M., Draper P., Rolph C., 1992, MNRAS, 256, 53P
- [51] Tadhunter C. N., Dickson R. C., Shaw M. A., 1996, MNRAS, 281, 591
- [52] Tadhunter C., Dickson R., Morganti R., Robinson T. G., Wills K., Villar-Martin M., Hughes M., 2002, MNRAS, 330, 977
- [53] Tran H. D., Cohen M. H., Ogle P. M., Goodrich R. W., di Serego Alighieri S., 1998, ApJ, 500, 660
- [54] Vardoulaki E., Rawlings S., Hill G. J. et al., 2009, preprint (astro-ph/0909.5691)
- [55] Willott C. J., Rawlings S., Jarvis M. J., Blundell K. M., 2003, MNRAS, 339, 173
- [56] Worthey G., Ottaviani D. L., 1997, ApJS, 111, 377
- [57] Young S., Axon D. J., Robinson A., Capetti A., 2009, ApJL, 698, L121