Indium-Gallium Segregation in CuInxGa1-xSe2: An ab initio based Monte Carlo Study
Abstract
Thin-film solar cells with CuInxGa1-xSe2 (CIGS) absorber are still far below their efficiency limit, although lab cells reach already 19.9%. One important aspect is the homogeneity of the alloy. Large-scale simulations combining Monte Carlo and density functional calculations show that two phases coexist in thermal equilibrium below room temperature. Only at higher temperatures, CIGS becomes more and more a homogeneous alloy. A larger degree of inhomogeneity for Ga-rich CIGS persists over a wide temperature range, which may contribute to the low observed efficiency of Ga-rich CIGS solar cells.
pacs:
As resources of fossil fuels are dwindling alternative sources of energy gain increasing importance. The contribution of solar cells is continuously growing and a lot of effort has been made to improve the efficiency. During the past years chalcopyrites like CuInxGa1-xSe2 (CIGS) have been shown to be promising absorber materials for thin-film solar cells with high efficiency and low production cost. Several crucial aspects of their operation have, however, not been completely understood yet. One question that is still unanswered is the influence of the In-Ga ratio on the cell efficiency. Pure CuInSe2 has a band gap of 1.0 eV and CuGaSe2 of 1.7 eV. Aiming at an optimal band gap for the absorption of the solar spectrum, an alloy with about 70% Ga should yield the highest efficiency. Huang (2008)Su-Huai Wei and Zunger (1998). Experimentally, however, the best efficiencies have been reached with a much lower Ga content of only 30% Green et al. (2005). An explanation of this effect might lie in the inhomogeneity of the experimental samples. Knowledge on the impact of granularity on solar cell performance is still fragmentary, but inhomogeneities lead to band gap fluctuations, which most certainly have a detrimental effect on the cell efficiency Werner et al. (2005)Gütay and Bauer (2007). Several groups investigate experimentally the inhomogeneities in the In-Ga distribution for a fixed In-Ga ratio Gütay and Bauer (2009)Gütay et al. (2009)Yan et al. (2005) or for varying In-Ga ratios Gütay and Bauer (2007)Rega et al. (2005). Photoluminescence measurements by Gütay and Bauer indicate that a higher Ga content leads to larger inhomogeneities Gütay and Bauer (2007). Even small fluctuations in the composition may unfavorably affect the electronic and optical properties Werner et al. (2005). This might be an important factor that diminishes the efficiency of solar cells with high Ga content.
In this letter we present a computer simulation study of the spatial distribution of In and Ga in CIGS. To make the calculations feasible we keep Cu and Se fixed at their respective lattice sites and neglect other defects. It is common to tackle properties of semiconductors computationally by using density functional theory (DFT) for calculating their electronic structure. Up to now DFT-based calculations of CIGS compounds have only been carried out for small numbers of atoms and for the pure compounds CuInSe2 and CuGaSe2 Jaffe and Zunger (1983). In this letter we discuss pattern formation on larger length scales at various temperatures. Studying large spatial inhomogeneities by ab initio methods in thermal equilibrium, however, requires a forbidding amount of CPU time, because one needs to sample hundreds of thousands of configurations at large length scales. We therefore used a hybrid method: using a cluster expansion (CE) method Sanchez et al. (1984) we extracted interaction energies from electronic structure calculations and used these energies as input for Monte Carlo (MC) simulations of large configurations of atoms. The calculational details are explained in the following.
The basic idea of the CE is to expand the formation energy of a configuration into energy contributions of “cluster figures” (single atoms, pairs, triples,…).
| (1) |
The indices and run over all lattice sites and is for In and for Ga on lattice site . Every figure is associated with a coefficient that gives the energy contribution of the specific figure. Detailed descriptions of the CE method can be found in Müller (2003) and Sanchez et al. (1984). The coefficients of the expansion are fitted to ab-initio energies from electronic structure calculations. Figures with a low value of are neglected to simplify the expression.
| a) | b) |

|
|
| c) | d) |
|
|
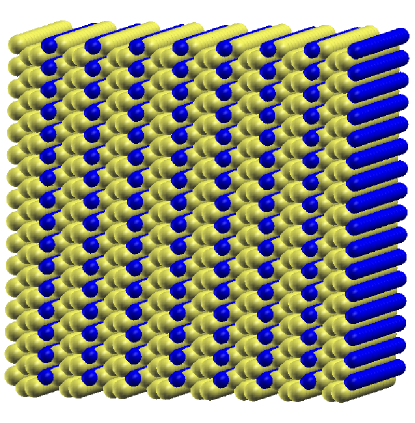
We calculated formation energies of 32 CuInxGa1-xSe2 structures (space group I2d, cf. Jaffe and Zunger (1983)) using the ab-initio electronic structure program ABINITabi Gonze et al. (2002). For the MC simulations it is necessary to vary the distribution of In and Ga (active atoms) on Wyckoff position 4b. Cu and Se atoms do not partake in the cluster expansion and are called “spectator atoms”. The CIGS unit cell is shown in Fig. 1a). The generation of structures was automated using the Alloy Theoretic Automated Toolkit ATATvan de Walle and Ceder (2002)van de Walle et al. (2002). The structures include the CuInSe2 and CuGaSe2 unit cells and super-cells containing up to 32 atoms in total with In and Ga atoms distributed on Wyckoff position 4b. Trouiller-Martins-type pseudo-potentials were used with the generalized gradient approximation of Perdew, Burke and Ernzerhof Perdew et al. (1996) for exchange and correlation energies. The cut-off energy for the plane-waves was set to 70 hartree and a k-point grid of or bigger was used. The positions of all atoms were relaxed until the maximum force on atoms was less than hartree/bohr and all three lattice parameters were relaxed until the stress was less than hartree/bohr3
| a) |
| b) |
ATAT was used to construct a number of CEs. The effective cluster interactions (ECIs) which define the CEs were obtained by a least-squares fit to ABINIT formation energies. From this number of CEs the optimal cluster figure set (with the lowest cross-validation score (CVS) Hülsen et al. (2009)) was chosen. The CE with the lowest CVS of 1.3 meV contains one point figure, eight pair figures, two triple figures and two quadruple figures. The effects of constituent strain and volume deformation Laks et al. (1992) were not taken into account, since we expect only a minor influence on the mixed state with fixed In:Ga ratio.
Canonical MC simulations were performed using the CE to calculate configurational energies. One MC move consists of exchanging the position of two active atoms (In/Ga). The simulation box contained 16168 tetragonal CIGS unit cells. This translates into a cubic simulation box with 8192 active atoms. Simulations were run at several temperatures between 25 meV (290 K, approximately room temperature) and 75 meV (870 K, approximately the production temperature of CIGS thin-film solar cells) for MC sweeps. Typically, relaxation to the equilibrium state took less than MC sweeps.
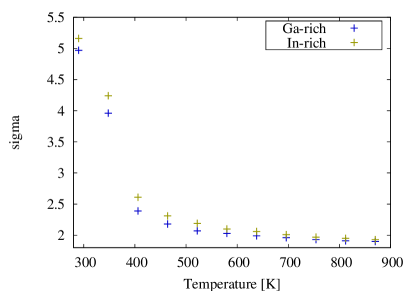
For data analysis the simulation box was divided into cubic segments of 16 lattice sites. The number of In (Ga) atoms in each segment was counted and histograms were plotted. To have a measure for the inhomogeneity we computed the standard deviation of these distributions. ( increases with increasing inhomogeneity.)
| Temperature | (In-rich) | (Ga-rich) | |
|---|---|---|---|
| 290 K | 4.97 | 5.16 | 3.8% |
| 348 K | 3.96 | 4.24 | 7.1% |
| 406 K | 2.39 | 2.61 | 9.2% |
| 464 K | 2.18 | 2.31 | 6.0% |
| 522 K | 2.07 | 2.19 | 5.8% |
| 580 K | 2.03 | 2.10 | 3.4% |
| 638 K | 1.99 | 2.06 | 3.5% |
| 696 K | 1.96 | 2.01 | 2.6% |
| 754 K | 1.93 | 1.97 | 2.1% |
| 812 K | 1.91 | 1.95 | 2.1% |
| 870 K | 1.90 | 1.93 | 1.6% |
| a) |
|
| b) |
|
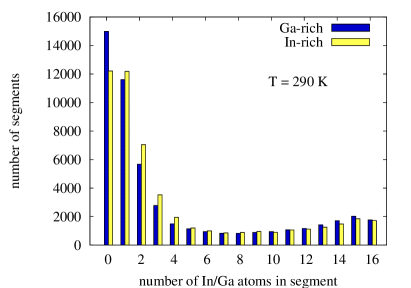
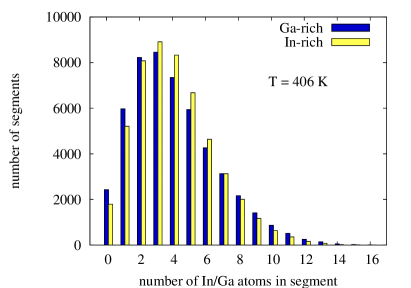
We have studied a system of CuIn0.25Ga0.75Se2, which is in the following denoted as Ga-rich CIGS, and a system of CuIn0.75Ga0.25Se2, wich is denoted as In-rich CIGS. Figure 2 shows histograms of the number of In (Ga) atoms in the segments for Ga-rich and In-rich CIGS. The temperature was kept constant at 25 meV (290 K) and 35 meV (406 K) respectively.
At 25 meV (290 K) the histograms have two maxima: a big peak to the left and a small peak to the right. The majority of the segments contain very few or no In (Ga) atoms, but the small peak indicates that a certain fraction of segments contain a lot of or exclusively In (Ga) atoms. This means there are two phases: an In phase and a Ga phase. Both peaks are higher for Ga-rich CIGS. Close to the mean value of 4 the values for In-rich CIGS are higher. The standard deviation is 3.8% higher for Ga-rich CIGS, indicating a higher inhomogeneity (Tab. 1).
At a temperature of 35 meV (406 K) the system has undergone a phase transition to a mixed, disordered phase. The histograms have changed drastically and show one broad peak with a long tail to the right. This is accompanied by a big change of to smaller values for both systems (Tab. 1). The difference of the homogeneity is very pronounced; is 9.2% higher for Ga-rich CIGS, the largest difference for all considered temperatures (Fig. 3).
At higher temperatures the shape of both histograms becomes narrower and the difference between In-rich and Ga-rich CIGS becomes smaller (Fig. 3).
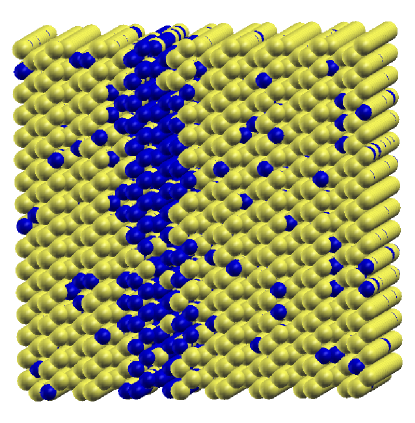
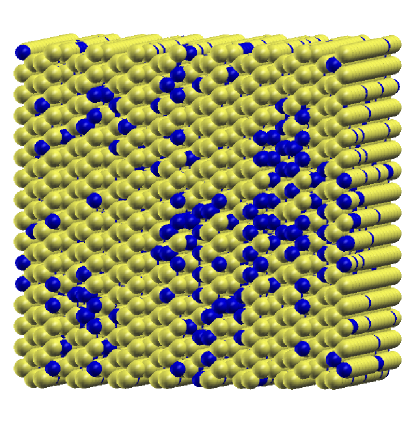
Table 1 contains the values for more temperatures, for which no histograms are shown. It can be seen that is smaller for In-rich CIGS at all temperatures and decreases with temperature for both systems. The relative difference between In-rich and Ga-rich CIGS is largest at 35 meV (406 K). The focus of this paper is not on the phase transition and we did not determine the exact transition temperature. Figures 1c) and 1d) show snapshots of a demixed state at 30 meV (348 K) and a mixed state at 35 meV (406 K), respectively. Both simulations started with an ordered system of periodic unit cells (Fig. 1b))
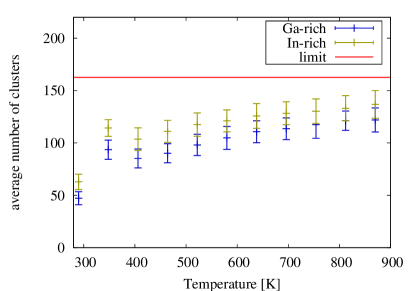
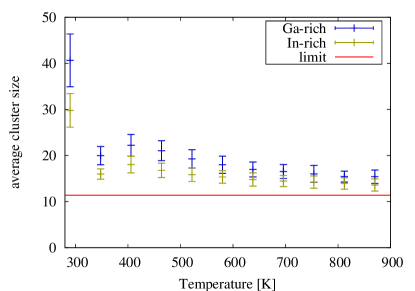
For further analysis we define clusters of In (Ga) as a number of joint In (Ga) atoms. A low number of clusters with a high average cluster size is a sign for high inhomogeneity. We look at clusters of the minority atom species; Ga in In-rich CIGS and In in Ga-rich CIGS. Figure 4 shows the average number of clusters and cluster size for In-rich and Ga-rich CIGS. Data were taken at several temperatures between 25 meV (290 K) and 200 meV (2321 K). At all temperatures the number of clusters is higher and the size of clusters is lower for In-rich CIGS, confirming the fact that Ga-rich CIGS is more inhomogeneous. The data show a continuous increase of the average number of clusters with temperature for both systems, apart from a small peak at 30 meV (near the phase transition). The increase is rapid below 30 meV and slower above 35 meV. The average size of clusters shows the opposite trend: rapid decrease below 30 meV, a dip at 30 meV and a slower decrease above 35 meV. The horizontal lines in both graphs mark the limits that were obtained in simulations with infinite temperature.
Calculations with bigger simulation boxes (24x24x12) show that finite size effects do not play a role for these results. The size of the clusters is independent of the volume, as is the ratio number of clusters : volume.
We investigated the homogeneity of CuInxGa1-xSe2 at different temperatures. By studying the spatial distribution and joint clusters of In and Ga we showed that In-rich CIGS exhibits a higher homogeneity than Ga-rich CIGS at all considered temperatures between room temperature and the approximate production temperature of solar cells. This is in agreement with the experiments of Gütay and Bauer Gütay and Bauer (2007). The effect of cluster size dependence on Ga content provides a possible explanation for the relatively low efficiency of CIGS with high Ga content (low as compared to what could be excepted from their band-gap in the homogeneous case).
Our results show that inhomogeneities get strongly pronounced as the material is cooled down to room temperature, undergoing the demixing transition. This means that a much more homogeneous sample should be expected if one would “freeze in” the high-temperature state by a faster cooling of the material. This prediction should be verifiable experimentally and it might have a valuable impact on the solar cell efficiency.
Above the demixing temperature the size of the clusters is in a regime where simple coexistence of two phases is not an adequate description. A new approach will be necessary to accurately calculate electronic properties of the material.
Acknowledgements.
The authors would like to thank Axel van de Walle for help with the ATAT program package. This work was funded by the German Bundesministerium für Umwelt, Naturschutz und Reaktorsicherheit (project 0327665A).References
- Huang (2008) C.-H. Huang, J. of Phys. and Chem. of Solids 69, 330 (2008).
- Su-Huai Wei and Zunger (1998) S. Z. Su-Huai Wei and A. Zunger, Appl. Phys. Lett. 72, 3199 (1998).
- Green et al. (2005) M. Green, K. Emery, D. King, S. Igari, and W. Warta, Prog. Photovolt: Res. Appl. 13, 49 (2005).
- Werner et al. (2005) J. Werner, J. Mattheis, and U. Rau, Thin Solid Films 480, 399 (2005).
- Gütay and Bauer (2007) L. Gütay and G. Bauer, Thin Solid Films 515, 6212 (2007).
- Gütay and Bauer (2009) L. Gütay and G. Bauer, Thin Solid Films 517, 2222 (2009).
- Gütay et al. (2009) L. Gütay, R. Pomraenke, C. Lienau, and G. Bauer, Phys. Status Solidi A 206, 1005 (2009).
- Yan et al. (2005) Y. Yan, R. Noufi, K. Jones, K. Ramanathan, M. Al-Jassim, and B. Stanbery, Appl. Phys. Lett. 87, 121904 (2005).
- Rega et al. (2005) N. Rega, S. Siebentritt, J. Albert, S. Nishiwaki, A. Zajogin, M. Lux-Steiner, R. Kniese, and M. Romero, Thin Solid Films 480, 286 (2005).
- Jaffe and Zunger (1983) J. E. Jaffe and A. Zunger, Phys. Rev. B 28, 5822 (1983).
- Sanchez et al. (1984) J. Sanchez, F. Ducastelle, and D. Gratias, Physica A 128, 334 (1984).
- Müller (2003) S. Müller, J. Phys. Condens. Matter 15, R1429 (2003).
- (13) The abinit code is a common project of the université catholique de louvain, corning incorporated, and other contributors (url http://www.abinit.org).
- Gonze et al. (2002) X. Gonze, J.-M. Beuken, R. Caracas, F. Detraux, M. Fuchs, G.-M. Rignanese, L. Sindic, M. Verstraete, G. Zerah, F. Jollet, et al., Computational Materials Science 25, 478 (2002).
- van de Walle and Ceder (2002) A. van de Walle and G. Ceder, J. of Phase Equilibria 23, 348 (2002).
- van de Walle et al. (2002) A. van de Walle, M. Asta, and G. Ceder, CALPHAD Journal 26, 539 (2002).
- Perdew et al. (1996) J. P. Perdew, K. Burke, and M. Ernzerhof, Phys. Rev. Lett. 77, 3865 (1996).
- Hülsen et al. (2009) B. Hülsen, M. Scheffler, and P. Kratzer, Phys. Rev. B 79, 094407 (2009).
- Laks et al. (1992) D. B. Laks, L. Ferreira, S. Froyen, and A. Zunger, Phys. Rev. B 46, 587 (1992).