Spitzer SAGE-SMC Infrared Photometry of Massive Stars
in
the Small Magellanic Cloud
Abstract
We present a catalog of 5324 massive stars in the Small Magellanic Cloud (SMC), with accurate spectral types compiled from the literature, and a photometric catalog for a subset of 3654 of these stars, with the goal of exploring their infrared properties. The photometric catalog consists of stars with infrared counterparts in the Spitzer SAGE-SMC survey database, for which we present uniform photometry from m in the +IRAC+MIPS24 bands. We compare the color magnitude diagrams and color-color diagrams to those of stars in the Large Magellanic Cloud (LMC), finding that the brightest infrared sources in the SMC are also the red supergiants, supergiant B[e] (sgB[e]) stars, luminous blue variables, and Wolf-Rayet stars, with the latter exhibiting less infrared excess, the red supergiants being less dusty and the sgB[e] stars being on average less luminous. Among the objects detected at 24 m in the SMC are a few very luminous hypergiants, 4 B-type stars with peculiar, flat spectral energy distributions, and all 3 known luminous blue variables. We detect a distinct Be star sequence, displaced to the red, and suggest a novel method of confirming Be star candidates photometrically. We find a higher fraction of Oe and Be stars among O and early-B stars in our SMC catalog, respectively, when compared to the LMC catalog, and that the SMC Be stars occur at higher luminosities. We estimate mass-loss rates for the red supergiants, confirming the correlation with luminosity even at the metallicity of the SMC. Finally, we confirm the new class of stars displaying composite A & F type spectra, the sgB[e] nature of 2dFS1804 and find the F0 supergiant 2dFS3528 to be a candidate luminous blue variable with cold dust.
Subject headings:
catalogs– galaxies: individual (SMC)– infrared: stars– stars: early-type– stars: emission-line, Be– stars: massive1. Introduction
The Spitzer Space Telescope Legacy Surveys SAGE (“Surveying the Agents of a Galaxy’s Evolution”, Meixner et al., 2006) and SAGE-SMC (Gordon et al., 2010) have for the first time made possible a comparative study of the infrared properties of massive stars at a range of metallicities, by imaging both the Large and Small Magellanic Clouds (LMC and SMC). In Bonanos et al. (2009, hereafter Paper I), we presented infrared properties of massive stars in the LMC (at 0.5 Z⊙). The motivation for that study was twofold: (a) to use the infrared excesses of massive stars to probe their winds, circumstellar gas and dust, and (b) to provide a template for studies of other, more distant, galaxies. Paper I was the first major compilation of accurate spectral types and multi-band photometry from 0.324 m for massive stars in any galaxy, increasing by an order of magnitude the number of massive stars for which mid-infrared photometry was available. The recently completed SAGE-SMC survey offers the opportunity to extend the study of infrared properties of massive stars to a metallicity of approximately 0.2 Z⊙ (see e.g. Hunter et al., 2007), and enables the investigation of their dependence on metallicity, at least over the range 0.2–0.5 Z⊙.
Infrared excess in hot massive stars is primarily due to free free emission from their ionized, line-driven, stellar winds. Panagia & Felli (1975) and Wright & Barlow (1975) first computed the free-free emission from ionized envelopes of hot massive stars, as a function of the mass-loss rate () and the terminal velocity of the wind (). The properties of massive stars, and in particular their stellar winds (which affect their evolution) are expected to depend on metallicity (). For example, Mokiem et al. (2007) found empirically that mass-loss rates scale as , in good agreement with theoretical predictions (Vink et al., 2001). The expectation, therefore, is that the infrared excesses of OB stars in the SMC should be lower than in the LMC, given that is lower in the SMC111The dependence of on is negligible for this range of (see Leitherer et al., 1992; Evans et al., 2004b).. Furthermore, there is strong evidence that the fraction of classical Be stars among B-type stars is higher at lower metallicity (possibly due to faster rotation, as measured by Martayan et al., 2007b). Grebel et al. (1992) were the first to find evidence for this, by showing that the cluster NGC 330 in the SMC has the largest fraction of Be stars of any known cluster in the Galaxy, LMC or SMC. More recent spectroscopic surveys (Martayan et al., 2010) have reinforced this result. In Paper I, we showed that the Be stars in the LMC are easily discriminated by their mid-infrared colors; we are therefore interested in a comparison with the SMC to quantify the global dependence of the Be star fraction on metallicity. The incidence of Be/X-ray binaries is also much higher in the SMC than in the LMC (Liu et al., 2005), while the incidence of Wolf-Rayet (WR) stars is much lower; therefore, a comparison of infrared excesses for these objects is also of interest. Finally, there is interest in the metallicity dependence of the mid-infrared colors of red supergiants, which probe circumstellar dust.
Following the same strategy as in Paper I, we compiled a catalog of massive stars, which we cross-matched in the SAGE-SMC database to study their infrared properties. This paper is organized as follows: Section 2 describes our spectroscopic and photometric catalogs of massive stars in the SMC, Section 3 presents the resulting color–magnitude and two–color diagrams, and Section 4 presents the infrared excesses detected in various types of massive stars. Section 5 investigates the mass-loss rates in red supergiants, and Section 6 summarizes our results.
2. Catalog of Massive Stars in the SMC
As in Paper I, we have compiled a catalog of massive stars with known spectral types in the SMC from the literature. We then cross-matched the stars in the SAGE-SMC database, after incorporating optical and near-infrared photometry from recent surveys of the SMC. The resulting photometric catalog was used to study the infrared properties of the stars. In Section 2.1 we describe the spectral-type catalog compiled from the literature, in Section 2.2 the existing optical, near-infrared and mid-infrared surveys of the SMC, which were included in the SAGE-SMC database, and in Section 2.3 the cross-matching procedure and the resulting photometric catalog.
2.1. Spectral-type Catalog
The criteria for inclusion in the spectral type catalog of massive SMC stars were the availability of accurate coordinates and accurate (mainly optical) spectral classifications that correspond to stars with masses . The 2dF Survey Evans et al. (2dFS; 2004a, 4161 objects) comprises the largest catalog of SMC stars with spectroscopic classifications and therefore makes up the backbone of our spectral type catalog222By retaining all SMC stars from 2dFS, we are possibly including some stars with masses .. Previous compilations (e.g. Azzopardi et al., 1975; Azzopardi & Vigneau, 1979, 1982) were included with updated coordinates from Brian Skiff’s lists333ftp://ftp.lowell.edu/pub/bas/starcats/ and spectral types from the literature, when available. The literature search resulted in 5324 entries. We do not claim completeness; however, not only have we targeted studies of hot massive stars (defined by their spectral types) in individual clusters and OB associations, but also studies of particular types of massive stars. The largest of these include: the survey of B and Be stars in NGC 330 (Martayan et al., 2007a, b, 314 stars), the VLT-FLAMES Survey of Massive Stars in NGC 330 and NGC 346 (Evans et al., 2006, 232 stars), and unpublished additional FLAMES observations in NGC 346 (PI: Evans; I. Hunter et al. 2010, in preparation, 244 OB & A-type stars). We have also added the 3 known luminous blue variables (LBVs), 5 supergiant B[e] stars (Zickgraf, 2006), 69 Be/X-ray binaries (with spectral types from the updated online catalog444http://xray.sai.msu.ru/~raguzova/BeXcat/ of Raguzova & Popov, 2005), early-type eclipsing and spectroscopic binaries, and red supergiants (Massey & Olsen, 2003; Levesque et al., 2006, 2007, 107 stars). The completeness of the catalog depends on the spectral type, e.g., it is for the unevolved O stars in our catalog (out of an estimated total of 2800 unevolved stars with masses in the SMC; Massey, 2009), while the WR catalog (Massey et al., 2003) is thought to be close to complete.
Table 1 presents our catalog of 5324 massive stars, sorted by R.A., listing: the star name(s), coordinates in degrees (J2000.0), the reference and corresponding spectral classification. The names of the stars are taken from the corresponding reference. The spectral classifications in the catalog are typically accurate to one spectral type and one luminosity class. We retained about a dozen stars from the above studies with only approximate spectral types (e.g., “early B”). For double entries, we selected the most precise spectral classification available, usually corresponding to the most recent reference.
2.2. Optical and Infrared Surveys of the SMC
Several large optical and infrared photometric catalogs of the SMC have recently become available, enabling us to obtain accurate photometry for its massive star population in the wavelength range m and in some cases up to m. The optical surveys are as follows: the catalog of Massey (2002) with 85,000 bright stars in an area covering 7.2 square degrees, the Magellanic Clouds Photometric Survey (MCPS; Zaritsky et al., 2002) including 5.1 million stars in the central 18 square degrees of the SMC, and the OGLE III catalog containing photometry of 6.2 million stars covering 14 square degrees (Udalski et al., 2008). The angular resolution is for the catalog of Massey (2002), for MCPS, and for OGLE III.
The existing near-infrared photometric catalogs include: the Two Micron All Sky Survey (2MASS; Skrutskie et al., 2006, extended by 6X2MASS) and the targeted IRSF survey (Kato et al., 2007), which contains 2.8 million sources in the central 11 square degrees of the SMC. 2MASS has a pixel scale of pixel-1, an average seeing of and limiting magnitudes of , and . IRSF has a pixel scale of pixel-1, average seeing of , , in the bands, respectively, and limiting magnitudes of , and . In the mid-infrared, the Spitzer SAGE-SMC survey uniformly imaged the whole SMC (30 square degrees) in the IRAC and MIPS bands on two epochs in 2007-2008 (Gordon et al., 2010). The survey has recently produced a combined mosaic catalog of 1.2 million sources. IRAC, with a pixel scale of pixel-1, yields an angular resolution of and MIPS at 24 m has a resolution of .
Given the variation in the depth, resolution and spatial coverage of these surveys, we included the available photometry for the massive stars in our catalog from all the MCPS, OGLE III, 2MASS, IRSF and SAGE-SMC catalogs. MCPS has incorporated the catalog of Massey (2002) for bright stars common to both catalogs. Photometry of higher accuracy, particularly in the optical, exists in the literature for many of the stars in our catalog; however, it was not included in favor of uniformity.
2.3. Photometric Catalog
2.3.1 Matching Procedure
We used the following SAGE-SMC data products to search for the mid-infrared counterparts to the 5324 massive stars listed in Table 1: the v1.0 IRAC Catalog containing IRAC Epoch 1 data bandmerged with All-Sky 2MASS and 6X2MASS catalogs, and the MIPS 24 m Epoch 1 Catalog. The details about the SAGE-SMC data processing and Legacy data products can be found in Gordon et al. (2010) and in “The SAGE-SMC Data Description: Delivery 1” document available at the NASA/IPAC Infrared Science Archive Web site555http://irsa.ipac.caltech.edu/data/SPITZER/SAGE/. The IRAC Catalog and MIPS 24 m Catalog contain high-reliability sources and are subsets of more complete, but less reliable source lists: the IRAC Archive and MIPS 24 m full list (see the data delivery document for a comparison between the catalogs and archives/full lists).
We started constructing the photometric catalog for the massive stars in our list by selecting their SAGE-SMC IRAC Epoch 1 Catalog counterparts. We performed a conservative neighbor search with a 1′′ search radius, and selected the closest match for each source. We found mid-infrared counterparts for 3654 out of 5324 sources. The IRAC Epoch 1 catalog (IRACC), MIPS 24 m catalog, IRSF, MCPS, and OGLE III catalogs were crossed-matched in the SAGE-SMC database666http://mastweb.stsci.edu/scasjobs/ to provide photometry for sources over a wavelength range from 0.3-24 m. We used this “universal catalog” to extract multi-wavelength photometry for IRAC sources matched to the massive stars. Specifically, for IRAC sources with one or more matches in other catalogs (all but 5), we only considered the closest matches between sources from any two available catalogs (IRAC-MIPS24, IRAC-MCPS, MIPS24-MCPS, IRAC-IRSF, MIPS24-IRSF, IRAC-OGLE III, MIPS24-OGLE III), with distances between the matched sources of 1′′. For example, for a match between the IRAC, MIPS 24 m and MCPS catalogs (IRAC-MIPS24-MCPS), we applied these constraints on the IRAC-MIPS24, MIPS24-MCPS, and IRAC-MCPS matches. If the match was not the closest one or the distance was , we dropped the pair. These stringent criteria were used to ensure that sources from individual catalogs for each multi-catalog match refer to the same star. Table 2 shows the breakdown of the matched stars to the catalogs, such that 40 stars were only matched to the IRACC, 214 only to the IRACC+IRSF catalogs etc.
2.3.2 Catalog Description
Table 3 presents our final matched catalog of 3654 stars, with the star name, IRAC designation, +IRAC+MIPS24 photometry and errors, reference paper, corresponding spectral classification and comments, sorted by increasing R.A.. Overall, the photometry is presented in order of shortest to longest wavelength. The 17 columns of photometry are presented in the following order: from MCPS, from OGLE III, from 2MASS, from IRSF, IRAC 3.6, 4.5, 5.8, 8.0 m (or [3.6], [4.5], [5.8], [8.0]) and MIPS 24 m (or [24]). A column with the associated error follows each measurement, except for the photometry from OGLE III. Henceforth, magnitudes refer to 2MASS photometry, whereas IRSF photometry is denoted by a subscript, e.g. . All magnitudes are calibrated relative to Vega (e.g. see Reach et al., 2005, for IRAC). In Table 4, we summarize the characteristics of each filter: the effective wavelength , zero magnitude flux (in Jy), angular resolution, and the number of detected stars in each filter.
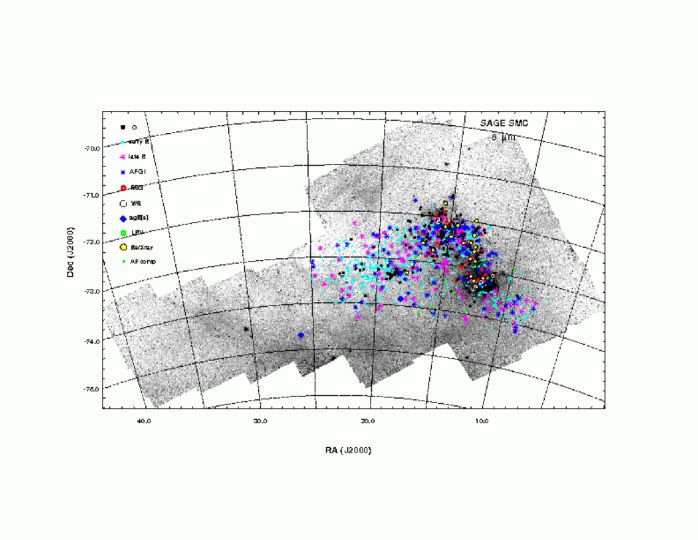
The spatial distribution of our 3654 matched sources is shown in Figure 1, overlaid onto the 8 m image of the SMC. For clarity, only a third of the early and late-B stars are shown; these are equally distributed along the SMC bar and wing. Other types are concentrated along the bar, partly due to the fact that most spectroscopic surveys have targeted the bar. The 8 m emission, which maps the surface density of the interstellar medium, is stronger in the SMC bar than the wing, since the former contains more star-forming regions.
3. Infrared Color–Magnitude and Two–Color Diagrams
We divide the matched stars into 10 categories according to their spectral types: O stars, early (B0B2.5) and late (B3B9) B stars (the majority of these have supergiant or giant luminosity classifications), spectral type A, F and G type (AFG) supergiants, K and M red supergiants (RSGs), WR stars, supergiant B[e] (sgB[e]) stars, confirmed LBVs, Be/X-ray binaries and stars with composite features of both A and F stars (AFcomp; Evans et al., 2004a, see also Section 4.4). Note, that 813 stars not included in any of the above categories are classified as “other” (and only shown in certain plots)777Note that 5 Bextr, 5 Be, 1 Be(FeII), 1 Bpec, and 1 A7-F5e star are found among these.. Most are A stars with luminosity class II or F/G stars without a luminosity classification from Evans et al. (2004a), although with km s-1. To allow for a direct comparison with the LMC results of Paper I, we present the same color–magnitude and two–color diagrams (CMDs and TCDs), identifying stars in the 10 categories described above.888The conversion to absolute magnitudes in all CMDs is based on a true SMC distance modulus of 18.91 mag (Hilditch et al., 2005).
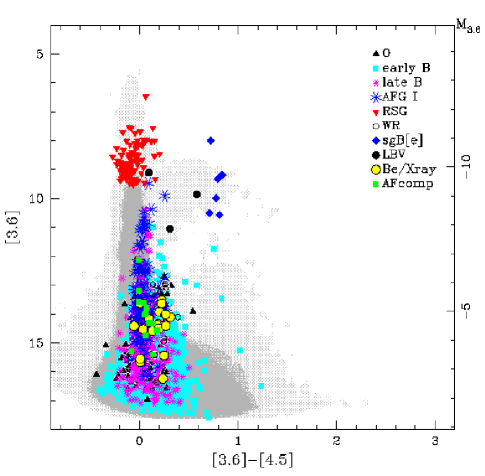
Infrared versus and CMDs for all the stars in the catalog are shown in Figures 2 and 3. The locations of all the SAGE-SMC catalog detections are represented by the gray two dimensional histogram (Hess diagram). The red giants form the clump at mag, while the vertical blue extension contains late-type SMC and foreground stars (free–free emission causes the OB stars to have redder colors). The asymptotic giant branch stars are located at mag, and mag. The RSGs, sgB[e], and LBVs are among the brightest stars at 3.6 m and occupy distinct regions in the diagrams (as in the LMC). Most of the O and B stars are located along a vertical line at , as expected. The RSGs have “blue” colors because of the depression at [4.5] due to the CO band (see e.g. Verhoelst et al., 2009). The sgB[e] stars are 0.6-0.8 mag redder and can have similar brightnesses to the RSGs. The late-B stars are brighter than the early-B stars because most of the former are luminous supergiants. A reddening vector for mag (corresponding to some of the largest values for color excess found by Massey et al., 1995; Larsen et al., 2000) is shown in Figure 3 to illustrate the small effect of reddening, which decreases at longer wavelengths. We note that the reddest of the bright AFG supergiants is the F0I eclipsing binary R47 (Prieto et al., 2008). In Figure 3, we find 3 early B-type stars with colors similar to the sgB[e] stars, although they are fainter at [3.6]. In order of increasing color, these stars are: 2dFS0402, 2dFS2411 and 2dFS2673 (all classified as B0-5V). Their evolutionary status is not clear, though they are worthy of future study (see discussion in Section 4.5). A comparison with the LMC CMDs reveals that sgB[e] stars are on average less luminous; while the RSGs are less dusty (see Section 5).
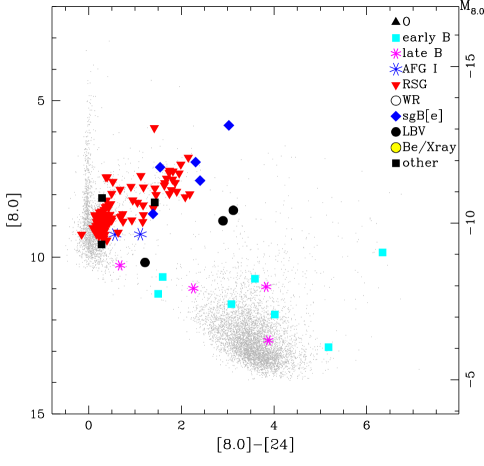
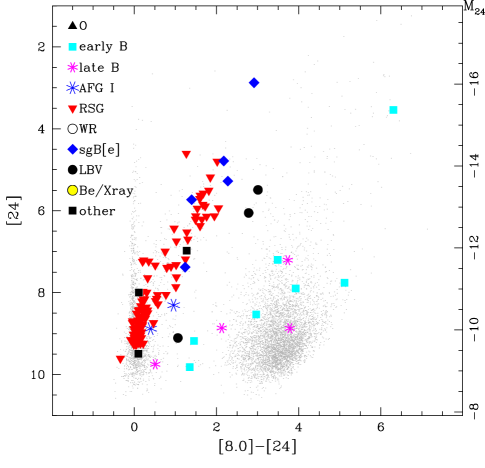
In Figures 4 and 5, we present and versus CMDs, respectively. At these wavelengths, only stars with strong [24] emission are detected, as the sensitivity of Spitzer drops sharply, while the flux from hot stellar photospheres also decreases. Stars without cool dust are located at , while dusty stars (including RSGs, LBVs, sgB[e] stars) are reddened. The faint population of sources with mag corresponds to background galaxies. We detect dusty LBVs, sgB[e], RSGs, yellow supergiants and some dusty early-B stars in these CMDs. The detection of the following stars – labeled as “other” – at [24] (in order of increasing magnitude at [24]): 2dFS35289992dFS3528 is discussed further in Section 4.5.2. (F0), 2dFS0712 (G8), and 2dFS1829 (G2), provides further evidence for their supergiant luminosity class and thus membership to the SMC. The early B-type stars appearing in these diagrams, in order of increasing magnitude at [24] are as follows: 2dFS0402, 2dFS2673 (both of type B0-5V; discussed above), AzV 9 (B0III), AzV 201 (B1(Be-Fe)), AzV 409 (or 2dFS2201; B0.5Ib), AzV 230 (B0Ib) and AzV 390 (B2Iab:). Of these, both AzV 409 and AzV 230 have spectral energy distributions (SEDs) with disk-like characteristics in all passbands (i.e. similar to the Be star SEDs shown in Paper I, Figure 17), although the former has a slight upturn at [24]. The nature of these objects is discussed in Section 4.5. Finally, the late-B and AFG supergiants present in these diagrams are hypergiants whose spectra and SEDs indicate the presence of substantial stellar winds. A comparison of the colors of various types of massive stars in the LMC versus SMC CMDs reveals that the colors of the RSGs differ the most (see Section 4.5.3).
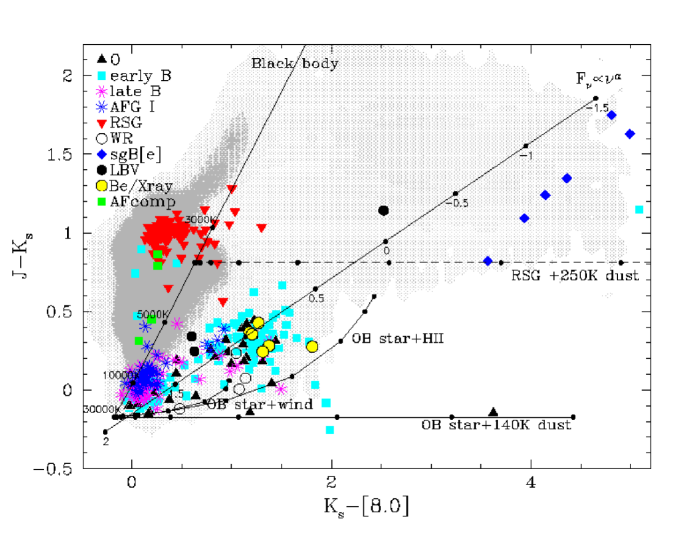
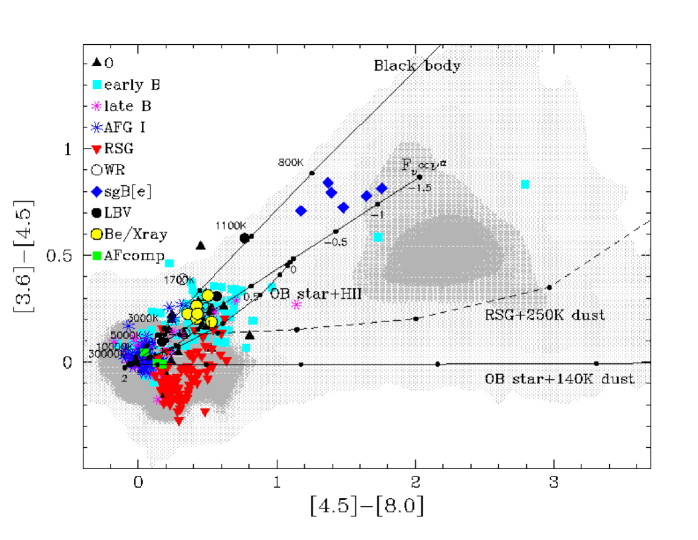
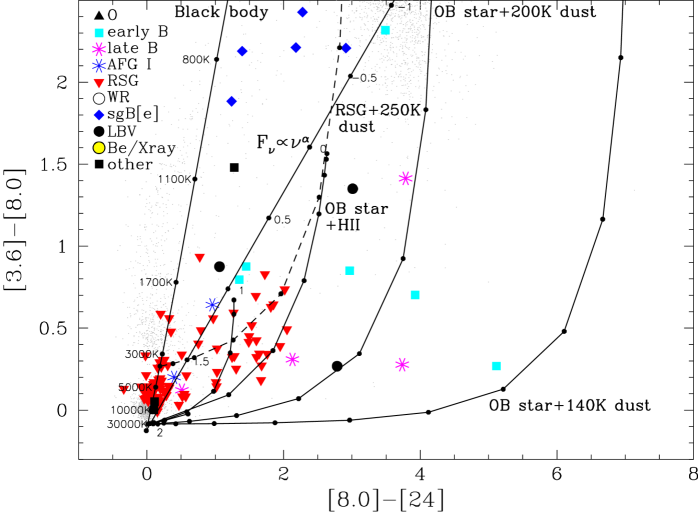
In Figures 6, 7 and 8 we present TCDs using the near and mid-infrared photometry from our matched catalog. We label stars according to their spectral types and overplot all the SAGE-SMC detections in gray as Hess diagrams. Stars without dust have mid-infrared colors near 0. Late-type stars can have excesses of mag, while the group of stars with colors , and mag correspond to young stellar objects and background galaxies. We have overplotted 6 simple theoretical models to guide the interpretation of the stars in these diagrams, which are described in detail in Paper I: (i) a blackbody (BB) at various temperatures, (ii) a power-law model F, for , (iii) an OB star (represented by a 30,000 K BB) plus an ionized wind, (iv) an OB star plus emission from an optically thin H II region, (v) an OB star plus 140 K dust, (vi) a 3,500 K BB plus 250 K dust. The most conspicuous stars in all TCDs are the sgB[e] stars, which have large excesses of mag in the color, similar to the sgB[e] stars in the LMC. R4, a B0[e]-type LBV, has mid-infrared colors intermediate between sgB[e] and Be stars. We find a remarkable bimodal distribution of the OB stars, most clearly seen in Figure 6, with the redder grouping corresponding to Oe and Be stars (see Section 4.1 for more details). Among these outliers are the Be/X-ray binaries and other emission line stars, including some yellow supergiants. The near-infrared excesses found among the sgB[e] and WR stars are on average lower than in the LMC, presumably due to the lower metallicity of the SMC. Finally, the RSGs, in contrast to their distribution in the LMC TCDs, are found to be clustered, due to the lower dust production rates at the metallicity of the SMC (see Section 5).
4. Infrared Excesses of Massive Stars in the SMC versus the LMC
In this section we study the infrared excesses of specific spectral types of massive stars, comparing them with the infrared excesses found in Paper I for the same types of stars in the LMC.
4.1. O/Oe and early-B/Be stars
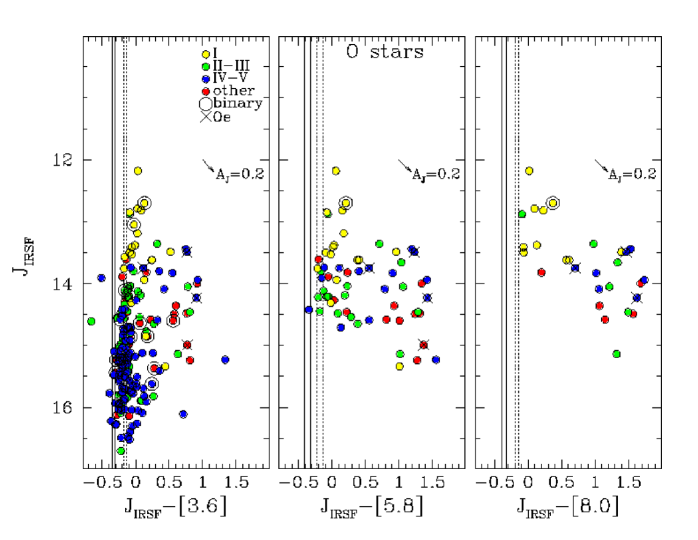
In Figures 9 and 10, we plot versus , and colors for the 208 O and 1967 early-B stars in our catalog, respectively, denoting their luminosity classes, binarity and emission line classification properties by different symbols. We compare the observed colors with colors of plane-parallel non-LTE TLUSTY stellar atmosphere models (Lanz & Hubeny, 2003, 2007) of appropriate metallicity and effective temperatures. For reference, reddening vectors and TLUSTY models reddened by mag are also shown. We clearly detect infrared excesses from free-free emission despite not having dereddened the stars, as in the LMC. At longer wavelengths, the excess is larger because the flux due to free–free emission for optically thin winds remains essentially constant with wavelength. Fewer stars are detected at longer wavelengths because of the decreasing sensitivity of Spitzer and the overall decline of their SEDs. We find that the majority of early-B supergiants in the SMC exhibit lower infrared excesses, when compared to their counterparts in the LMC (see Paper I), due to their lower mass-loss rates, although certain exceptions exist and deserve further study.
The CMDs allow us to study the frequency of Oe and Be stars, given the low foreground and internal reddening for the SMC. Our SMC catalog contains 4 Oe stars among 208 O stars (see Figure 9), of which one is bluer than the rest. There are 16 additional stars with mag and mag (including all luminosity classes), whose spectra appear normal (although the H spectral region in most cases was not observed). We refer to these as “photometric Oe” stars and attribute their infrared excesses to free-free emission from a short-lived, possibly recurrent circumstellar region, whose H emission line was not detected during the spectroscopic observations either because the gas had dispersed or because the region was optically thick to H radiation or the observation spectral range just did not extend to H. Given the expectation of lower at SMC metallicity, we argue that such a region is more likely to be a transient disk rather than a wind. Assuming these are all Oe stars, we find a fraction of Oe stars among the O stars in the SMC. The error in the fraction is dominated by small number statistics. In contrast, there are 4 Oe and 14 “photometric Oe” stars (with mag and mag) out of 354 O stars in the LMC (despite the higher at LMC metallicity), which yields a fraction of Oe stars among O stars in the LMC.
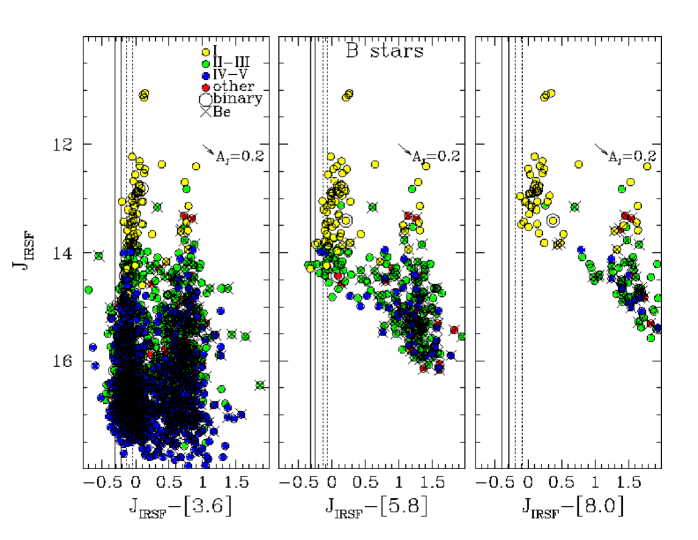
Turning to the early-B stars, the most striking feature in Figure 10 is a distinct sequence displaced by mag to the red. A large fraction of the stars falling on this redder sequence have Be star classifications, although not all Be stars reside there. Given that the circumstellar gas disks responsible for the emission in Be stars are known to completely vanish and reappear between spectra taken even 1 year apart (see review by Porter & Rivinius, 2003, and references therein), the double sequence reported here provides further evidence for the transient nature of the Be phenomenon. A bimodal distribution at the band was previously suggested by the study of Dougherty et al. (1994), which included a sample of 144 Galactic Be stars. Our larger Be sample, which is essentially unaffected by reddening, and the inclusion of all early-B stars, clearly confirms the bimodal distribution. It is due to the much larger number of Be stars classified in the SMC, in comparison to the LMC, as well as the higher fraction of Be stars among early-B stars in the SMC, which is versus in the LMC when considering only the spectroscopically confirmed Be stars (cf. for Myr B0–5 stars; Wisniewski & Bjorkman, 2006). Excluding the targeted sample of Martayan et al. (2007a, b) does not significantly bias the statistics, since the fraction only decreases to . We caution that incompleteness in our catalogs could also affect the determined fractions, if our sample turns out not to be representative of the whole population of OB stars.
We proceed to define “photometric Be” stars as early-B type stars with an intrinsic color mag, given that a circumstellar disk or envelope is required to explain such large excesses. Including these “photometric Be” stars and using the same color and magnitude cuts as for the “photometric Oe” stars above, yields fractions of Be stars among early-B stars of for the SMC and for the LMC (cf. 32% from young SMC clusters; Wisniewski & Bjorkman, 2006). Table 5 summarizes these results. We compare our results with the fractions determined by Maeder et al. (1999) from young clusters, i.e. 39% for the SMC and 23% for the LMC, finding ours to be lower, although the sample selections were very different.
These preliminary statistics (available for the first time for Oe stars) indicate that both Oe and Be stars are twice as common in the SMC than in the LMC. We emphasize the importance of including the “photometric Be” stars, which significantly increase the frequencies of Oe/O and Be/early-B stars determined and are crucial when comparing such stars in different galaxies. This novel method of confirming Oe and Be star candidates from their infrared colors or a combination of their optical and infrared colors, as recently suggested by Ita et al. (2010a) is complementary to the detailed spectroscopic analyses by e.g. Negueruela et al. (2004) on individual Oe stars to understand their nature, although it is limited to galaxies with low internal reddening. We finally note that the spectral types of Oe stars in the SMC (O7.5Ve, O7Ve, O4-7Ve and O9-B0III-Ve) and the LMC (O9Ve (Fe II), O7:Ve, O8-9IIIne, O3e) are earlier than those of known Galactic Oe stars, which are all found in the O9-B0 range (Negueruela et al., 2004).
To illustrate the double sequence more clearly, we present the same information in a histogram in Figure 11 for the early-B stars in both the LMC (from Paper I) and SMC, divided into magnitude bins. For stars with , we find the brighter, more luminous stars to be redder (cf. top 3 panels of Figure 11), as in Paper I. In the second and third panels, the mean values of the colors for the (blue, red) peaks are: (0.07, 0.74) and (0.09, 0.71) mag for the SMC and (0.01, 0.66) and (0.06, 0.79) mag for the LMC. The blue peak for the SMC stars is thus bluer than for the LMC, which is primarily due to the higher foreground reddening toward the LMC. In the second panel we find the separation between peaks to be larger for the SMC (0.81 mag) than the LMC (0.67 mag), implying that the SMC Be stars have larger infrared excesses than their LMC counterparts. Unfortunately, in the third panel, the red peak of the LMC stars is barely discernible, therefore we cannot confirm this difference. We also ran a Kolmogorov-Smirnov test to check whether the stars are drawn from the same population (assuming the sample is unbiased). This yielded a probability of 5.0 (for the stars in the 2nd row) and 5.7 (3rd row), implying that the underlying populations are indeed different.
Finally, we note that the brightest Be stars in the SMC ( mag) are brighter than the brightest Be stars in the LMC ( mag), i.e. there is a 0.7 mag difference in absolute magnitude, given the 0.5 mag difference in the distance moduli. Garmany & Humphreys (1985) were the first to make such a comparison, finding the Be stars in the Magellanic Clouds to be up to 1 mag brighter when compared to Galactic Be stars, although their observation could be due to a selection effect, related to the selection of field versus cluster Be stars. Even though our sample is not dominated by such selection effects, we also find the brightest Be stars in the SMC to be intrinsically more luminous than their LMC counterparts. Given that winds are weaker at low metallicity, it is possible that there is a mechanism that allows disks to form at higher luminosities101010This would also explain the larger infrared excesses found in Be stars in the SMC, described in the previous paragraph.. Such a possibility would have interesting implications when extrapolating to even lower metallicities (see, e.g. Ekström et al., 2008).
4.2. Be/X-ray Binaries
Dray (2006) found that both metallicity and a star formation burst must be invoked to explain the large number of high mass X-ray binaries in the SMC, and consequently the large number of Be/X-ray binaries. Of the 69 Be/X-ray binaries in our SMC photometric catalog, 21 (or ) were matched in the SAGE-SMC database (versus 4 matches out of 20 Be/X-ray binaries or in the LMC). Interestingly, some SMC Be/X-ray binaries are brighter than their LMC counterparts, despite being farther away, in agreement with the finding that Be stars in the SMC occur at higher luminosity. A comparison with the infrared colors of the Be/X-ray binaries in the LMC does not reveal any differences. The SEDs of the SMC Be/X-ray binaries show excess due to the disks around the Be stars, as in the LMC. Finally, the multiple and measurements reveal variability for many systems, which deserves further study.
4.3. Wolf-Rayet stars
Of the 12 WR stars in our spectral-type catalog, 10 were matched in the SAGE-SMC database. HD 5980 (SMC-WR5;AzV 229 WN6h;LBV binary) is labelled as an LBV in all diagrams, and is the only WR star with a detection at [24]. We compare the colors of the WR stars to those of their LMC counterparts (see Paper I) and find that their infrared excesses are much lower, possibly indicating that their winds are much weaker than those of LMC WR stars. Specifically, we find the SMC WR stars to have “bluer” colors: (versus for the LMC sample), (versus ), mag (versus ). The origin of the hydrogen absorption lines seen in 10 of the 12 WR stars (classified as “WN+abs” or “WNha”) remains unclear, since radial velocity surveys have only confirmed 4 as binary systems (Foellmi et al., 2003). The absorption in the other stars could alternatively be explained as photospheric absorption (due to weak winds; Massey et al., 2003). The infrared photometry made available for the WR stars in this paper, will enable modeling of their SEDs to determine the properties of their stellar winds and perhaps the origin of the absorption lines.
4.4. AF composite stars
Evans et al. (2004a) discovered a class of objects with peculiar composite spectra (AF composites or AFcomp), which yield an A-type classification from their Ca II K lines, but an F-type classification from other metal lines and the G-band. For example the classification AFA3kF8 denotes such an AF composite star, with Ca II K like A3 and G-band like F8. Our photometric catalog contains 16 out of the 20 AF composite stars from the 2dF Survey of Evans et al. (2004a). The AF composite stars that additionally exhibit forbidden emission lines (2dFS1804;AFA3kF0/B[e] and 2dFS2837;AFA5kF0/B[e]) are labeled and henceforth treated as sgB[e] stars.
The infrared colors of the AF composite stars provide further clues to their nature and confirm their astrophysical peculiarity. In Figure 2, their colors are indistinguishable from AFG supergiants111111The brightest AF composite star at [3.6] is 2dFS5049., while in Figure 3 they clearly have red colors, with mag. None are detected at [24]. In Figure 6, all 4 AF composite stars with [8.0] detections show near-infrared colors in the range mag; thus, intermediate between blue and red supergiants, possibly indicating these stars are on blue loops or in interacting binaries. The SEDs indeed are quite “flat”; thus, not consistent with normal single stars, while the multiple and measurements reveal variability for several sources, which in some cases can be confirmed by light curves available from the OGLE database (Udalski et al., 1997; Szymański, 2005). We note that 2dFS2945 (HV 11519) is a known Cep pulsator.
4.5. Dusty stars
Our catalog includes 166 stars with detections at [24], which indicate the presence of dust. Of these, 97 are RSGs, 5 sgB[e] and 3 LBV stars, all exhibiting dust, as expected. Luminous supergiants with strong winds or disk-like SEDs, also exhibit infrared excess at [24] and [8.0] and therefore appear in Figures 4 and 5. There are 4 B0-5 V type stars: 2dFS0402, 2dFS2411, 2dFS2673, and 2dFS3701 that have very flat SEDs. Additionally, we find a class of 44 dusty OB stars (16 late-O and 28 early-B stars, making up 2% of our sample), with similar characteristics to the peculiar population of dusty OB stars reported by Bolatto et al. (2007, 190 O9-B3 stars, corresponding to 5% of their sample) in their S3MC survey and recently confirmed by Ita et al. (2010b) with data from AKARI. Hereafter, we refer to these stars as “dusty OB stars”. They are characterized by a photospheric SED out to [5.8] and strong [24] excess, which cannot be attributed to free-free emission. Most have main-sequence luminosity classes, although there are a few giants and supergiants. In Figure 12, we plot SEDs for the 4 stars with unusually flat or rising SEDs, 2 representative examples from among the 44 “dusty OB stars” (2dFS1172, 2dFS1192) and 2 examples of luminous supergiants with infrared excess due to strong winds or disks (AzV 230, AzV 409;2dFS2201). For completeness, in Figure 13, we show 2 examples of late-B supergiants with [24] detections and the 5 AFG supergiants that have [24] detections. Note, the F0 supergiants R47 (a rare eclipsing binary; Prieto et al., 2008) and 2dFS3528 (an LBV candidate, see Section 4.5.2) are of particular interest.
The dust detected in the class of “dusty OB stars” could either be directly related to the OB stars or simply be contamination given the volume of the SMC sampled with the resolution of MIPS. While inspection of their environments shows that they are located in or near young associations, they are frequently not the youngest objects (earliest types), e.g. NGC 330 has 3 “dusty OB stars” nearby and a turn-off of around B2 (Lennon et al., 1993). We examined the spectra for 18 of these sources (12 from the 2dF Survey and 6 from the VLT-FLAMES Survey; Evans et al., 2006), which all exhibit sharp nebular-like Balmer emission lines; for those with red-optical spectra, 7 also have H nebular emission and 3 have weak [N II] and [S II] lines, indicating the presence of a faint H II region. Many sources for which we do not have spectra available are either listed in H emission line catalogs or lie in regions of faint nebulosity. Given that most “dusty OB stars” are not found within very young regions, we suggest that these sources represent unrelated cirrus hot spots or cases where hot stars are ionizing nearby dusty molecular clouds (rather than young stellar objects) producing both the nebular emission lines and emission from warm dust (as in Cepheus B, see e.g. Panagia & Thum, 1981).
4.5.1 Supergiant B[e] stars
In the SMC photometric catalog, we have detected 7 luminous sources with colors typical of sgB[e] stars (see Paper I for an introduction), i.e. , , and mag (see Figures 2 and 3). Five of these are previously known sgB[e] stars (with R50; B2-3[e] being the brightest in all IRAC and MIPS bands), while R4 (AzV 16) is classified as an LBV with a sgB[e] spectral type. In addition to these, we find that 2dFS1804 (AFA3kF0/B[e]) has a very similar SED (and therefore infrared colors) to the known sgB[e] 2dFS2837 (AFA5kF0/B[e]). Evans et al. (2004a) also remarked on the similarity of their spectra. We therefore confirm the supergiant nature of 2dFS1804 and present its SED in Figure 14 along with those of other sgB[e] and LBV stars. We note that both are photometrically variable. The similarity of the SEDs of these sgB[e] stars, despite the various optical spectral classifications, implies that all are the same class of object. The cooler, composite spectral types indicate a lower mass and perhaps a transitional stage to or from the sgB[e] phenomenon. The only difference we find between the sgB[e] stars in the SMC versus the LMC is that on average they are 1-2 mag fainter (in absolute terms).
4.5.2 Luminous Blue Variables
All 3 known LBVs in the SMC: R4 (AzV 16, B0[e]LBV), R40 (AzV 415, A2Ia: LBV) and HD 5980 (WN6h;LBV binary), were all detected at infrared wavelengths. In all CMDs and TCDs, R4 is the more reddened LBV. It occupies a location similar to other sgB[e] stars on the CMDs; however, in Figures 6 and 7 it lies between the sgB[e] and the Be stars, whereas the colors of HD 5980 (a well known eccentric eclipsing binary, see e.g. Foellmi et al., 2008) are similar to those of the LBVs in the LMC. We plot their SEDs in Figure 14 and find them to differ, given their very different spectral types. Moreover, we find evidence for variability, which can be confirmed from existing light curves in the All Sky Automated Survey (ASAS; Pojmański, 2002), as pointed out by Szczygiel et al. (2010), who studied the variability of the massive stars presented in Paper I in the LMC. The various SED shapes and spectral types observed depend on the time since the last outburst event and the amount of dust formed.
Finally, we note that the F0 star, 2dFS3528 (Sk166) also lies among the sgB[e] stars in Figures 4, 5 and 8 and near R4 (AzV 16; B0[e]LBV) in the other CMDs and TCDs, because it has a similar SED (cf. 13 and Figures 14). Although Sanduleak originally classified this star as “OB:”, its 2dF spectrum is clearly F-type, but with strong H emission having broad wings, which indicate a wind. Osmer (1973) designated it as a nonmember based on its optical colors. It is included in the catalog of Massey (2002)121212[M2002] 80339; , , , and mag. and indeed has some colors that are too blue, while others are too red for its spectral type. However, the radial velocity measured by Evans & Howarth (2008, km s-1) firmly places it in the SMC. The SED of 2dFS3528 is distinctly sgB[e]-like and most similar to that of R4. All the above characteristics, along with the variability detected in the near-infrared, make this star an LBV candidate. Further monitoring is highly desirable to confirm its LBV nature.
4.5.3 Red Supergiants
The RSGs are among the brightest mid-infrared sources in the SMC, with absolute magnitudes reaching mag at [3.6], and mag at [8.0] and [24]. However, in the LMC, some RSGs occur at higher [24] luminosities. SMC_018592 (K0-2I) is the brightest RSG at [3.6], [8.0] and [24] (see Figures 2, 4, 5). In Figure 3, the following 3 RSGs have “bluer” colors than the rest (in order of increasing [3.6] magnitude): SMC_030135 (K2I), SMC_035231 (K2I) and SMC_049990;2dFS1517. The latter has two classifications: K5I by Massey & Olsen (2003) and G2 by Evans et al. (2004a), making it a variable candidate (given also its radial velocity: km s-1, Evans & Howarth, 2008). In Figure 6, SMC_035231 (K2I) is the outlier at (0.4, 0.6), making it a possible foreground dwarf; while SMC_058738 (K2I) is the outlier at (1.0, 0.5). We note that SMC_055188 (M3-M4I) and SMC_046662 (M0I) were reported by Levesque et al. (2007) to have variable spectral types; they are included in our catalog and are among the more reddened RSGs.
A comparison of the SMC CMDs and TCDs to the corresponding ones of the LMC from Paper I, reveals that the distribution of RSG colors is quite different. The SMC RSGs have a dominant population of non-dusty RSGs and a population of dusty RSGs, with a distinct color distribution. In contrast, almost all RSGs in the LMC are dusty to some degree, with a rather continuous distribution in color. This difference is due to the lower dust content (), which is not compensated for by the lower wind velocity (, see van Loon, 2000, 2006; van Loon et al., 2008). Furthermore, since both the dust production rate (cf. Sloan et al., 2008) and the dust-to-gas ratio depend on (van Loon, 2006), is independent of , though the wind velocities of RSGs depend on metallicity (see e.g. Habing et al., 1994; Marshall et al., 2004). While the optical and near-infrared colors of RSGs have long been known to display a dependence (cf. Arp, 1959; Oestreicher et al., 1997), the systematics of their mid-infrared colors have only been investigated for limited samples (e.g. Groenewegen et al., 2009).
5. Red Supergiant Mass-Loss Rates
Our large samples of RSGs in the SMC and LMC lend themselves to a study of the dependence of the mass-loss rate. Figure 15 presents the versus CMD for both SMC and LMC RSGs (from Paper I), on which the RSGs are spread out as a result of various amounts of circumstellar dust. The fainter RSGs in the SMC concentrate around a vertical sequence at mag, but all other RSGs have significantly redder colors indicative of the emission from dust. A series of models for a star with spectral type M0 and luminosity 85,000 L⊙ (Groenewegen, 2006) are plotted for reference, showing that the dust remains optically thin at near-infrared wavelengths for mag.
The color is a good measure of the optical depth of the circumstellar dust envelope. We use the results from radiative transfer modeling presented in Groenewegen (2006) for a star of luminosity L⊙, wind speed km s-1, dust-to-gas ratio , surrounded by silicate grains with a size of 0.1 m and a condensation temperature of 1000 K. The relation between this reference and color is shown in Figure 16, for a star of spectral type M0 (typical for the SMC stars) and again for a star of spectral type M6 (at the cool extreme of the LMC stars in our sample). For colors mag, the relation is rather steep; given the inaccuracies in photometry and stellar parameters we will not assign mass-loss rates to these non-dusty stars. For colors mag, the relation is quite well approximated by the formula:
| (1) |
The deviations from this formula are not (much) more than a factor of two for individual stars, and will tend to average out when considering the sample as a whole.
The true is obtained by applying scaling relations valid for dust-driven winds (cf. van Loon, 2007):
| (2) |
where the wind speed scales as (e.g. Marshall et al., 2004)
| (3) |
For the dust-to-gas ratio , we adopt a value roughly in proportion to the metallicity of the stellar population, namely, for the SMC and for the LMC (cf. van Loon, 2000, 2006). The luminosity is obtained by scaling the band magnitude of the model star from Groenewegen (2006); for the SMC stars we adopt mag for the 3000 L⊙ star, at a reference distance of 8.5 kpc (this corresponds to a spectral type M0) and mag for the LMC stars (spectral type about M2). The distance modulus to the SMC is taken as 18.91 mag, and to the LMC as 18.41 mag (to be consistent with Paper I). The inaccuracies in the luminosities resulting from this approximation are of the order of 20%, which is small for our purposes.
The estimated mass-loss rates show a clear positive correlation with luminosity (see Figure 17), confirming previous results (van Loon et al., 1999, 2005; van Loon, 2006; Groenewegen et al., 2009) with a larger sample of stars. Apparently, the fainter RSGs are not very proficient in their mass loss. However, these mass-loss rates were derived by assuming that dust condenses in these winds at the efficiencies expected from their metal content. This may not be true, particularly in the relatively warm atmospheres of early-M or late-K type stars, where the dust-to-gas ratio can be much less than assumed here (cf. van Loon et al., 2005). Indeed, at L⊙ most of the RSGs in the SMC show very little evidence of dust at all, but they may still exhibit a purely gaseous wind. On the other hand, the values for the wind speed are estimated to be 9–12 km s-1 for the SMC sample (12–19 km s-1 for the LMC sample). This is consistent with expectations for a fluid in which the grains are well coupled to the gas and thus can transfer momentum from the radiation field onto the bulk matter (cf. Marshall et al., 2004); much lower values could bring this assumption into question (cf. McDonald et al., 2009).
The mass-loss rate is next compared to the rate at which matter is converted into energy in the central engine of the star, to assess whether much mass is lost before the star is taken elsewhere on its evolutionary path. In the context of core-helium burning RSGs, the most relevant process is the triple- process, which has an efficiency erg g-1 (Kippenhahn & Weigert, 1990); we also compare to the CNO cycle, which governs hydrogen shell burning and has erg g-1. The nuclear burning rate (in M⊙ yr-1) is then:
| (4) |
We find that essentially all RSGs in our samples lose mass through stellar winds at a significantly lower rate than that at which helium is burned in their cores (Figure 17), often by an order of magnitude difference. This is in stark contrast to samples of RSGs that were selected from among the brightest mid-infrared sources; van Loon et al. (1999) showed that most of those RSGs have mass-loss rates similar to the nuclear burning rate, with a few extreme objects exceeding that rate by a significant amount. The optically selected RSGs in the SMC and LMC are therefore found to be in a more stable phase of RSG evolution, in contrast to the RSGs selected as bright mid-infrared sources, which have a shorter lifetime. The prescriptions of de Jager et al. (1988) for 3000, 4000 and 5000K coincide with the most luminous LMC RSGs, but are too high for the less luminous RSGs (in both galaxies). The 3000K prescription of de Jager et al. (1988) better reproduces the luminous RSGs in the SMC, whereas the warmer prescriptions better reproduce the luminous RSGs in the LMC. This is in conflict with the observed differences in temperature, with the SMC RSGs having earlier spectral types than their LMC counterparts.
The SMC sample on the whole exhibits lower dusty mass-loss rates than the LMC sample (Figure 17), and RSGs in the SMC appear to contribute relatively more at higher luminosities ( L⊙), while RSGs in the LMC also contribute noticeably at fainter luminosities. Both observations are likely related to the warmer atmospheres (earlier spectral types) of the SMC RSGs compared to those in the LMC. We thus conjecture that dusty mass loss plays a less important role in the SMC than in the LMC, while other forms of mass loss may instead be more important. For instance, as recently suggested (van Loon et al., 2010a), the warmer winds of metal-poor RSGs could be more susceptible to the coupling of Alfvén waves, which could provide a driving mechanism in the absence of radiation pressure.
We emphasize that our samples miss the dustiest RSGs, which are in brief episodes of very high mass loss; therefore, our results only apply to the optically bright RSG phase. A few such very dusty RSGs (known to exist in the Magellanic Clouds, e.g. Wood et al., 1992; Groenewegen & Blommaert, 1998; van Loon et al., 1999, 2010a, 2010b; Srinivasan et al., 2009) contribute more dust than the entire samples of optically bright RSGs considered here.
6. Summary
This paper presents the first catalogs of accurate spectral types and multi-wavelength photometry of massive stars in the SMC, which are used to study their infrared properties. The spectroscopic catalog contains 5324 massive stars, with accurate positions and spectral types compiled from the literature, and constitutes the largest such catalog currently available for any galaxy. The photometric catalog comprises uniform 0.3–24 m photometry in the +IRAC+MIPS24 bands for a subset of 3654 stars that were matched in the SAGE-SMC database. The low foreground reddening toward the SMC, and the identical distance of the stars minimize systematic errors due to reddening and enable the investigation of infrared excesses. As in Paper I, we construct CMDs and TCDs, and discuss the position of O, early and late-B stars, WR, LBV, sgB[e], classical Be stars, RSGs, AFG supergiants, and Be/X-ray binaries on them. These diagrams are useful for interpreting infrared photometry of resolved massive stars in nearby galaxies at low metallicity.
A comparison of the infrared colors of the massive stars in the SMC to those of their counterparts in the LMC (presented in Paper I) reveals differences that are due to the different evolution at SMC metallicity. The main results of our study concern the emission line Oe and Be stars, and the RSGs. We detected a clear bimodal distribution of early-B stars, with the redder sequence corresponding to classical Be stars and therefore propose that Be stars (and similarly Oe stars) can be easily discriminated photometrically, by their infrared colors. We find the fraction of emission line stars in the SMC ( for Oe and for Be) to be double that of the LMC ( for Oe and for Be), when including the “photometric” Oe and Be stars. This is the first time the frequency of Oe stars is determined beyond the Galaxy and at subsolar metallicities. We also find Be stars and Be/X-ray binaries to occur at higher luminosity, sgB[e] stars to be on average less luminous than their counterparts in the LMC (at [3.6]), and WR stars to have smaller excess, all due to the different evolution at the lower metallicity of the SMC.
The infrared colors of the RSGs in the SMC are found in most cases to be consistent with little dust, with only the most luminous sources showing excess emission presumably from circumstellar dust. This is in contrast to the generally dusty RSGs in the LMC, and agrees with the expectation that the dust content in metal-poor RSGs is lower. We find that the mass-loss rates in SMC RSGs correlate positively with luminosity, as in the LMC. Finally, we confirm the astrophysical peculiarity of the composite A & F type spectra discovered by Evans et al. (2004a), the sgB[e] nature of 2dFS1804, and find the F0 supergiant 2dFS3528 to be an LBV candidate. This paper thus demonstrates the wealth of information contained in the SAGE-SMC survey, and enables studies of the infrared properties of massive stars as a function of metallicity, in combination with the SAGE survey of the LMC. Studies of particular classes of massive stars and whole massive star populations in nearby galaxies, as outlined in Paper I, are obvious directions for follow-up.


References
- Antoniou et al. (2009) Antoniou, V., Hatzidimitriou, D., Zezas, A., & Reig, P. 2009, ApJ, 707, 1080
- Arp (1959) Arp, B. H. 1959, AJ, 64, 254
- Azzopardi & Vigneau (1979) Azzopardi, M. & Vigneau, J. 1979, A&AS, 35, 353
- Azzopardi & Vigneau (1982) —. 1982, A&AS, 50, 291
- Azzopardi et al. (1975) Azzopardi, M., Vigneau, J., & Macquet, M. 1975, A&AS, 22, 285
- Barbá et al. (1995) Barbá, R. H., Niemela, V. S., Baume, G., et al. 1995, ApJ, 446, L23
- Bartzakos et al. (2001) Bartzakos, P., Moffat, A. F. J., & Niemela, V. S. 2001, MNRAS, 324, 18
- Bolatto et al. (2007) Bolatto, A. D., Simon, J. D., Stanimirović, S., et al. 2007, ApJ, 655, 212
- Bonanos et al. (2009) Bonanos, A. Z., Massa, D. L., Sewilo, M., et al. 2009, AJ, 138, 1003
- de Jager et al. (1988) de Jager, C., Nieuwenhuijzen, H., & van der Hucht, K. A. 1988, A&AS, 72, 259
- Dougherty et al. (1994) Dougherty, S. M., Waters, L. B. F. M., Burki, G., et al. 1994, A&A, 290, 609
- Dray (2006) Dray, L. M. 2006, MNRAS, 370, 2079
- Ekström et al. (2008) Ekström, S., Meynet, G., Maeder, A., & Barblan, F. 2008, A&A, 478, 467
- Evans & Howarth (2008) Evans, C. J. & Howarth, I. D. 2008, MNRAS, 386, 826
- Evans et al. (2004a) Evans, C. J., Howarth, I. D., Irwin, M. J., et al. 2004a, MNRAS, 353, 601
- Evans et al. (2006) Evans, C. J., Lennon, D. J., Smartt, S. J., et al. 2006, A&A, 456, 623
- Evans et al. (2004b) Evans, C. J., Lennon, D. J., Trundle, C., et al. 2004b, ApJ, 607, 451
- Feast et al. (1960) Feast, M. W., Thackeray, A. D., & Wesselink, A. J. 1960, MNRAS, 121, 337
- Foellmi et al. (2008) Foellmi, C., Koenigsberger, G., Georgiev, L., et al. 2008, Revista Mexicana de Astronomía y Astrofísica, 44, 3
- Foellmi et al. (2003) Foellmi, C., Moffat, A. F. J., & Guerrero, M. A. 2003, MNRAS, 338, 360
- Garmany et al. (1987) Garmany, C. D., Conti, P. S., & Massey, P. 1987, AJ, 93, 1070
- Garmany & Humphreys (1985) Garmany, C. D. & Humphreys, R. M. 1985, AJ, 90, 2009
- Gordon et al. (2010) Gordon, K. D., Meixner, M., Blum, R., et al. 2010, AJ, in preparation
- Grebel et al. (1992) Grebel, E. K., Richtler, T., & de Boer, K. S. 1992, A&A, 254, L5
- Groenewegen (2006) Groenewegen, M. A. T. 2006, A&A, 448, 181
- Groenewegen & Blommaert (1998) Groenewegen, M. A. T. & Blommaert, J. A. D. L. 1998, A&A, 332, 25
- Groenewegen et al. (2009) Groenewegen, M. A. T., Sloan, G. C., Soszyński, I., et al. 2009, A&A, 506, 1277
- Habing et al. (1994) Habing, H. J., Tignon, J., & Tielens, A. G. G. M. 1994, A&A, 286, 523
- Harries et al. (2003) Harries, T. J., Hilditch, R. W., & Howarth, I. D. 2003, MNRAS, 339, 157
- Hilditch et al. (2005) Hilditch, R. W., Howarth, I. D., & Harries, T. J. 2005, MNRAS, 357, 304
- Humphreys (1983) Humphreys, R. M. 1983, ApJ, 265, 176
- Hunter et al. (2007) Hunter, I., Dufton, P. L., Smartt, S. J., et al. 2007, A&A, 466, 277
- Hunter et al. (in preparation) Hunter, I., Evans, C., et al. in preparation
- Ita et al. (2010a) Ita, Y., Matsuura, M., Ishihara, D., et al. 2010a, A&A, 514, 2
- Ita et al. (2010b) Ita, Y., Onaka, T., Tanabe, T., et al. 2010b, PASJ, 62, 273
- Kato et al. (2007) Kato, D., Nagashima, C., Nagayama, T., et al. 2007, PASJ, 59, 615
- Kippenhahn & Weigert (1990) Kippenhahn, R. & Weigert, A. 1990, Stellar Structure and Evolution (Springer-Verlag Berlin Heidelberg New York.)
- Lanz & Hubeny (2003) Lanz, T. & Hubeny, I. 2003, ApJS, 146, 417
- Lanz & Hubeny (2007) —. 2007, ApJS, 169, 83
- Larsen et al. (2000) Larsen, S. S., Clausen, J. V., & Storm, J. 2000, A&A, 364, 455
- Leitherer et al. (1992) Leitherer, C., Robert, C., & Drissen, L. 1992, ApJ, 401, 596
- Lennon (1997) Lennon, D. J. 1997, A&A, 317, 871
- Lennon et al. (1993) Lennon, D. J., Mazzali, P. A., Pasian, F., et al. 1993, Space Science Reviews, 66, 169
- Levesque et al. (2006) Levesque, E. M., Massey, P., Olsen, K. A. G., et al. 2006, ApJ, 645, 1102
- Levesque et al. (2007) —. 2007, ApJ, 667, 202
- Liu et al. (2005) Liu, Q. Z., van Paradijs, J., & van den Heuvel, E. P. J. 2005, A&A, 442, 1135
- Maeder et al. (1999) Maeder, A., Grebel, E. K., & Mermilliod, J. 1999, A&A, 346, 459
- Marshall et al. (2004) Marshall, J. R., van Loon, J. T., Matsuura, M., Wood, P. R., Zijlstra, A. A., & Whitelock, P. A. 2004, MNRAS, 355, 1348
- Martayan et al. (2010) Martayan, C., Baade, D., & Fabregat, J. 2010, A&A, 509, A11
- Martayan et al. (2007a) Martayan, C., Floquet, M., Hubert, A. M., et al. 2007a, A&A, 472, 577
- Martayan et al. (2007b) Martayan, C., Frémat, Y., Hubert, A., et al. 2007b, A&A, 462, 683
- Massey (2002) Massey, P. 2002, ApJS, 141, 81
- Massey (2009) —. 2009, arXiv:0903.0155
- Massey et al. (1995) Massey, P., Lang, C. C., Degioia-Eastwood, K., et al. 1995, ApJ, 438, 188
- Massey & Olsen (2003) Massey, P. & Olsen, K. A. G. 2003, AJ, 126, 2867
- Massey et al. (2003) Massey, P., Olsen, K. A. G., & Parker, J. W. 2003, PASP, 115, 1265
- Massey et al. (1989) Massey, P., Parker, J. W., & Garmany, C. D. 1989, AJ, 98, 1305
- Massey et al. (2005) Massey, P., Puls, J., Pauldrach, A. W. A., et al. 2005, ApJ, 627, 477
- Massey et al. (2000) Massey, P., Waterhouse, E., & DeGioia-Eastwood, K. 2000, AJ, 119, 2214
- Massey et al. (2009) Massey, P., Zangari, A. M., Morrell, N. I., et al. 2009, ApJ, 692, 618
- McDonald et al. (2009) McDonald, I., van Loon, J. T., Decin, L., et al. 2009, MNRAS, 394, 831
- Meixner et al. (2006) Meixner, M., Gordon, K. D., Indebetouw, R., et al. 2006, AJ, 132, 2268
- Mennickent et al. (2006) Mennickent, R. E., Cidale, L., Pietrzyński, G., et al. 2006, A&A, 457, 949
- Mokiem et al. (2007) Mokiem, M. R., de Koter, A., Vink, J. S., et al. 2007, A&A, 473, 603
- Negueruela et al. (2004) Negueruela, I., Steele, I. A., & Bernabeu, G. 2004, Astronomische Nachrichten, 325, 749
- Oestreicher et al. (1997) Oestreicher, M. O., Schmidt-Kaler, T., & Wargau, W. 1997, MNRAS, 289, 729
- Osmer (1973) Osmer, P. S. 1973, ApJ, 181, 327
- Panagia & Felli (1975) Panagia, N. & Felli, M. 1975, A&A, 39, 1
- Panagia & Thum (1981) Panagia, N. & Thum, C. 1981, A&A, 98, 295
- Pojmański (2002) Pojmański, G. 2002, Acta Astronomica, 52, 397
- Porter & Rivinius (2003) Porter, J. M. & Rivinius, T. 2003, PASP, 115, 1153
- Prieto et al. (2008) Prieto, J. L., Stanek, K. Z., Kochanek, C. S., et al. 2008, ApJ, 673, L59
- Raguzova & Popov (2005) Raguzova, N. V. & Popov, S. B. 2005, Astronomical and Astrophysical Transactions, 24, 151
- Reach et al. (2005) Reach, W. T., Megeath, S. T., Cohen, M., et al. 2005, PASP, 117, 978
- Sanduleak (1968) Sanduleak, N. 1968, AJ, 73, 246
- Sanduleak (1969) —. 1969, AJ, 74, 877
- Skrutskie et al. (2006) Skrutskie, M. F., Cutri, R. M., Stiening, R., et al. 2006, AJ, 131, 1163
- Sloan et al. (2008) Sloan, G. C., Kraemer, K. E., Wood, P. R., et al. 2008, ApJ, 686, 1056
- Smith Neubig & Bruhweiler (1997) Smith Neubig, M. M. & Bruhweiler, F. C. 1997, AJ, 114, 1951
- Srinivasan et al. (2009) Srinivasan, S., Meixner, M., Leitherer, C., et al. 2009, AJ, 137, 4810
- Szczygiel et al. (2010) Szczygiel, D. M., Stanek, K. Z., Bonanos, A. Z., et al. 2010, AJ, 140, 14
- Szymański (2005) Szymański, M. K. 2005, Acta Astronomica, 55, 43
- Udalski et al. (1997) Udalski, A., Kubiak, M., & Szymański, M. 1997, Acta Astronomica, 47, 319
- Udalski et al. (2008) Udalski, A., Soszyński, I., Szymański, M. K., et al. 2008, Acta Astronomica, 58, 329
- van Loon (2000) van Loon, J. T. 2000, A&A, 354, 125
- van Loon (2006) van Loon, J. T. 2006, in Astronomical Society of the Pacific Conference Series, Vol. 353, Stellar Evolution at Low Metallicity: Mass Loss, Explosions, Cosmology, ed. H. J. G. L. M. Lamers, N. Langer, T. Nugis, & K. Annuk, 211
- van Loon (2007) van Loon, J. T. 2007, in Astronomical Society of the Pacific Conference Series, Vol. 378, Why Galaxies Care About AGB Stars: Their Importance as Actors and Probes, ed. F. Kerschbaum, C. Charbonnel, & R. F. Wing, 227
- van Loon et al. (2005) van Loon, J. T., Cioni, M., Zijlstra, A. A., et al. 2005, A&A, 438, 273
- van Loon et al. (2008) van Loon, J. T., Cohen, M., Oliveira, J. M., et al. 2008, A&A, 487, 1055
- van Loon et al. (1999) van Loon, J. T., Groenewegen, M. A. T., de Koter, A., et al. 1999, A&A, 351, 559
- van Loon et al. (2010a) van Loon, J. T., Oliveira, J. M., Gordon, K. D., et al. 2010a, AJ, 139, 68
- van Loon et al. (2010b) —. 2010b, AJ, 139, 1553
- Verhoelst et al. (2009) Verhoelst, T., van der Zypen, N., Hony, S., et al. 2009, A&A, 498, 127
- Vink et al. (2001) Vink, J. S., de Koter, A., & Lamers, H. J. G. L. M. 2001, A&A, 369, 574
- Wisniewski & Bjorkman (2006) Wisniewski, J. P. & Bjorkman, K. S. 2006, ApJ, 652, 458
- Wisniewski et al. (2007) Wisniewski, J. P., Bjorkman, K. S., Bjorkman, J. E., et al. 2007, ApJ, 670, 1331
- Wood et al. (1992) Wood, P. R., Whiteoak, J. B., Hughes, S. M. G., et al. 1992, ApJ, 397, 552
- Wright & Barlow (1975) Wright, A. E. & Barlow, M. J. 1975, MNRAS, 170, 41
- Zaritsky et al. (2002) Zaritsky, D., Harris, J., Thompson, I. B., et al. 2002, AJ, 123, 855
- Zickgraf (2006) Zickgraf, F.-J. 2006, in Astronomical Society of the Pacific Conference Series, Vol. 355, Stars with the B[e] Phenomenon, ed. M. Kraus & A. S. Miroshnichenko, 135
| Star | RA (J2000) | Dec (J2000) | Referenceb | Classification |
|---|---|---|---|---|
| Namea | (deg) | (deg) | & Comments | |
| 2dFS0001 | 6.944625 | 73.27911 | E04 | O9.5: |
| 2dFS0002 | 7.036375 | 73.49611 | E04 | B0-5V |
| 2dFS0003 | 7.089875 | 73.17531 | E04 | B0-5V |
| 2dFS0004 | 7.102458 | 73.88650 | E04 | B0-5III |
| 2dFS0005 | 7.137542 | 73.30739 | E04 | B0-5V |
| 2dFS0006 | 7.243000 | 73.46847 | E04 | A2II |
| 2dFS0007 | 7.246125 | 73.28139 | E04 | B1-3II |
| 2dFS0008 | 7.322250 | 73.14731 | E04 | B0-5IV |
Note. — Table 1 is available in its entirety in the electronic version of the Journal. A portion is shown here for guidance regarding its form and content.
| Catalogs Matched | # Stars |
|---|---|
| IRACC | 40 |
| IRACC+IRSF | 214 |
| IRACC+IRSF+OGLE | 352 |
| IRACC+MCPS | 3 |
| IRACC+MCPS+IRSF | 57 |
| IRACC+MCPS+IRSF+OGLE | 2733 |
| IRACC+MCPS+OGLE | 54 |
| IRACC+MCPS+MIPS24 | 3 |
| IRACC+MIPS24 | 6 |
| IRACC+MIPS24+IRSF | 35 |
| IRACC+MIPS24+IRSF+OGLE | 10 |
| IRACC+MIPS24+MCPS+IRSF | 80 |
| IRACC+MIPS24+MCPS+IRSF+OGLE | 32 |
| IRACC+OGLE | 35 |
| Star Namea | IRAC Designation | RA(J2000) | Dec(J2000) | … | Ref.b | Classification & Comments | ||||
|---|---|---|---|---|---|---|---|---|---|---|
| 2dFS0005 | J002832.82731827.0 | 7.137542 | 73.30739 | 16.33 | 0.042 | 17.063 | 0.023 | … | E04 | B05V |
| 2dFS0006 | J002858.15732807.0 | 7.243 | 73.46848 | 16.648 | 0.048 | 16.605 | 0.056 | … | E04 | A2II |
| 2dFS0010 | J002923.69734424.6 | 7.349375 | 73.73997 | 16.706 | 0.041 | 17.318 | 0.033 | … | E04 | B05V |
| 2dFS0016 | J003033.08735709.9 | 7.6385 | 73.95272 | 15.977 | 0.052 | 16.051 | 0.03 | … | E04 | A0II |
| 2dFS0019 | J003049.36740000.3 | 7.706292 | 73.99995 | 16.006 | 0.05 | 16 | 0.041 | … | E04 | A0II |
| 2dFS0024 | J003107.03732709.9 | 7.780042 | 73.45267 | 16.611 | 0.114 | 17.119 | 0.034 | … | E04 | B3IV |
| 2dFS0026 | J003111.52735936.1 | 7.798458 | 73.99333 | 15.744 | 0.049 | 16.292 | 0.033 | … | E04 | B13V |
Note. — Table 3 is available in its entirety in the electronic version of the Journal. A portion is shown here for guidance regarding its form and content.
| Filter | Zero mag | Resolution | # stars | |
|---|---|---|---|---|
| (m) | flux (Jy) | () | detected | |
| 0.36 | 1790 | 1.5/2.6 | 2921 | |
| 0.44 | 4063 | 1.5/2.6 | 2962 | |
| 0.555 | 3636 | 1.5/2.6 | 2962 | |
| 0.79 | 2416 | 1.5/2.6 | 2844 | |
| 0.555 | 3636 | 1.2 | 3152 | |
| 0.79 | 2416 | 1.2 | 3166 | |
| 1.235 | 1594 | 2.5 | 3039 | |
| 1.662 | 1024 | 2.5 | 3007 | |
| 2.159 | 666.7 | 2.5 | 2789 | |
| 1.235 | 1594 | 1.3 | 3449 | |
| 1.662 | 1024 | 1.3 | 3413 | |
| 2.159 | 666.7 | 1.3 | 3345 | |
| 3.55 | 280.9 | 1.7 | 3509 | |
| 4.493 | 179.7 | 1.7 | 3111 | |
| 5.731 | 115.0 | 1.9 | 1038 | |
| 7.872 | 64.13 | 2 | 509 | |
| 23.68 | 7.14 | 6 | 166 |
| Fraction | LMC | SMC |
|---|---|---|
| Oe/O | ||
| (Oe+“phot Oe”)/O | ||
| Be/early-B | ||
| (Be+“phot Be”)/early-B |