Jammed Particle Configurations and Dynamics in High-Density Lennard-Jones Binary Mixtures in Two Dimensions
Abstract
We examine the changeover in the particle configurations and the dynamics in dense Lennard-Jones binary mixtures composed of small and large particles. By varying the composition at a low temperature, we realize crystal with defects, polycrystal with small grains, and glass with various degrees of disorder. In particular, we show configurations where small crystalline regions composed of the majority species are enclosed by percolated amorphous layers composed of the two species. We visualize the dynamics of configuration changes using the method of bond breakage and following the particle displacements. In quiescent jammed states, the dynamics is severely slowed down and is highly heterogeneous at any compositions. In shear, plastic deformations multiply occur in relatively fragile regions, growing into large-scale shear bands where the strain is highly localized. Such bands appear on short time scales and change on long time scales with finite life times.
1 Introduction
Binary particle systems with size dispersity exhibit complicated phase behavior depending on the temperature , the average number density , and the composition [1, 2, 3, 4, 5, 6]. Here and are the numbers of the small and large particles in a volume , respectively. At high densities, the particle configurations sensitively depend on the size ratio between the diameters of the two species, and . If is close to unity at large and at low , a crystal state is realized with a small number of defects. However, if considerably deviates from unity, crystal states are realized only for very small or . For not small and , polycrystal and glass states emerge without long-range crystalline order at low . It is then of great interest how the particle configurations and the dynamics change with varying the composition at considerably large size dispersity. As the glass transition is approached, the structural relaxation time grows dramatically from a microscopic to macroscopic time, while the particle configurations remain random yielding the structure factors similar to those in liquid.
The dynamics of supercooled liquid and glass have been studied extensively using molecular dynamics simulations (MD). As a marked feature, the glass dynamics is highly heterogeneous [7, 8, 9, 10, 11, 12, 13, 15, 14, 16]. In particular, Yamamoto and one of the present authors [10] examined breakage of appropriately defined bonds. The broken bonds accumulated in long time intervals are analogous to the critical fluctuations in Ising systems such that their structure factor may be fitted to the Ornstein-Zernike form,
| (1) |
in two dimensions (2D) and in three dimensions (3D). The wave number is smaller than the inverse particle size. The correlation length can thus be determined, which grows with lowering . Bond breakage events tend to take place repeatedly in relatively fragile regions, leading to aggregation of broken bonds on long time scales. Kob et al. [11] pointed out relevance of stringlike clusters of mobile particles whose lengths increase at low . In addition, the diffusion constant in glassy materials is strongly affected by the dynamic heterogeneity [17, 18, 19]. Afterwards, some authors have claimed the presence of correlation between the structural heterogeneity in the particle configurations and the dynamic heterogeneity on long time scales [13, 14, 15]. Recently significant heterogeneity has been found in the elastic moduli in glass [20, 21], which is the origin of nonaffine elastic displacements for very small strains.
Glass dynamics under shear flow has also been studied by many authors [22, 23, 24, 25, 26, 27, 29, 28, 30, 31], where the shear rate is a new parameter representing the degree of nonequilibrium. Similar jamming rheology has been found in foam and microemulsion systems, colloid suspensions, and granular materials [32, 33, 34, 35, 36]. In jammed states of molecular glass, each particle undergoes shear-induced configuration changes on the time scale of . At a low temperature , the total rate of the configuration change is given by [22, 23]
| (2) |
In the right hand side, the first term is the thermal activation rate and the second one is the shear-induced rate, where the coefficient is of order unity. The steady-state viscosity is proportional to . The following dynamic scaling relation for the correlation length was in accord with the simulation [10, 22]:
| (3) |
including the sheared case. The dynamic exponent was estimated as in 2D and in 3D. In glass a Weissenberg number may be defined by
| (4) |
A nonlinear response regime emerges for Wi. Around the glass transition, grows and the regime Wi is realized even for extremely small shear, where the configuration change is mostly induced by shear and . Indeed in this condition, shear-thinning behavior was measured in glass under uniaxial stress [37, 38]. Also for near-critical and complex fluids, the criterion of nonlinear shear effects is given by Wi with an appropriate long relaxation time [39]. Moreover, a number of MD simulations of sheared glass have realized self-organization of “shear bands” with high strain localization extending througout the system. In simple shear flow such bands are nearly along the flow or the velocity-gradient direction [25, 29, 30, 31], while under uniaxial stress they make an angle of with respect to the uniaxial axis [40, 42, 41, 43, 44]. In metallurgy, shear bands have been observed in amorphous solids under uniaxial stretching or compression above a yield stress [47, 46, 45].
Plastic deformations in crystal and polycrystal are extremely complex and are still poorly understood despite their extensive research [48, 49, 50, 51, 52, 54, 53, 55, 56]. In crystal with low-density defects, dislocation motions play a major role in plasticity, where they yield slip planes with various sizes as observed in acoustic emission experiments [49] and by transmission electron microscopy [50]. In polycrystal, the particles in the vicinity of grain boundaries are relatively mobile compared to those within the grains, so their collective motions give rise to sliding of the grain boundaries under applied stress [54, 55, 56]. In these systems, plastic events take place as bursts or avalanches spanning wide ranges of space and time scales. In this manner, they intermittently release the elastic energy stored in the crystalline regions at high strain. On the other hand, in glass under stress, plastic events have been assumed to be spatially localized due to the structural disorder in glass [57, 58, 59], but our recent 2D simulation has shown that they frequently take place over wide areas in short times [31]. In glass, slip elements (slip lines in 2D) do not much exceed the particle size, but they successively appear in their neigborhood forming large-scale aggregates. When glass rheology is studied in simulation, such avalanches manifest themselves in large stress drops in the stress-strain curve. The irregularity of the average stress versus time has been conspicuous in numerous simulations in the literature, even though the curve should become smoother with increasing the system size. Molecular glassy materials behave as elastic bodies on short time scales with mesoscopically inhomogeneous elastic moduli [20, 21]. Thus large-scale release of the elastic energy at high stress is a common feature of plasticity in crystal, polycystal, and glass.
In this paper, we will investigate the heterogeneity dynamics in high-density and low-temperature 2D model binary mixtures without and with applied shear for various compositions on the basis of our previous work [6, 14, 56]. We are interested in the relationship between the dynamic heterogeneity on long time scales and the structural heterogeneity in the particle configurations. In a separate paper we have examined rheology and plastic deformations on various time scales [31].
The organization of this paper is as follows. In Sec.II, our model and our simulation method will be explained. In Sec.III, numerical results will be presented on the particle configurations and the heterogeneous dynamics for various without shear. In Sec.IV, we will examine the collective dynamics under shear, which are even more heterogeneous than in quiescent states.
2 Background of Simulation
2.1 Model
Our two-dimensional (2D) binary mixtures [6, 14, 56] consist of two species 1 and 2 interacting via truncated Lennard-Jones (LJ) potentials,
| (5) |
which are characterized by the energy and the interaction lengths . The is the particle distance. Hereafter denote the particle positions. The diameters of the two species are and and their ratio is fixed at . For , we set and the constant ensures the continuity of at . The particle number is 9000 and the composition is varied. The system is in the region . The volume is chosen such that the volume fraction of the soft-core regions is fixed as . We integrated the equations of motion using the leapfrog method, where the time step is with
| (6) |
The mass ratio is fixed at . The following data were taken at . The space coordinates and , the time , the shear rate , and the temperature will be measured in units of , , , and , respectively.
There was no tendency of phase separation in our simulation. For the parameters we adopt in this paper, the structural relaxation time without shear is of order in glass, is longer in polycrystal, and tends to infinity in crystal from the decay of the self-time-correlation function [14]. The grain boundary motions are severely slowed down in the presence of large size dispersity, while they move rather fast in one-component systems. Thus is longer in polycrystal than in glass.
2.2 Orientation angle and disorder variable
In the particle configurations at high density, a large fraction of the particles are enclosed by six particles. The local crystalline order may then be represented by a sixfold orientation[60]. We define an orientation angle in the range for each particle using the complex number [6, 14, 56],
| (7) |
where the summation is over the “bonded” particle satisfying . The is the angle of the relative vector with respect to the axis.
We also introduce another non-negative-definite variable, called the disorder variable, which represents the degree of the deviation from the hexagonal order for each particles by
| (8) |
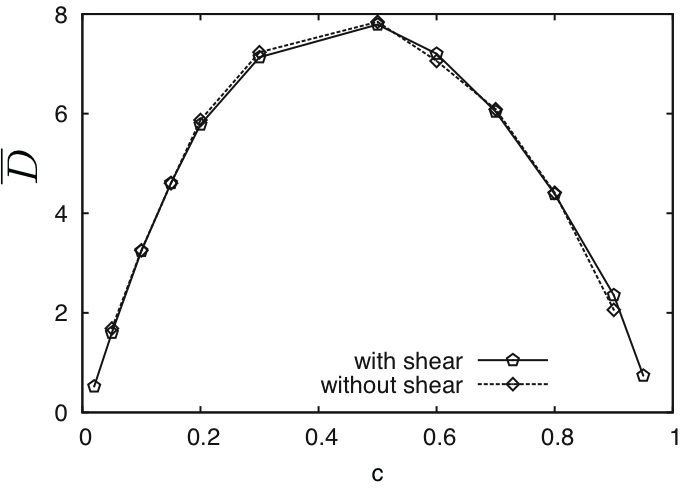
Here are in the range 15-20 for particles around defects, while for a perfect crystal at low . The degree of the overall disorder may be represented by the average over the particles[6],
| (9) |
which is large in glass and liquid and is small in crystal. In Fig. 1, we show the average versus at without shear and with shear , where the two curves nearly coincide. For this shear rate (much smaller than the molecular frequency ), there is no proliferation of defects induced by shear, while the defect structure is continuously deformed by shear. The maximum of is attained at . See Figs. 8 and 9 of Ref. 6 for as a function of and .
The angle variable was originally introduced to study the thermal fluctuations of the hexagonal lattice structure around the melting transition in 2D [60]. We have recently studied 2D melting numerically with the aid of visualization of and [61], where polycrystalline patterns are apparent at the melting not in accord with the original theory [60] (see the end of the last section for more discussions).
2.3 Bond breakage
The jamming dynamics can be conveniently visualized if use is made of the bond breakage [10, 22]. For each particle configuration at a time , a pair of particles and is considered to be bonded if
| (10) |
where . We set ; then, is slightly larger than the peak distance of the pair correlation functions . After a time interval , the bond is regarded to be broken if
| (11) |
where we set . In the following figures, bonds broken during a time interval will be marked by at the middle point of the two particle positions at the terminal time . The structure factor of these middle points is written as in Eq.(1).
In the original simulation using the soft-core potential[10, 22], the bond breakage rate was , where is the decay time of the self-correlation function and behaves as in Eq.(2) in shear. The represents the average bond life time and the broken bond number of the whole system is of order in time interval . For Wi, the bond breakage is mostly induced by shear and the time average of the broken bond number per particle is of the order of the average strain in the plastic flow regime. Around this mean value, increases significantly on occurrences of large-scale plastic events and decreases in “elastic periods” without them [31].
2.4 Averaged velocity
Shear bands have been observed widely in complex fluids, glassy fluids, and granular materials. To examine such strain localization in shear flow, we may introduce an averaged velocity as follows [31]. We first integrate the component of the momentum density in the flow direction:
| (12) |
We next smooth over space and time intervals with widths and as
| (13) |
where is the average mass density. We fix at . However, we choose depending on the time scale of plastic events under consideration. This is because of the hierarchical dynamics of plastic deformations.
3 Numerical results in quiescent states
Without applied shear, we first integrated the equations of motion under the periodic boundary conditions in the and directions. We equilibrated the system at for a time interval of until no appreciable time evolution was detected in various thermodynamic quantities. At this time we will set . We attached a Nosè-Hoover thermostat [62, 63] to all the particles, which then obeyed
| (14) |
where , , and is the total potential. The thermostat variable obeyed
| (15) |
where is the thermostat characteristic time. We set .
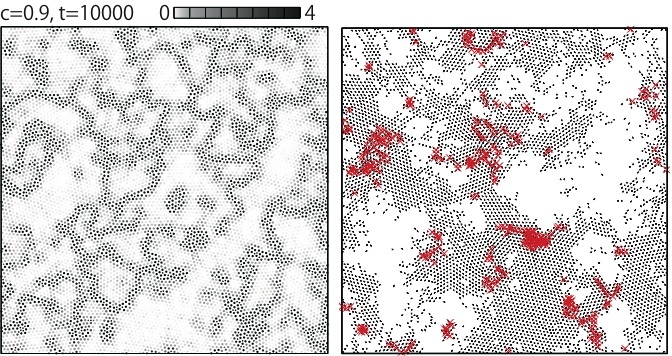
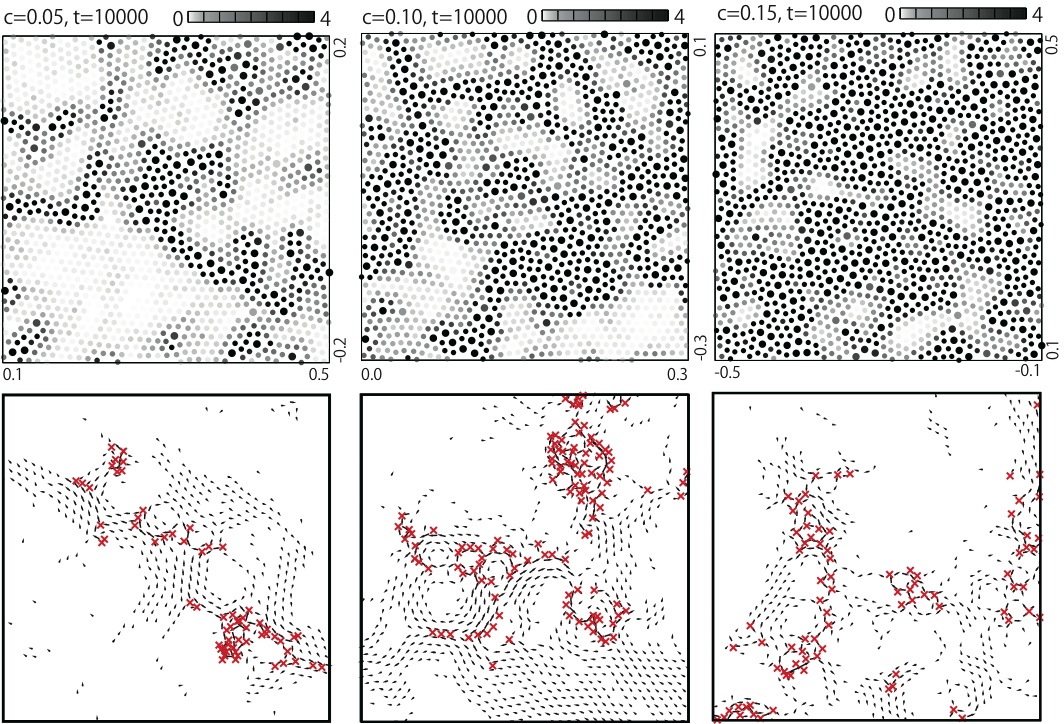
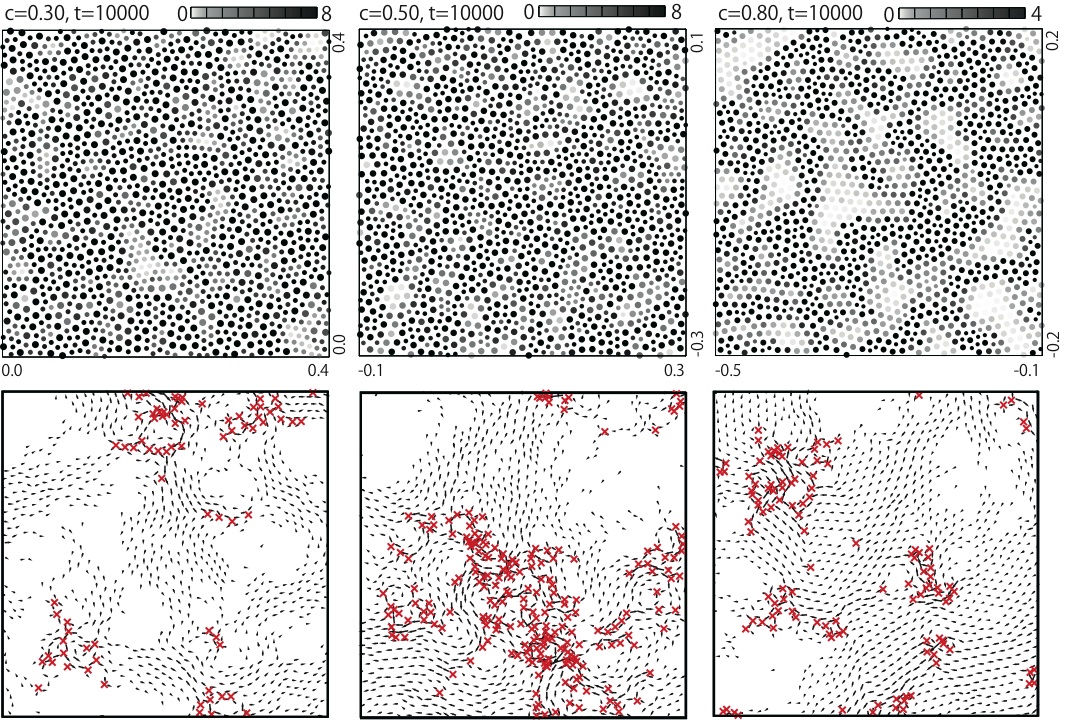
By varying in the range at , Hamanaka and one of the present authors [6, 14] realized crystal states with small numbers of defects for , polycrystal states with the large particles forming grain boundaries for , and glass states for larger . For , the system is divided into small crystalline domains composed of the small particles and percolated amorphous regions composed of the small and large particles. The areal fraction of the amorphous regions increases with increasing . See Fig. 2 of Ref.14 for the particle configurations for various at , where a crystal state was realized for with large particles being distributed as point defects.
In this work, we carried out many simulation runs also for . For not very small or , the system is divided into crystalline regions composed of the large particles and amorphpus layers composed of the two species. The areal fraction of the layers is decreased for relatively small or . Figure 2 provides such an example for , where we display at in the left and the broken bonds and the displacement vectors
| (16) |
in the time interval with width in the right. In writing the displacements we pick up only mobile particles with . At this composition percolation of the amorphous layers is attained. However, for , the layers are broken into isolated clusters with various sizes, resulting in a crystal state with point defects (not shown here). In Fig. 2, the broken bonds are mostly created by the particle motions in the layers and are heterogeneously distributed. We also find coherent motions of crystalline domains surrounded by broken bonds at their grain boundaries. See the middle part at the bottom in the two panels for such an example. The patterns should be isotropic under the periodic boundary condition (on the average of many runs). Next, in Figs. 3 and 4, we show the same quantities for , , , , , and to illustrate the crossover with increasing . The system is in a well-defined polycrystal state for and is highly disordered for and 0.5. The structural heterogeneity in and the dynamical one in the broken bonds and the displacements are both conspicuous for any . Their correlation is obviously seen in the presence of small crystalline regions. This was illustrated in Ref. 14 in more expanded snapshots including the elusive case of glass.
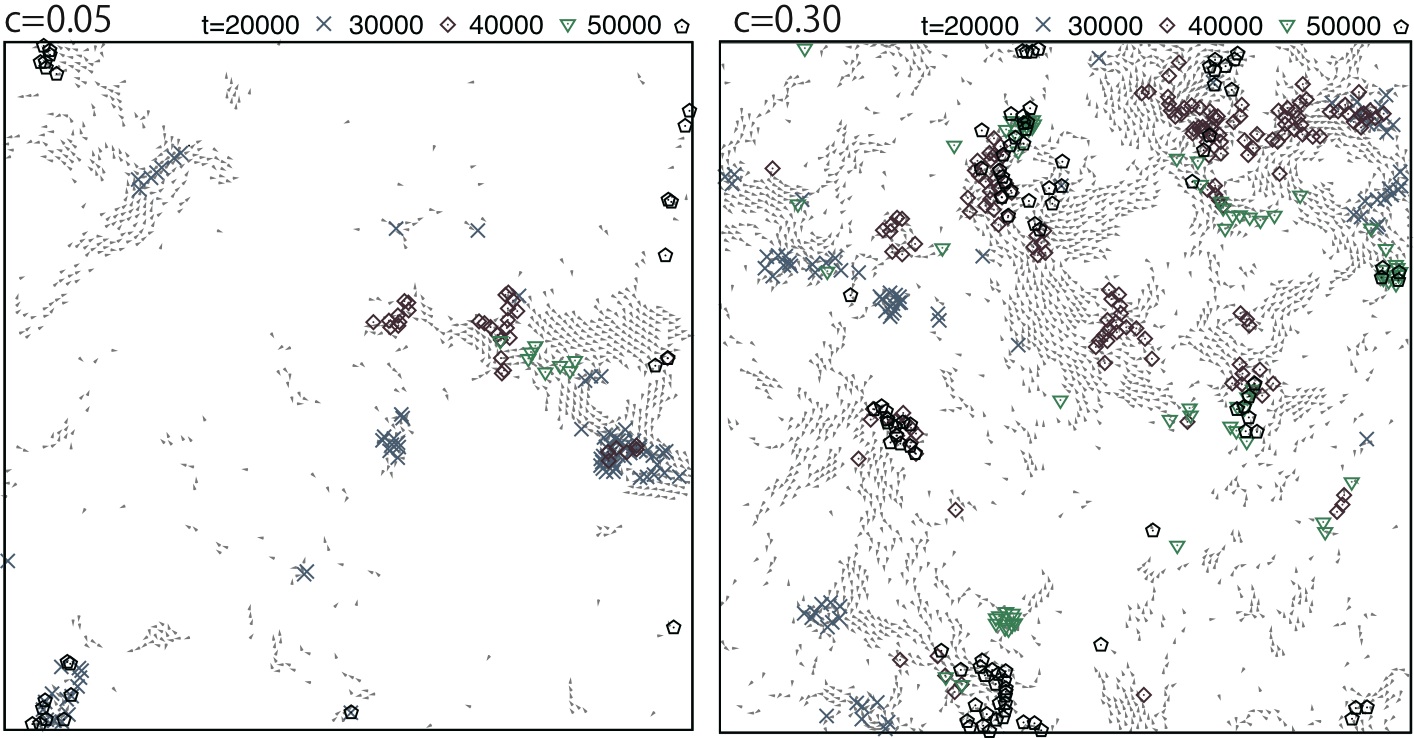
Furthermore, in Fig. 5, we show time evolution of the broken bond distributions in four consecutive time intervals with width in polycrystal at and in glass at . The structural relaxation time is of order at and at [6]. Here the clusters of the broken bonds mostly overlap or are adjacent to each other, resulting in aggregations of the broken bonds. Similar figures illustrating the heterogeneity evolution can be found in other papers also [10, 22, 12, 16].
4 Numerical results at
We applied a simple shear flow with shear rate . To this end, we divided the system into three regions [56, 31]. In the bulk region , we initially placed particles with . We added two boundary layers in the region at the bottom and in the region at the top. In each layer, particles with the same composition and size ratio were initially placed. They were attached to the layer by the spring potential,
| (17) |
where are pinning points in the boundary layers dependent on . The spring constant was set equal to . These bound particles also interacted with the neighboring bound and unbound particles with the common Lennard-Jones potentials in Eq. (5). The component of was moved as
| (18) |
We imposed the periodic boundary condition in the direction. When (or ) in the integration, was decreased (or increased) by . The unbound particles rarely penetrated into the boundary layers deeper than .
The unbound particles in the bulk regions obeyed the Newtonian equations of motion without thermostat. However, a Nosè-Hoover thermostat [62, 63] was attached
to each boundary layer independently. That is, the bound particles were governed by
| (19) |
where denotes the top or the bottom. The boundary velocity is at the top and at the bottom, where is the unit vector along the axis. For the boundary speed () is much slower than the thermal velocity (). The two thermostat parameters, at the bottom and at the top, obeyed
| (20) |
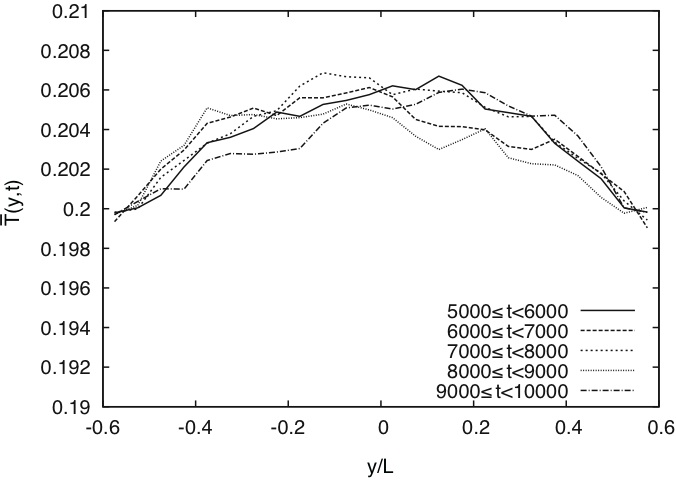
We set and . For , the local temperature was nearly homogeneous in the bulk region during plastic flow, as demonstrated in Fig. 6 for . Setting and , we define the averaged temperature by
| (21) |
where is the kinetic energy density.
We prepared the initial states as follows. First, we equilibrated the bulk and boundary regions independently without their mutual interactions. The particles in these regions interacted via the LJ potentials in Eq.(5) in a liquid state at in a time interval of under the periodic boundary condition along the and axes. Second, we quenched the system to and further equilibrated it for a time interval of . Afterwards, we chose the particle positions in the boundary layers as the initial pinning points and introduced the spring potential of the bound particles and the LJ potentials between the bound and unbound particles. Third, we further waited for time interval of until we detected no appreciable time evolution in various quantities. After this second low-temperature equilibration, we applied a shear flow with rate by sliding the pinning positions in the boundary layers with velocities . We set at the application of shear.
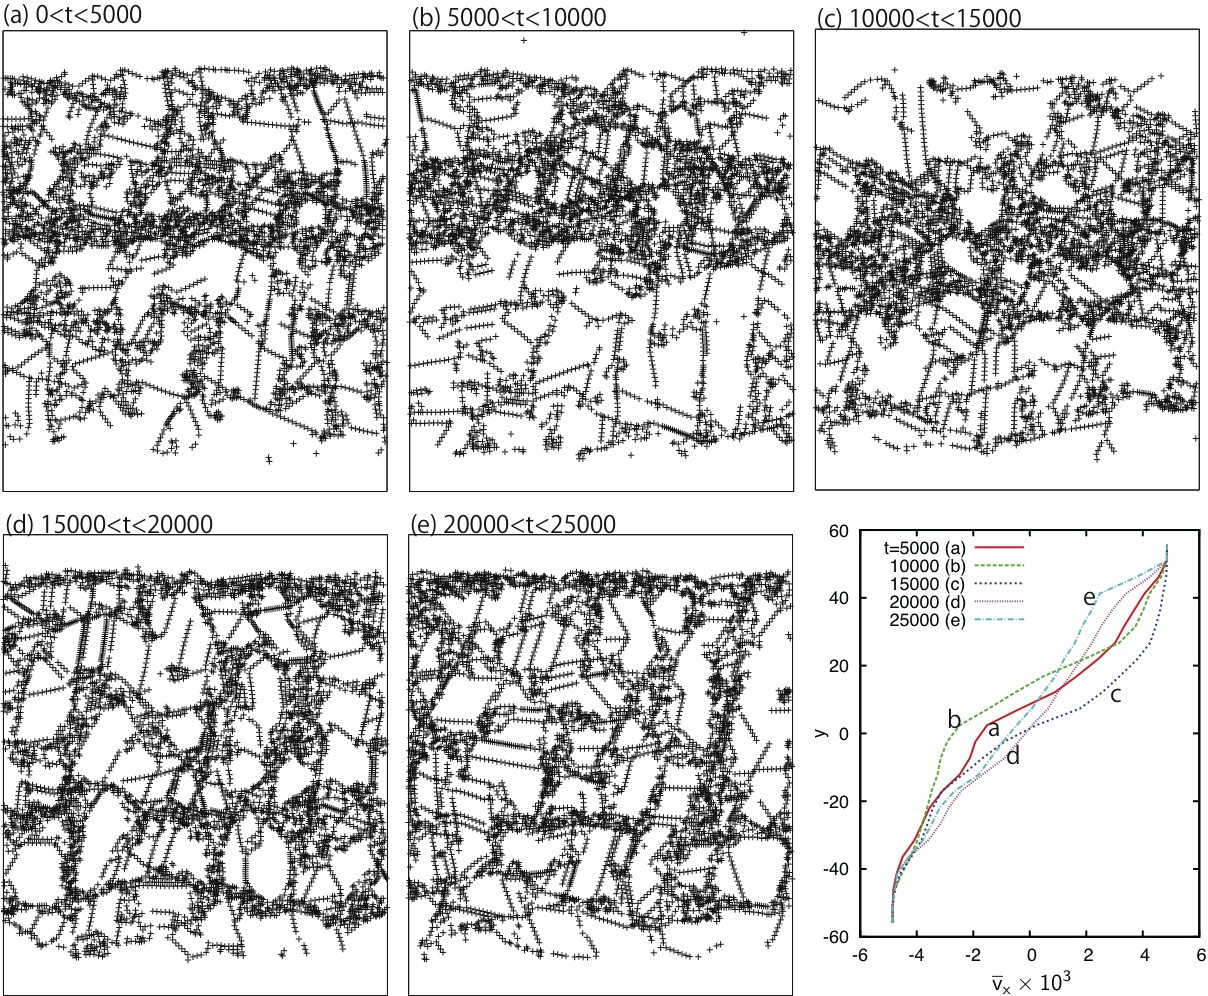
In Fig. 7, we show the broken bonds in five consecutive time intervals with width in polycrystal at . Lines of the broken bonds represent plastic events created by dislocation gliding [48] or grain boundary sliding [54]. The former deformation mode is dominant at this small , while the latter becomes increasing important with increasing [31, 54]. We can see that most of the slip lines are nearly parallel to the or axis. This is because the elastic energy of a slip is minimum in these directions in simple shear strain [44]. In the first three time intervals a thick band region extends over the system along the axis in the upper part, but in the last two time intervals such large-scale bands are nonexistent. The right bottom panel displays the average velocity defined in Eqs. (12) and (13) with , where the first three curves largely deviate from the linear profile but the last two curves are nearly linear.
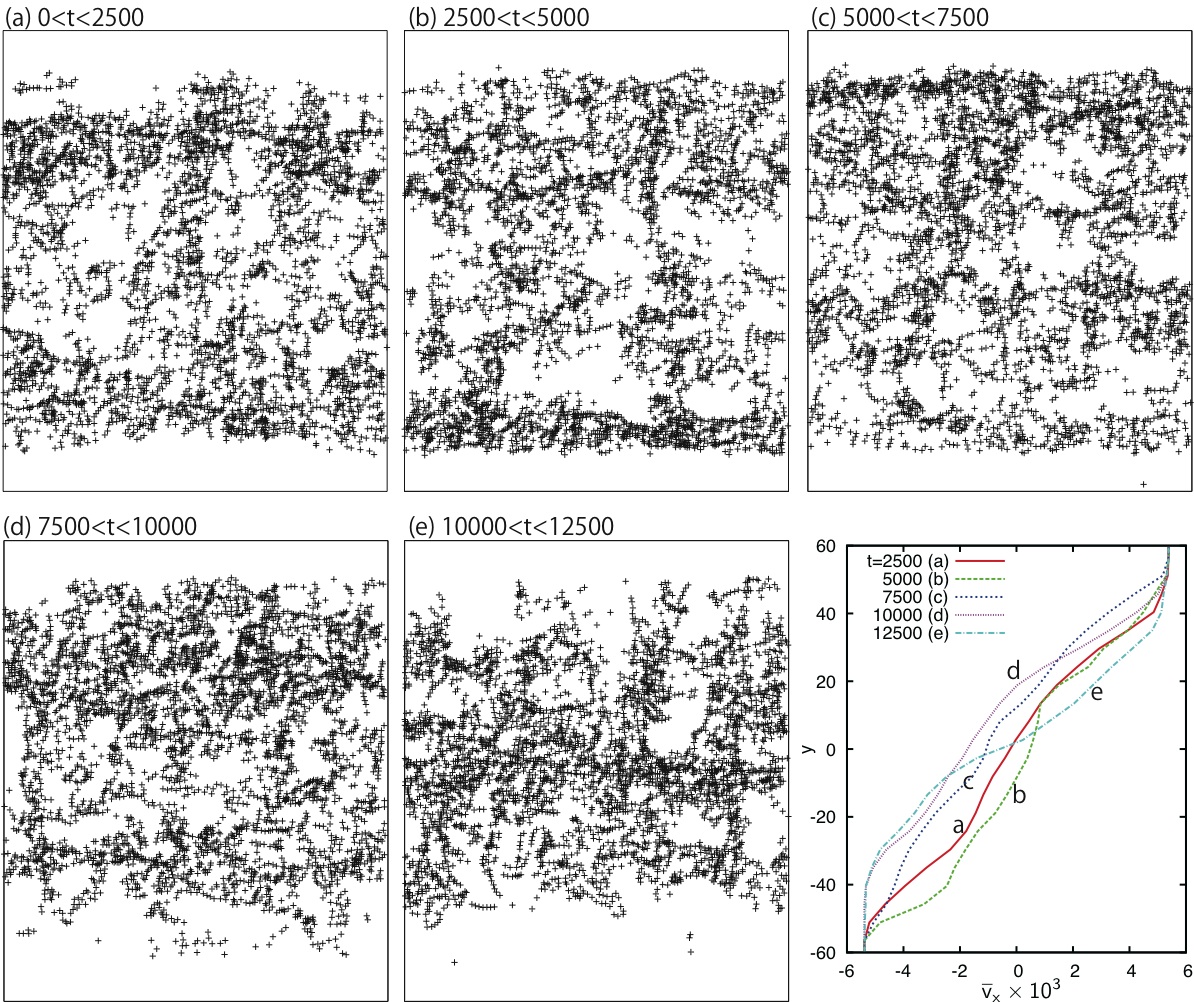
In Fig. 8, we show the same quantities in five consecutive time intervals with width in glass at . Also in this case, the plastic deformations are highly heterogeneous, which still tend to be nearly parallel to the or axis. The chains of the broken bonds are shorter than in Fig. 7. That is, the slip lines do not much exceed the molecular size and the broken bonds are more randomly scattered than in polycrystal. As a result, the deviation of the averaged velocity from the linear form becomes small for , while it is large for (see Fig. 9). In their long time simulation of sheared 2D glass, Furukawa et al.[30] realized transient shear bands equally in the flow and velocity-gradient directions with the Lees-Edwards boundary condition, while those parallel to the axis more easily extend upto the system length in our simulation with the boundary layers.
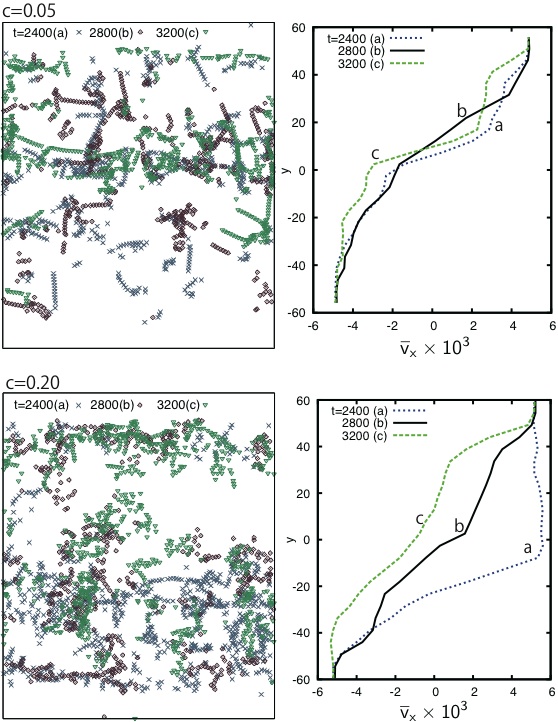
Figure 9 illustrates the time-evolution of the dynamic heterogeneity in three consecutive time intervals with width in polycrystal at and in glass at . We display the broken bonds in the left panels and the averaged velocity in the right panels. The width here is made much shorter than in Figs. 7 and 8 to analyze the early stage of plastic deformations. Note that the transverse sound velocity is of order 5 (in units of ) and the acoustic traversal time is of order 20 in our system. (Plastic deformation dynamics on shoter time scales has been analyzed in our previous work [31].) In the upper panels at , large-scale plastic deformations multiply occur in the same area, which extends over the system to form a shear band. On the other hand, in the lower panels at , a large shear band is seen in the lower part in the first time interval, but large plastic deformations occur in the vertical direction in the second time interval and in the upper part in the horizontal direction in the third time interval. The life time of the shear bands is shorter in glass than in polycrystal [31]. In addition, the broken bond numbers in the whole system are 649, 551, and 614 for and are 870, 589, and 761 for in these time intervals in the chronological order. The time average of is of order here), which should be the case for any as discussed at the end of Subsec.2.3 [31].
5 Summary and remarks
We have examined the jammed particle configurations and the dynamic heterogeneity in 2D. Visualization of the disorder variable gives information of the structural heterogeneity, while that of the bond breakage and the particle displacements discloses the presence of the dynamic heterogeneity. We have varied the composition for and . Summarizing our main results, we give some remarks below.
The particle configurations are unique in polycrystal and glass which are realized for not very small or in our 2D model system. As in Figs. 2-4, small crystalline regions composed of one species of the particles are enclosed by percolated amorphous regions composed of the two species, where the amorphous regions form layers for relatively small or . For very small or (not shown in this work), the layers break into small pieces to form a crystal with point defects. In rheology, these amorphous layers can serve as a lubricant in plastic flow [31], within which the bond breakage occurs, reducing the viscosity than in crystal states.
In glass without shear, the particle configuration changes are thermally induced in the form of chains of broken bonds [10, 22] or stringlike displacements [11]. They accumulate to form the dynamic heterogeneity on long times characterized by the correlation length in Eq.(1) [10, 31, 16]. In Figs. 2-4, we have added more evidences for these dynamical processes. To show the relationship between the structural and dynamical heterogeneities, we have presented the snapshots of the disorder variable and those of the bond breakage and the displacements (see Fig. 2 in Ref.14 also). In Fig. 5, we have visualized the time evolution of the dynamic heterogeneity on the time scale of , which demonstrates correlated occurrences of mesoscopic structural changes. This tendency is related to the mesoscopic heterogeneity in the elastic moduli [20, 21]. In addition, in Fig. 4, the structural relaxation is even slower in polycrystal than in glass, where the particles around the grain boundaries (in the amorphous layers) are relatively mobile than those within the crystalline grains[14].
In shear flow with , we have visualized large-scale heterogeneity in the bond breakage in Figs. 6-8. The averaged velocity deviates from the linear profile with formation of shear bands. Here for in Fig. 7, for in Fig. 8, and for and in Fig. 9. These figures illustrate how the plastic deformations under shear evolve on various time scales. For any , plastic deformations extend over longer distances nearly in the or axis as in Fig. 9. Such plastic events often accumulate to form transient shear bands as in Figs. 7-8. They occur to release the elastic energy at high strain as discussed in Sec.I. See Refs. 27 and 28 for more discussions on the anisotropic, hierarchical dynamics under shear. In the early work by Yamamoto and one of the present authors[22], the shear-induced structural change was analyzed on the basis of Eq.(2) and the broken-bond structure factor in Eq.(1) was calculated for without and with shear, but the shear band formation on large scales was beyond its scope.
A variety of complex problems of binary particle systems remain mostly unexplored. We mention some of them. (i) When the size ratio is increased from unity, intriguing crossovers are expected in the particle configurations and the dynamics. For example, at , proliferation of defects occurs abruptly around [6, 14]. (ii) Furthermore, with changing the pair potentials, tendency to phase sparation can be enhanced, where small crystalline regions should become more disinct or nucleation of crystal domains should become realizable in an amorphous matrix. (iii) Some essential aspects of the glass problem should be common in 2D and 3D. However, in 3D, the problem is much more complicated and visualization of configuration changes is more difficult. We have not yet understood the differences in 2D and 3D in depth. (iv) In addition, the melting and crystallization in binary mixtures have not yet been well investigated, where essentially different pictures arise in 2D and 3D. We have recently recognized surprising complexity of the 2D melting even in one component systems[61]. That is, marked heterogeneities emerge both in the structural disorder and in the dynamics in the hexatic phase [60], where mesoscopic liquidlike and crystalline regions coexist as thermal fluctuations without distinct interfaces. Understanding the dynamics of 2D melting is still at the beginning despite numerous papers on static properties.
Acknowledgements
The authors would like to thank Akira Furukawa and Ryoichi Yamamoto for valuable discussions. Some of the numerical calculations were carried out on Altix 3700B at ISSP Supercomputer Center, Univ. of Tokyo. This work was supported by Grants-in-Aid for scientific research on Priority Area “Soft Matter Physics” and the Global COE program “The Next Generation of Physics, Spun from Universality and Emergence” of Kyoto University from the Ministry of Education, Culture, Sports, Science and Technology of Japan.
References
- [1] E. Dickinson and R. Parker, Chem. Phys. Lett. 79 (1981), 578.
- [2] L. Bocquet, J.P. Hansen, T. Biben, and P. Madden, J. Phys.: Condens. Matter 4 (1992), 2375.
- [3] C.N. Likos and C.L. Henry, Phil. Mag. B 68 (1993), 85.
-
[4]
W. Vermlen and N. Ito,
Phys. Rev. E 51 (1995), 4325.
H. Watanabe, S. Yukawa, and N. Ito, Phys. Rev. E 71 (2005), 016702. - [5] M. R. Sadr-Lahijany, P. Ray, and H. E. Stanley, Phys. Rev. Lett. 79 (1997), 3206.
- [6] T. Hamanaka and A. Onuki, Phys. Rev. E 74 (2006), 011506.
- [7] K. Maeda and S. Takeuchi, Phys. Stat. Sol. 49 (1978), 685.
- [8] T. Muranaka and Y. Hiwatari, Phys. Rev. E 51 (1995), 2735(R).
- [9] M. M. Hurley and P. Harrowell, Phys. Rev. E 52 (1995), 1694.
- [10] R. Yamamoto and A. Onuki, J. Phys. Soc. Jpn., 66 (1997) ,2545.
- [11] W. Kob, C. Donati, S. J. Plimton, P. H. Poole, and S. C. Glotzer, Phys. Rev. Lett. 79 (1997), 2827.
- [12] B. Doliwa and A. Heuer, J. Non-Cryst. Solids 307-310 (2002), 32.
- [13] A. Widmer-Cooper and P. Harrowell, Phys. Rev. Lett. 96 (2006), 185701.
- [14] T. Hamanaka and A. Onuki, Phys. Rev. E 75 (2007), 041503.
- [15] T. Kawasaki, T. Araki, and H. Tanaka, Phys. Rev. Lett. 99 (2007), 215701.
- [16] R. Candelier, A. Widmer-Cooper, J. K. Kummerfeld, O. Dauchot, G. Biroli, P. Harrowell, and D.R. Reichman, arXiv.org, cond-mat, arXiv:0912.0193.
- [17] H. Sillescu, J. Non-Cryst. Solids 243, 81 (1999).
- [18] M. D. Ediger, Annu. Rev. Phys. Chem. 51, 99 (2000).
- [19] R. Yamamoto and A. Onuki, Phys. Rev. Lett. 81 (1998), 4915.
- [20] K. Yoshimoto, T. S. Jain, K. Van Workum, P. F. Nealey, and J. J. de Pablo, Phys. Rev. Lett. 93 (2004), 175501.
- [21] M. Tsamados, A. Tanguy, C. Goldenberg, and J.-L. Barrat, Phys. Rev. E 80 (2009), 026112.
- [22] R. Yamamoto and A. Onuki, Europhys. Lett. 40 (1997), 61; Phys. Rev. E 58 (1998), 3515; J. Phys. Condens. Matter 29 (2000), 6323.
- [23] L. Angelani, G. Ruocco, F. Sciortino, P. Tartaglia, and F. Zamponi, Phys. Rev. E 66 (2002), 061505.
-
[24]
M. Fuchs and M. E. Cates,
Phys. Rev. Lett. 89 (2002), 248304.
K. Miyazaki, D.R. Reichman, Phys. Rev. E 66 (2002), 050501(R). - [25] F. Varnik, L. Bocquet, J.-L. Barrat, and L. Berthier, Phys. Rev. Lett. 90 (2003), 095702.
- [26] L. Berthier, J. Phys. Condens. Matter 15, S933 (2003).
- [27] A. Tanguy, F. Leonforte, and J.-L. Barrat, Eur. Phys. J. E 20 (2006), 355.
- [28] A. Lemaitre and C. Caroli, Phys. Rev. E 76 (2007), 036104.
- [29] Y. Shi, M. B. Katz, H. Li, and M. L. Falk, Phys. Rev. Lett. 98 (2007), 185505.
- [30] A. Furukawa, K. Kim, S. Saito, and H. Tanaka, Phys. Rev. Lett. 102, 016001 (2009).
- [31] H. Shiba and A. Onuki, arXiv.org, cond-mat, arXiv:0911.4922.
- [32] T. Okuzono and K. Kawasaki, Phys. Rev. E 51 (1995), 1246.
-
[33]
D.J. Durian,
Phys. Rev. E 55 (1997), 1739.
S. A. Langer and A. J. Liu, J. Phys. Chem. B 101 (1997), 8667. - [34] B. Miller, C.O’Hern and R.P. Behringer, Phys. Rev. Lett. 77 (1996), 3110.
- [35] O. Dauchot, G. Marty, and G. Biroli, Phys. Rev. Lett. 95 (2005), 265701.
-
[36]
P. Olsson and S. Teitel,
Phys. Rev. Lett. 99 (2007), 178001.
T. Hatano, Phys. Rev. E 79 (2009), 050301(R). - [37] J.H. Li and D.R. Uhlmann, J. Non-Cryst. Solids 3 (1970), 127.
- [38] J.H. Simmons, R.K. Mohr, and C.J. Montrose, J. Appl. Phys. 53 (1982), 4075.
- [39] A. Onuki, J. Phys. C 9 (1997), 6119.
- [40] Y. Shi and M. L. Falk, Phys. Rev. B 73 (2006), 214201.
- [41] C. E. Maloney and M. O. Robbins, J. Phys.: Condens. Matter 20 (2008), 244128.
- [42] N. P. Bailey, J. Schitz, and K. W. Jacobsen, Phys. Rev. B 73 (2006), 064108.
- [43] V.V. Bulatov and A.S. Argon, Model. Simul. Mater. Sci. Eng. 2 (1994), 167.
- [44] A. Onuki, Phys. Rev. E 68 (2003), 061502.
- [45] Jing Li, F. Spaepen and T.C. Hufnagel, Phil. Mag. A 82 (2002), 2623.
- [46] Q. Wei, D. Jia, K. T. Ramesh, and E. Ma Appl. Phys. Lett. 81 (2002), 1240.
- [47] C. A. Schuh, T. C. Hufnagel , and U. Ramamurty Acta Materialia 55 (2007), 4067.
- [48] J. Friedel, Dislocations (Pergamon, New York, 1954).
-
[49]
M.-C. Miguel, A. Vespignani, S. Zapperi,
J. Weiss, and Jean-Robert Grassok,
Nature 410 (2001), 667.
M. Zaiser, Adv. Phys. 55, 185 (2006). - [50] D. M. Dimiduk, C. Woodward, R. LeSar, and M. D. Uchic, Science 312 (2006), 1188.
-
[51]
B. Devincre and L. P. Kubin
Mater. Sci. Eng. A 234-236 (1997), 8.
V. Bulatov, F. F. Abraham, L. Kubin, B. Devincre and S. Yip, Nature 391 (1998), 669. - [52] A. Minami and A. Onuki, Phys. Rev. B 70 (2004), 184114; Acta Mater. 55 (2007), 2375.
- [53] V. Yamakov, D. Wolf, S. R. Phillpot, A. K. Mukherjee, and H. Gleiter, Nature Materials 3 (2004), 43.
- [54] S. Yip, Nature Mater. 3 (2004), 11.
- [55] H. Zhang, D. J. Srolovitz, J. F. Douglas, and J. A. Warren, Phys. Rev. B 74 (2006), 115404.
- [56] T. Hamanaka, H. Shiba, and A. Onuki, Phys. Rev. E 77 (2008), 042501.
- [57] F. Spaepen, Acta Metall. 25 (1977), 407.
- [58] A.S. Argon, Acta Metall. 27 (1979), 47.
- [59] M. L. Manning, J. S. Langer, and J. M. Carlson, Phys. Rev. E 76 (2007), 056106.
- [60] B.I. Halperin and D. R. Nelson, Phys. Rev. Lett. 41 (1978), 121.
- [61] H. Shiba, A. Onuki and T. Araki, EPL 86 (2009), 66004.
- [62] S. Nosè, Prog. Theor. Phys. Suppl. 103 (1991), 1.
- [63] W.G. Hoover, Computational Statistical Mechanics, (Elsevier, Amsterdam,1991).