Two types of Lyman-alpha emitters envisaged from hierarchical galaxy formation
Abstract
In the last decade, numerous Lyman-alpha emitters (LAEs) have been discovered with narrow-band filters at various redshifts. Recently, multi-wavelength observations of LAEs have been performed and revealed that while many LAEs appear to be young and less massive, a noticeable fraction of LAEs possess much older populations of stars and larger stellar mass. How these two classes of LAEs are concordant with the hierarchical galaxy formation scenario has not been understood clearly so far. In this paper, we model LAEs by three-dimensional cosmological simulations of dark halo merger in a CDM universe. As a result, it is shown that the age of simulated LAEs can spread over a wide range from yr to yr. Also, we find that there are two types of LAEs, in one of which the young half-mass age is comparable to the mean age of stellar component, and in the other of which the young half-mass age is appreciably shorter than the mean age. We define the former as Type 1 LAEs and the latter as Type 2 LAEs. A Type 1 LAE corresponds to early starburst in a young galaxy, whereas a Type 2 LAE does to delayed starburst in an evolved galaxy, as a consequence of delayed accretion of a subhalo onto a larger parent halo. Thus, the same halo can experience a Type 2 LAE-phase as well as a Type 1 LAE-phase in the merger history. Type 1 LAEs are expected to be younger than yr, less dusty, and less massive with stellar mass , while Type 2 LAEs are older than yr, even dustier, and as massive as . The fraction of Type 2s in all LAEs is a function of redshift, which is less than 2 percent at , 30 percent at redshift , and 70 percent at . Type 2 LAEs can be discriminated clearly from Type 1s in two color diagram of z’-H vs J-K. We find that the brightness distribution of Ly in Type 2 LAEs is more extended than the main stellar component, in contrast to Type 1 LAEs. This is not only because delayed starbursts tend to occur in the outskirts of a parent galaxy, but also because Ly photons are effectively absorbed by dust in an evolved galaxy. Hence, the extent of Ly emission may be an additional measure to distinguish Type 2 LAEs from Type 1 LAEs. The sizes of Type 2 LAEs range from a few tens to a few hundreds kpc. At lower redshifts, the number of more extended, older Type 2 LAEs increases. Furthermore, it is anticipated that the amplitude of angular correlation function for Type 2 LAEs is significantly higher than that for Type 1 LAEs, but comparable to that for Lyman break galaxies (LBGs). This implies that LBGs with strong Ly line may include Type 2 LAEs.
keywords:
Galaxies – Ly emitters; Galaxies – Formation; Galaxies – Evolution; Galaxies – correlation function1 Introduction
To explore the early evolutionary phases of galaxies is important to understand galaxy formation. Partridge & Peebles. (1967) predicted that the starbursts in primeval galaxies emit significant Ly emission through the recombination of ionized hydrogen in interstellar matter. Although many surveys attempted to discover such Ly emitting galaxies (Ly emitters: hereafter LAEs), but did not succeed to find them for a long time. In late 1990’s, Cowie & Hu (1998) discovered LAEs with narrow-band filters for the first time. Currently, numerous LAEs have been discovered at high redshifts by class telescopes with narrow-band filters (Hu et al., 1998, 1999, 2002; Kodaira et al., 2003; Shimasaku et al., 2003, 2006; Hayashino et al., 2004; Ouchi et al., 2004, 2005; Taniguchi et al., 2005; Matsuda et al., 2004, 2005). Although the number of observed LAEs increases constantly, the nature of LAEs is still veiled. Recently, surveys of LAEs in the various wavelength bands (optical, infrared, sub-mm, etc) have been performed actively (Finkelstein et al., 2007; Lai et al., 2008; Matsuda et al., 2007; Uchimoto et al., 2008; Finkelstein et al., 2009; Tamura et al., 2009), and have revealed that while many LAEs appear to be young and less massive, a noticeable fraction of LAEs possess much older stellar populations and larger stellar mass. We have not well understood how such two classes of LAEs are concordant with the hierarchical galaxy formation scenario. As for the physical origin of Ly emission, the cooling radiation from a primordial collapsing cloud (Haiman, Spaans, & Quataert, 2000; Fardal et al., 2001), from a galactic wind-driven shell (Taniguchi & Shioya, 2000), or from star-forming clouds in a young starburst galaxy (Mori, Umemura, & Ferrara, 2004) has been considered.
Recently, Mori & Umemura (2006) proposed a galaxy evolution scenario from LAEs to LBGs, based on a supernova-dominated starburst galaxy model. In this scenario, LAEs correspond to an early evolutionary phase of yr. Also, Shimizu et al. (2007) have constructed an analytic model of LAEs in a CDM universe, and found that if LAEs form in relatively low density regions of the universe and the duration of starburst is as short as yr, the spatial distributions match the weak angular correlation function of LAEs observed at . The spectral energy distribution (SED) fitting for observed LAEs has shown that LAEs mostly have young average age (yr) and low stellar mass (), and are less dusty or dust free (Gawiser et al., 2006; Finkelstein et al., 2007; Lai et al., 2008). These young LAEs are consistent with the picture by Mori & Umemura (2006) and Shimizu et al. (2007). Very recently, deep surveys of LAEs allow us to study detailed properties of individual LAEs. As a result, it has been revealed that LAEs have a wide range of age (yr), stellar mass (), and dust extinction with up to (Finkelstein et al., 2007; Lai et al., 2008; Finkelstein et al., 2009). LAEs detected in rest-frame optical/near infrared (NIR) bands tend to have older age, larger stellar mass, and stronger dust extinction than LAEs undetected in those bands. Thus, the picture of purely young starburst galaxies are not always reconciled with observed LAEs. So far, the physical reason has not been clarified for the existence of an old, massive, and dusty population of LAEs. The previous study has shown that a starburst-dominated galaxy can emit strong Ly radiation in dust-free or less dusty environments (Mori & Umemura, 2006). However, starburst galaxies cannot be always LAEs in dusty environments (e.g. ultra-luminous infrared galaxies). Hence, what physical state corresponds to an old population of LAEs is an issue of great significance. Some authors argue that the clumpy distributions of dusty gas is important for the transfer of Ly photons (Neufeld., 1991; Hansen & Oh., 2006; Finkelstein et al., 2009). Since Ly photons undergo resonant scatterings on the surface of gas clumps, photons can easily escape from the clumpy media. Such an effect provides the possibility of old, massive and dusty LAEs.
In this paper, we explore how a young and old population of LAEs are concordant with a hierarchical galaxy formation paradigm. For the purpose, we perform tree-dimensional cosmological simulations of dark halo merger in a CDM universe, incorporating the prescriptions of star formation, spectral evolution, and dust extinction. Throughout this paper, we adopt CDM cosmology with the matter density , the cosmological constant , the Hubble constant in units of , the baryon density , and (Spergel et al., 2003).
2 Model and Numerical Method
2.1 Basic Model
To pursue the star formation history in the hierarchical galaxy formation, we simulate the merging history of subgalactic halos (hereafter subhalo) by three-dimensional cosmological -body simulations. Here, each particle is regarded as a subhalo that is supposed to consist of dark matter and baryons. We simulate subhaloes in a comoving volume of . The mass of a subhalo is . It is assumed that the star formation is triggered, when a subhalo accretes onto a parent halo. Then, we trace the stellar evolution separately for individual subhalos using a spectral synthesis code ’PEGASE’ (Fioc & Rocca-Volmerange, 1997). Moreover, we take into account the effect of dust extinction on Ly emission. The present approach allows us to analyze the distributions of star forming regions in a halo, and also the clustering properties of halos.
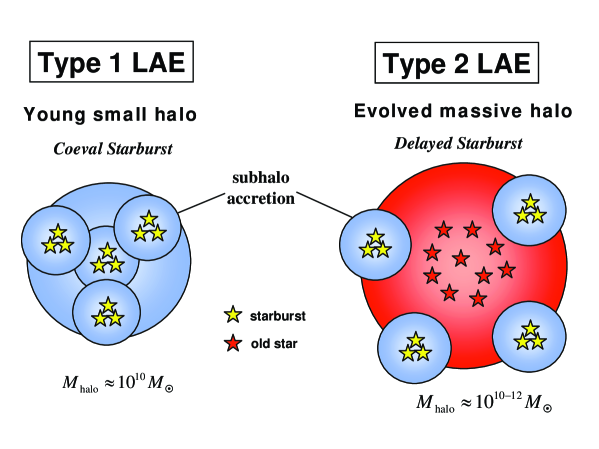
There are basically two types of subhalo accretion. One is the almost contemporaneous accretion of subhaloes in a young small parent halo, and then coeval starbursts take place in the halo. The other is the delayed accretion onto an evolved massive halo, and then a newly-triggered starburst and an old stellar population coexist. Both types have the potentiality of becoming LAEs. If they satisfy LAE conditions (see the detail below), we call the former Type 1 LAEs and the latter Type 2 LAEs. A schematic view of Type 1 and Type 2 LAEs is shown in Fig. 1.
2.2 Numerical Method
We perform a cosmological -body simulation with the particle-particle-particle-mesh () algorithm (Hockney & Eastwood, 1981). The numerical scheme is based on Yoshikawa et al. (2000). The size of comoving simulation box () is set to be the same as the size of LAE survey at by Hayashino et al. (2004), that is, in linear scale. This allows us to adjust LAE conditions by directly comparing with the observation. Here, the periodic boundary condition is imposed. We use the Plummer softening function for gravitational force, with the softening length of ( in a comoving scale).
A parent halo is found using a friends-of-friends algorithm (Davis et al., 1985) with linking length equal to 0.2 of the mean particle separation. In this study, a system with (say, equal to or more than 100 particles) is identified as a parent halo so that the system mass would be corresponding to observed LAEs. As previously mentioned, each particle (subhalo) in a parent halo has individual age. It is assumed that the star formation is triggered, when a subhalo accretes onto a parent halo. The star formation occurs only in the subhalo, and therefore no star formation is triggered at the central of host halo. Also, a subhalo which underwent the star formation once does not trigger the star formation again. Here, the star formation in each subhalo is assumed to occur at the rate as
| (1) |
The star formation timescale is set to match the typical lifetime of young LAEs predicted by Mori & Umemura (2006) and Shimizu et al. (2007), that is, . The efficiency is determined so that the final fraction of stellar mass to total baryonic mass is 10 percent. Here, the Salpeter initial mass function is assumed. In the present model, each particle is supposed to consist of dark matter and baryons. As far as the model LAEs concerned, newly accreted subhalos are predominantly responsible for Lyman alpha emission, and those subhalos emits the bulk of UV photons before their dynamical relaxation. Nonetheless, two-component (dark matter and baryon) simulations are very worth investigating in the future work.
We identify LAEs under the same conditions as Hayashino et al. (2004), that is, and , where and are observed Ly luminosity and Ly equivalent width at rest-frame, respectively. We estimate observed Ly luminosity by
| (2) |
where is intrinsic Ly luminosity, and is the escape fraction of Ly photons. We calculate using ”PEGASE” (Fioc & Rocca-Volmerange, 1997). The escape fraction is evaluated in terms of dust extinction as
| (3) |
where is the line-of-sight optical depth of dust with opacity in proportion to local metallicity. In practice, is dependent on grain size distributions, which are not well known in high- objects. Hence, we normalize the net cross section of dust grains so that the number of simulated LAEs should match the observed number of LAEs at (Hayashino et al., 2004). (In the present analysis, dust is treated as a pure absorber of Ly photons, and the scattering of Ly photons is not solved. The treatment of dust extinction can be more sophisticated in the future analysis.)
3 Results
3.1 Two Types of Simulated LAEs


In Fig. 2, the distributions of mass-weighted age are shown for simulated LAEs. The ages spread widely from yr to yr. Interestingly, a significant number of LAEs are much older than yr that is the lifetime of young LAEs predicted by Mori & Umemura (2006) and Shimizu et al. (2007). As seen in Fig. 2, the distributions are fairly continuous from younger LAEs to older ones. Younger LAEs are early coeval starburst galaxies, while older LAEs result from delayed starbursts triggered by later subhalo accretion onto evolved halos. In order to discriminate delayed starbursts from coeval young starbursts, we plot the young half-mass ages against the mass-weighted mean ages in Fig. 3, where, the young half-mass age is defined as the mass-weighted age of the young half subhalos included in a host halo. If starbursts are coeval in a halo, young half-mass ages should be comparable to mean ages. It is clearly seen in Fig. 3 that in the part older than yr, coeval starbursts disappear and only delayed starbursts appear to be taking place. Hence, in this paper, we define LAEs younger than yr as Type 1 LAEs, and older ones as Type 2 LAEs. It is noted that there is not a clear boundary of two classes at yr, but the transition is actually gradual in the sense that coeval and delayed starbursts are blended around yr. Nevertheless, as shown below, we find distinctive trends in photometric properties between Type 1s and Type 2s defined here.
Fig. 4 shows equivalent width of Ly emission, Ly luminosity, star formation rate, and stellar mass against the mass-weighted age for simulated LAEs. Equivalent width (EW) decreases with ages for Type 1 LAEs, ranging from 40Å to 200Å, although some are at a level of 350-400Å. EW for Type 2s is randomly distributed in the range of 30Å-150Å. Ly luminosity is basically in proportion to star formation rate for Type 1 LAEs, and gradually decreases with ages. For Type 2 LAEs, Ly luminosity randomly spread in the range of to . Interestingly, in old Type 2 LAEs (yr), a high star formation rate does not always lead to high Ly luminosity. This can be understood by the effect of dust extinction as argued below.
The stellar mass of LAEs is a fairly monotonic function of age. Type 1 LAEs are less massive with , while Type 2s are as massive as . Recent observations show that LAEs detected by rest-frame optical/NIR bands are more massive than and pretty older (Finkelstein et al., 2007; Lai et al., 2008; Matsuda et al., 2007; Uchimoto et al., 2008; Finkelstein et al., 2009). Such objects may correspond to Type 2 LAEs.
The fraction of Type 2 LAEs in all LAEs is predicted to be a function of redshift. Fig. 5 represents the Type 2 LAE fraction against redshift. Obviously, the Type 2 fraction increases with decreasing redshift. At , the Type 2 fraction is less than 2 percent, since massive haloes have not grown yet, whereas it is 30 percent at redshift and 70 percent at . This trend is concordant with the recent observations by Nilsson et al. (2009).
3.2 Spectrophotometric Properties of Simulated LAEs
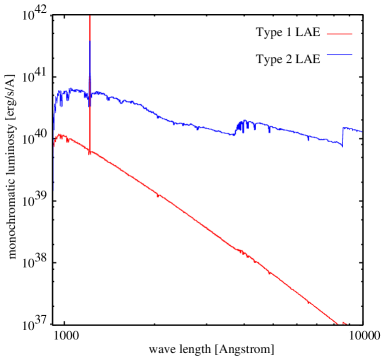
In Fig. 6, we show spectral energy distributions (SEDs) of a typical Type 1 and Type 2 LAE, which are calculated by ”PEGASE” (Fioc & Rocca-Volmerange, 1997). A Type 1 LAE is composed of young stars, while the host galaxy of a Type 2 LAE is dominated by evolved stars, where a distinct 4000 Å break is seen. Accordingly, the colors of two types of LAEs are different.
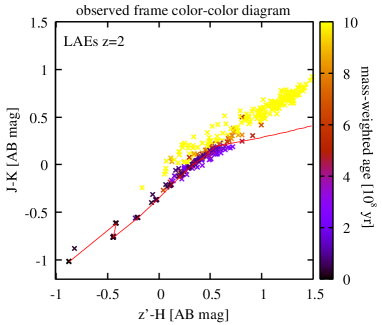
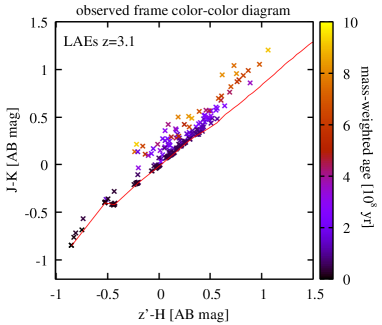
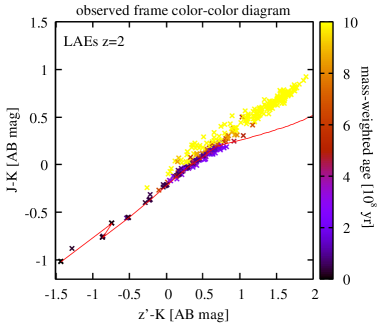
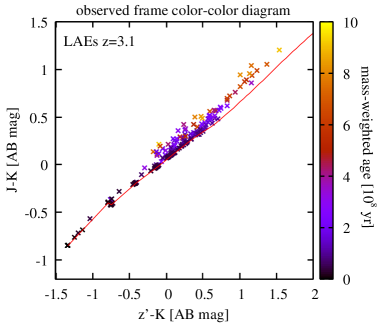
In Fig. 7, two color diagrams are shown in observed frames for LAEs and LAEs. The upper two panels are z’-H vs J-K, while the lower two panels are z’-K vs J-K, where z’-band is 9000Å, J-band 12000Å, H-band 17000Å, and K-band 22000Å. A red line in each panel indicates the evolutionary track of stars born in a single starburst. Therefore, LAEs near this line represent almost coeval starbursts. The mass-weighted ages are shown by colors. As expected, Type 1 LAEs (yr) well follow the single starburst track, whereas colors of Type 2s are a function of redshift. At lower redshifts, Type 2s deviate farther from the single starburst track. Fig. 7 shows that Type 1 and Type 2 LAEs are discriminated more clearly in the diagram of z’-H vs J-K, compared to that of z’-K vs J-K.
3.3 Brightness distribution of a Type 2 LAE
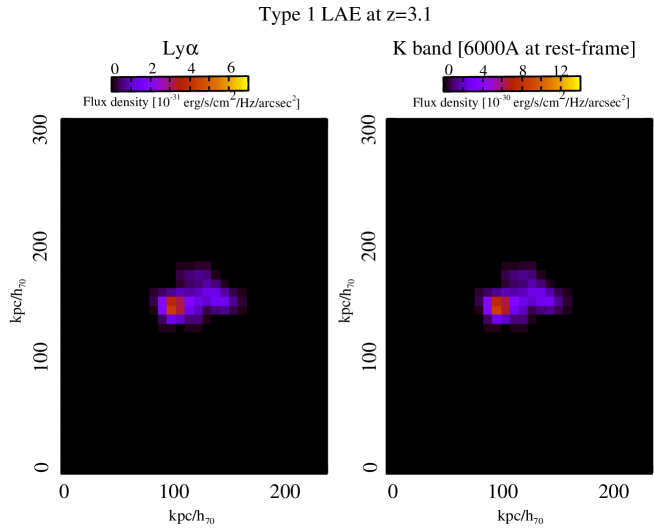
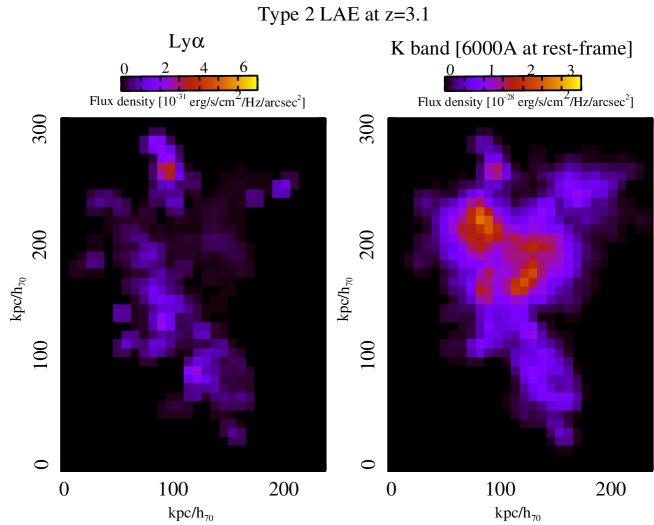

In Fig. 8, the brightness distributions of Ly emission and those at observed-frame K band flux (which corresponds to rest-frame 6000Å flux) are shown for a Type 1 LAE at . The angular resolution (pixel size) is set to be 1 arcsec. The brightness distributions at observed-frame K band flux trace basically stellar mass distribution. As seen in Fig. 8, both distributions are compact (kpc), and the extents are quite similar to each other. In Fig. 9, the brightness distributions are shown for a Type 2 LAE at . The Ly emission is diffusely distributed over kpc or stronger at the outskirts, while the brightness distributions at observed-frame K band flux exhibit a strong contrast and are more concentrated. Moreover, Type 2 LAE is composed of some clumps. Such clumpy structures can be seen some observed LABs in the SSA22 region (Uchimoto et al., 2008; Webb et al., 2009). This result suggests that some Type 2 LAEs may not be well dynamically relaxed after mergers, since the duration of strong Ly emission is shorter than the relaxation time of such a large system.
Since Ly emission is radiated mostly by starbursts, Ly bright regions correspond to sites of subhalo accretion. These results suggest that if we observe LAEs in various wavelengths, the extent and morphology of Type 2 LAEs appear to be different in each band. Recently, such an offset has been reported in local starburst galaxy (Hayes et al., 2007; Östlin et al., 2009), while no offset is found in LAEs at a higher redshift of (Finkelstein et al., 2008). This can be related to the result that the number of more extended, older Type 2 LAEs increases at lower redshifts, as shown below.
Ly emissions are affected more severely by dust extinction than continuum radiation. The effect of dust extinction is expected to be stronger for old metal-enriched systems. In Fig. 10, the escape fractions of Ly photons are plotted against ages of LAEs. The escape fractions are a decreasing function of LAE ages as anticipated. In particular, in Type 2 LAEs, the escape fractions decrease down to 10 percent. Thus, for aged Type 2 LAEs, Ly equivalent widths or luminosities become smaller than expected purely from star formation rate (see Fig. 4). Nevertheless, in the outskirts of halo, starbursts by delayed subhalo accretion take place frequently, where the dust extinction is relatively small. Hence, Ly emissions can be brighter in the outskirts of halo.
3.4 The halo-size distributions of simulated LAEs

Here, we analyze the halo-size distributions of simulated LAEs. Fig. 11 represents the halo-size distributions of all simulated LAEs as a function of mass wighted age at , and 4.5. Here, the radius from the center of gravity of a halo within which of the total mass is included is defined as the size of a halo. At , there are no Type 2 LAEs. At lower redshifts, Type 2 LAEs appear and the number of more extended, older Type 2 LAEs increases with decreasing redshifts. Interestingly, the range of Type 2 LAE size is quite broad. Small Type 2 LAEs with the size of a few tens kpc are as compact as Type 1 LAEs, while large Type 2 LAEs with the size of a few hundreds kpc are comparable to Ly blobs (LABs) (Matsuda et al., 2004).
3.5 Clustering Properties of Two-type LAEs
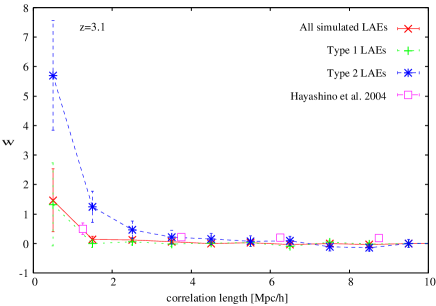
In order to explore the clustering properties of two types of LAEs, we calculate a two-point angular correlation function (ACF) and a two-point angular cross-correlation function (CCF) between Type 1 and Type 2 LAEs. Fig. 12 represents ACFs of each type LAEs and all simulated LAEs. Also, the ACF of LAEs observed in the SSA22 field (Hayashino et al., 2004) is shown. ACF of Type 1 LAEs as well as ACF of all simulated LAEs is quite weak and well matches the observed ACF in in the SSA22 field, whereas ACF of Type 2 LAEs is significantly stronger than that of Type 1 LAEs. This implies that Type 1 LAEs preferentially reside lower-density regions at , as shown by Shimizu et al. (2007), while Type 2 LAEs are located in higher-density regions. The correlation strength of Type 2 LAEs is comparable to that of LBGs in SSA22 region (Giavalisco et al., 1998). This result suggests that Type 2 LAEs may be a subsample of LBGs with strong Ly emission.
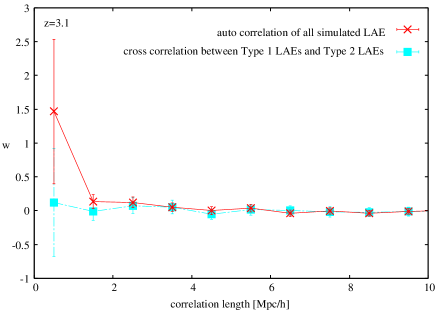
Fig. 13 shows CCF between Type 1 and Type 2 LAEs. The CCF is still weaker than ACF of all simulated LAEs. Very recently, Tamura et al. (2009) have found that the cross correlation between Sub-mm galaxies (SMGs) and LAEs in the SSA22 field is very weak. Type 2 LAEs possess a large amount of dust. If many Type 2 LAEs can be detected as SMGs, our simulation is consistent with this observation.
4 Conclusions and Discussion
To explore the origin of two populations of LAEs recently found, we have performed three-dimensional cosmological -body simulations of subhalo merging history in a CDM universe. We have incorporated star formation history, SED evolution, and dust extinction. As a result, we have found that the age of simulated LAEs can spread over a wide range from yr to yr. Also, we have revealed that there are two types of LAEs. We have defined LAEs younger than yr as Type 1s, and older ones as Type 2s. In Type 1 LAEs early coeval starbursts occur in small parent halos, while in Type 2 LAEs delayed starbursts take place in evolved massive haloes as a consequence of delayed accretion of subhalos. A parent halo can experience repeatedly a Type 2 LAE-phase after a Type 1 LAE-phase.
The stellar mass of Type 1 LAEs is , while Type 2 LAEs are as massive as . The physical properties of Type 1 and Type 2 LAEs are concordant with those of two populations of LAEs observed with multi-wavelengths (Finkelstein et al., 2007; Lai et al., 2008; Matsuda et al., 2007; Uchimoto et al., 2008; Finkelstein et al., 2009). The fraction of Type 2s in all LAEs is a function of redshift, which is less than 2 percent at , 30 percent at redshift , and 70 percent at . This trend is consistent with two populations of LAEs found by Nilsson et al. (2009). Type 2 LAEs are expected to be discriminated clearly from Type 1 LAEs in two color diagram of z’-H vs J-K. We find that the brightness distribution of Ly in Type 2 LAEs is more extended than the main stellar component, in contrast to Type 1 LAEs. This is not only because delayed starbursts tend to occur in the outskirts of a parent galaxy, but also because Ly photons are effectively absorbed by dust in an evolved galaxy. The sizes of Type 2 LAEs range from a few tens to a few hundreds kpc. At lower redshifts, the number of more extended, older Type 2 LAEs increases. Small Type 2 LAEs are as compact as Type 1 LAEs, while large Type 2 LAEs exceeding are comparable to Ly blobs (LABs) (Matsuda et al., 2004).
Moreover, we have found that the clustering of Type 2 LAEs are even stronger than Type 1 LAEs. The amplitude of angular correlation function of Type 2 LAEs is comparable to that of Lyman break galaxies (LBGs) (Giavalisco et al., 1998). This suggests that LBGs with strong Ly line can be Type 2 LAEs. The two-point angular cross-correlation function is still weaker than that of all LAEs. If many Type 2 LAEs can be detected as SMGs, this result is consistent with recent observation by Tamura et al. (2009).
Interestingly, in a low redshift universe at , the Galaxy Evolution Explorer (GALEX) have found many LAEs older than yr, more massive than in stellar component, and having small escape fractions of Ly photons (Deharveng et al., 2008; Finkelstein et al., 2009). These properties are quite similar to those of Type 2 LAEs we defined in this paper. Hence, local LAEs could be a good sample to study the detailed physical states of Type 2 LAEs.
Furthermore, in an evolved population of LAEs, active galactic nucleus (AGN) events may be anticipated, since supermassive black holes reside evolved galaxies in a local universe (e.g., Marconi & Hunt, 2003, and references therein). Recently, Yamada et al. (2009) have found that AGNs are exclusively associated with the massive objects with stellar mass larger than . Also, GALEX found that in low-redshift LAEs an AGN fraction is as high as forty percent (Finkelstein et al., 2009). These findings may imply that Type 2 LAEs could have a higher fraction of AGNs. Hence, it seems worth investigating the contribution of AGNs to Ly emission especially for Type 2 LAEs (Shimizu & Umemura, in preparation).
Acknowledgments
We are grateful to T. Hayashino, T. Yamada, Y. Matsuda and R. Yamauchi for providing valuable information and helpful comments, and to M. Mori and R. M. Rich for valuable discussion. Numerical simulations have been performed with computational facilities at Center for Computational Sciences in University of Tsukuba, and the EUP cluster system installed at Graduate School of Frontier Sciences, University of Tokyo. This work was partially supported by the FIRST project based on Grants-in-Aid for Specially Promoted Research (16002003) and Grant-in-Aid for Scientific Research (S) (20224002), and also by Grant-in-Aid for Young Scientists (S) (20674003).
References
- Cowie & Hu (1998) Cowie, L. L., Hu E. M., 1998, AJ, 115, 1319
- Davis et al. (1985) Davis, M., Efstathiou, G., Frenk, C. S., & White, S. D. M. 1985, ApJ. 292, 371
- Deharveng et al. (2008) Deharveng J.-M., et al., 2008, ApJ, 680, 1072
- Fardal et al. (2001) Fardal M. A., Katz N., Gardner J. P., Hernquist L., Weinberg D. H., Davé R., 2001, ApJ, 562, 605
- Finkelstein et al. (2007) Finkelstein, S. L., Rhoads, J. E., Malhotra, S., Pirzkal, N. & Wang, J. X. 2009, ApJ, 660, 1023
- Finkelstein et al. (2008) Finkelstein S. L., Rhoads J. E., Malhotra S., Grogin N., Wang J., 2008, ApJ, 678, 655
- Finkelstein et al. (2009) Finkelstein S. L., Cohen S. H., Malhotra S., Rhoads J. E., 2009, ApJ, 700, 276
- Finkelstein et al. (2009) Finkelstein S. L., Cohen S. H., Malhotra S., Rhoads J. E., Papovich C., Zheng Z. Y., Wang J.-X., 2009, ApJ, 703, L162
- Finkelstein et al. (2009) Finkelstein, S. L., Rhoads, J. E., Malhotra, S., & Grogin, N. 2009, ApJ, 691, 465
- Fioc & Rocca-Volmerange (1997) Fioc, M., Rocca-Volmerange, B., 1997, A&A, 326, 950
- Gawiser et al. (2006) Gawiser, E. et al. 2006, ApJ, 642, L13
- Gawiser et al. (2007) Gawiser, E. et al. 2006, ApJ, 671, 278
- Giavalisco et al. (1998) Giavalisco, M. et al. 1998, ApJ, 503, 543
- Haiman, Spaans, & Quataert (2000) Haiman Z., Spaans M., Quataert E., 2000, ApJ, 537, L5
- Hansen & Oh. (2006) Hansen, M., Oh, S. P., 2006, MNRAS, 367, 979
- Hayashino et al. (2004) Hayashino, T. et al., 2004, AJ, 245, 208
- Hayes et al. (2007) Hayes, M. et al., 2007, MNRAS, 382, 1465
- Hockney & Eastwood (1981) Hockney, R.W., & Eastwood, J.W. 1981, Computer Simulation Using Particles (New York: McGraw-Hill)
- Hu et al. (1998) Hu, E. M., Cowie, L. L., McMahon, R. G., 1998, ApJ, 502, L99
- Hu et al. (1999) Hu, E. M., McMahon, R. G., Cowie, L. L., 1999, ApJ, 522, L9
- Hu et al. (2002) Hu, E. M., Cowie, L. L., McMahon, R. G., Capak, P., Iwamuro, F., Kneib, J.-P., Maihara, T., Motohara K., 2002, ApJ, 568, L75
- Kodaira et al. (2003) Kodaira K., et al., 2003, PASJ, 55, L17
- Lai et al. (2008) Lai, K. et al. 2008, ApJ, 674, 70
- Matsuda et al. (2004) Matsuda Y., et al., 2004, AJ, 128, 569
- Matsuda et al. (2005) Matsuda Y., et al., 2005, ApJ, 634, L125
- Matsuda et al. (2007) Matsuda et al., 2007, ApJ, 667, 667
- Marconi & Hunt (2003) Marconi A., Hunt L. K., 2003, ApJ, 589, L21
- Mori, Umemura, & Ferrara (2004) Mori M., Umemura M., Ferrara A., 2004, ApJ, 613, L97
- Mori & Umemura (2006) Mori, M., Umemura, M., 2006, Nature, 440, 644
- Neufeld. (1991) Neufeld, D. A., 1991, ApJ, 370, 85
- Nilsson et al. (2009) Nilsson et al., 2009, A&A, 498, 13
- Östlin et al. (2009) Östlin, G. et al., 2009, AJ, 138, 923
- Ouchi et al. (2004) Ouchi, M. et al., 2004, ApJ, 611, 660
- Ouchi et al. (2005) Ouchi, M. et al., 2005, ApJ, 620, L1
- Partridge & Peebles. (1967) Partridge, R. B., & Peebles, P. J. E. 1967, ApJ, 147, 868
- Shimasaku et al. (2003) Shimasaku K., et al., 2003, ApJ, 586, L111
- Shimasaku et al. (2006) Shimasaku K., et al., 2006, PASJ, 58, 313
- Shimizu et al. (2007) Shimizu, I., Umemura, M., & Yonehara, A. 2007, MNRAS, 380, 49L
- Spergel et al. (2003) Spergel, D. N., et al., 2003, ApJS, 148, 175
- Tamura et al. (2009) Tamura et al., 2009, Nature, 459, 61
- Taniguchi et al. (2005) Taniguchi Y., et al., 2005, PASJ, 57, 165
- Taniguchi & Shioya (2000) Taniguchi Y., Shioya Y., 2000, ApJ, 532, L13
- Uchimoto et al. (2008) Uchimoto et al., 2008, PASJ, 60, 683
- Webb et al. (2009) Webb, T. M. A., et al., 2009, ApJ, 692, 1561
- Yamada et al. (2009) Yamada et al., 2009, accepted for ApJ, arXiv:0905.3320
- Yoshikawa et al. (2000) Yoshikawa, K., Jing, Y. P., & Suto, Y. 2000, ApJ, 535, 593