Stereotype bias: a simple formal model
Abstract
Minimizing the relative inertia of a statistical group with respect to the inertia of the overall sample defines an unique point, the in-focus, which constitutes a context-dependent measure of typical group tendency, biased in comparison to the group centroid. Maximizing the relative inertia yields an unique out-focal point, polarized in the reverse direction. This mechanism evokes the relative variability reduction of the outgroup reported in Social Psychology, and the stereotypic-like behavior of the in-focus, whose bias vanishes if the outgroup is constituted of a single individual. In this picture, the out-focus plays the role of an anti-stereotypical position, identical to the in-focus of the complementary group.
Keywords: anti-stereotype, central tendency, context-dependent polarization, Huygens principles, metacontrast ratio, outgroup homogeneity, relative dispersion, stereotype bias, variability reduction
1 Introduction
The expression “typical features of a group” is ambiguous: it might either refer to a multivariate indicator of group central tendency, that is to an unbiased group centroid, or to the distinctive, unique characteristic tendencies of the group, contrasting the features observed in the other groups or in the complete sample, in which case it constitutes a caricatural stereotype.
A stereotype summarizes the features of a whole group into a single profile (variability reduction). Its profile is generally distinct from the group centroid, pushed away from the overall centroid of the whole population or context under consideration (bias or polarization).
These two characteristics of stereotypy have been largely reported in Social Psychology, in particular with reference to the outgroup:
-
1)
people tend to minimize the differences between outgroup members, while being inclined to perceive their own group as made of an heterogeneous set of unique individuals (outgroup relative homogeneity): “They all look alike but we don’t”. See e.g. Quattrone and Jones (1980), Taylor et al. (1978), Park and Hastie (1987), Mullen and Hu (1989), and references therein.
-
2)
people tend to exaggerate the typical traits of the outgoup, and to enhance the contrasts between members of different groups (stereotype polarization or bias effect). See e.g. Turner (1975), Hopkins and Cable (2001), Hogg et al. (2004), Realo et al. (2009), and references therein.
This paper presents a simple, formal, principled mechanism linking the two aforementioned aspects of stereotypy. Specifically, we show that minimizing the relative group dispersion defines an unique point in the feature space, called the in-focus (Theorem 1), manifesting the exaggeration or polarization effect expected from a stereotype (Theorem 2). The polarization can be qualified as fair, in the sense it vanishes for a group formed of a single individual, which thus coincides with its own stereotype. Increasing the group dispersion increases the polarization effect, as shown by (4) and (6).
Furthermore, maximizing the relative group dispersion yields another unique point conjugate to the in-focus, the out-focus, bearing the characteristics of an anti-stereotype or antitype. The group out-focus coincides with the in-focus of the complementary group (Theorem 3), as illustrated on the U.S. Congressmen data (Section 2.4).
Section 3 attempts to justify the position of the in-focus in a decision-theoretical setup, and underlines the connections with the meta-contrast model and simulations of Salzarulo (2006), whose work initially triggered the present research.
2 The formal model
2.1 Definitions and notations: Huygens principle
Consider a totality individuals, denoted , characterized by a multivariate profile of features with . These features define a squared Euclidean distance between individuals
| (1) |
For generality sake, we assume that individuals possess weights , with . The uniform weighting obtains as . Also, consider a profile , which might or might not correspond to the features of an existing individual. Huygens principle consist of the identities
| (2) |
where is the inertia relative to the reference point , is the squared distance between the point and the centroid , and is the inertia relative to the centroid. In particular, (2) shows that attains its minimum for .
Now consider a group of individuals. A group is specified by the individuals it contains, that is, in full generality, by a distribution with . In most situations, the support of (that is the set of individuals for which ) is a strict subset of the complete set of the individuals, but this restriction is not necessary. We however assume that the group centroid differs from the overall centroid , that is . As before, takes on its minimum value for .
2.2 The relative dispersion
Definition 1 (Relative dispersion)
The relative dispersion of group in context , relatively to the reference point is
| (3) |
The relative dispersion measures the disparity or heterogeneity in group , in units determined by the overall heterogeneity, as assessed from some reference point of view . Varying the point of view enables to tune, within some limits, the apparent, perceived relative heterogeneity of the group . Remarkably enough, the relative dispersion is finite everywhere, and possesses an unique minimum as well as an unique maximum :
Theorem 1 (In- and out-focus points)
Both the in-focus point minimizing , and the out-focus point maximizing are unique, and given by , with
| (4) |
where .
By theorem 1, the in- and out-focus points lie on the line joining centroids and . In-focus polarization occurs if lies “on side”, that is if , as in Figure 1. Similarly, out-focus polarization occurs if lies “on side”, that is if . Theorem 2 insures this to be always the case.
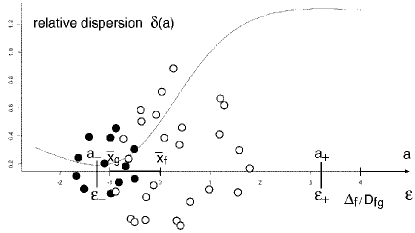
Theorem 2 (Polarization)
In- and out-focus points fall outside the interval , as in figure 1. Specifically,
| (5) |
where both inequalities are attained iff , as in the case of a singleton, dispersion-free group. For small ,
| (6) | |||||
| (7) |
Proofs: let be fixed, and consider the angle between and as measured from . By the cosine theorem,
which is maximum for and minimum for . In both cases, the extremum lies on the line passing through and , i.e. is of the form in (4), with relative dispersion . Setting to zero its derivative in yields , with solutions (with the correct sign) given by (4). Furthermore, it is easy to show that, for and fixed, both expressions and are decreasing in , and take on their maximum value (5) for .
2.3 Other expressions
The following features-based expression may be computationally useful:
| (8) |
is a signed distribution, that is normalized to unity but not necessarily non-negative.
Also, twice application of Huygens decomposition (or direct manipulation of the features) demonstrates the distance-based identities
Finally, define the squared polarization ratio as
which shows the polarization to increase with each of the inertias and . In particular, the polarization ratio takes on its minimum value unity iff , and iff , as shown by (5).
2.4 Illustration: U.S. Congressmen
In the legislature 1984, a number of “key votes” from US Congressmen, comprising Republicans and Democrats, have been coded as 1 (“yea”) or 0 (“nay”)111http://archive.ics.uci.edu/ml/machine-learning-databases/voting-records/ . Missing values have been replaced by the average value inside the affiliated political group.
The overall, Republican and Democrat distributions read respectively as
| (9) |
where denotes the characteristic function of event . After computation of the squared Euclidean distances (1) from the Congressmen votes, a classical multidimensional scaling (MDS) has been performed with uniform weighting of the individuals (see e.g. Mardia et al. 1979) to obtain the factorial coordinates expressing a maximum amount of the overall dispersion (Figure 2). With , and , the polarization ratio is .
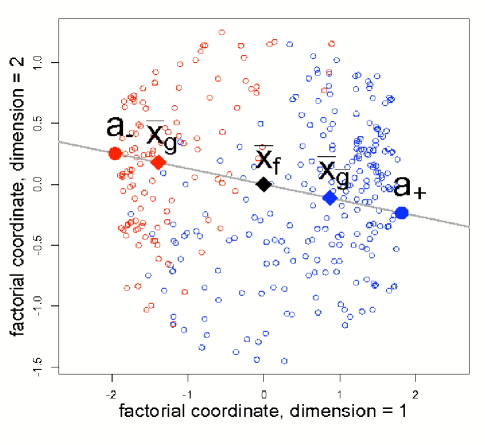
2.5 Complementary group
By construction (Section 2.2), the in-focus is the point of view under which group appears, relatively to the ground or context formed by the complete set of individuals , as homogeneous as possible, and turns out to constitute a credible candidate for representing a stereotypical value. By contrast, the out-focus is the point of view maximally respectful of the features diversity in , and behaves as an antitype - in the sense of “anti-stereotypical”.
In the example of Figure 2, the out-focus of the Republicans seems to be equally qualified to represent the in-focus of the Democrats (not drawn on the Figure). As a matter of fact, the two points coincide, as justified by Definition 2 and Theorem 3 below.
Definition 2
The group complementary to group in context is defined by a normed distribution , which, mixed with , reproduces , in the sense , or equivalently
| (10) |
The definition of insures the non-negativity of . For instance, the Democrats group in (9) is complementary to the Republicans group since with , which turns out to be equal to its maximum value .
Theorem 3
The out-focus point for group is the in-focus point of any group complementary to .
Proof: substituting in (2) and developing the first identity demonstrates , that is . Hence, , and being fixed, maximizing amounts in minimizing .
Note the identity
| (11) |
which demonstrates that extremalizing the relative dispersion or its variant yields the same solutions.
3 Further connections
3.1 Decision theory
The following argument constitutes a first attempt towards a derivation of the in-focus in a decision-theoretical framework. Consider the decision rule “attribute individual either to group with probability or to the overall set with probability ”, where is a parameter controlling the decay of the exponential and a point to be chosen wisely. The probability of misidentifying an individual of (miss) is , and the probability of correctly identifying an individual of as such (correct rejection) is . In the limit of large spread, the ratio of these quantities becomes
In this context, the probability of miss is minimized by the group centroid , while the ratio of the probabilities “miss over correct rejection” is minimized by the in-focus - a somewhat intriguing result to be further investigated.
3.2 Subtractive combinations
Instead of studying the relative dispersion ratio (3), one can consider the subtractive combination of the form
| (12) |
If , the two parameters can be normalized as and . For , possesses a unique bounded extremum at (following parameterization (4)), which turns out to be a minimum for and a maximum for ; no bounded extremum exists for . If , possesses a unique bounded extremum at the mid-point , which constitutes a minimum for and a maximum for . In any case, the position of the extremum does not depend upon the dispersions and . Similar results are obtained when replacing by in (12).
3.3 Meta-contrast ratio and prototypicality function
More interesting, and considerably more involved is the study of the following function, appearing in the framework of the self-categorization theory (where groups are not given a priori), proposed by Salzarulo (2006), and referred to him (up to a sign) as the prototypicality function:
| (13) |
Here , where is the normalization constant: in this approach, the very composition of group depends on the distance of its constituents to . Also, is of the form (10) with .
The function (13) is primarily meant as an improved variant of the metacontrast ratio (Haslam and Turner 1995; Turner et al. 1987; Oakes et al. 1994), measuring the relative differences between individuals, and aimed at predicting to which extent a given individual will be perceived as belonging to the subject group.
The highly non-linear properties of of , whose minima are interpreted as prototypical positions, can be built on to run dynamical numerical simulations exhibiting groups formation and destruction, in the context of opinion formation, for various values of and . In particular, two agents initially categorizing themselves as different can perceive themselves as belonging to the same group in presence of a third agent distant from them; also, fitting experimental data is possible, as those of Haslam and Turner (1995), satisfactorily reproduced with and , on a one-dimensional opinion space . See Salzarulo (2006) for more details.
4 Discussion and conclusion
The mechanism relating the minimization of the relative dispersion to the polarization of the in-focus is entirely mathematical, and relevant to the construction of statistically biased, context-dependent measures of central (or “typical”) tendency. However, the parallel with a few predominant themes of Social Psychology seems striking, and we did not resist the temptation to interpret the in-focus as a stereotype, and the statistical group as an outgroup. The extent to which the metaphor is legitimate is be judged within Social Psychology. Among the points potentially stimulating, let us mention the question of the identification of the ingroup, of which both the context and the complementary are legitimate candidates - with similar if not identical effects, in view of Theorem 3 and (11).
The formalism we have used is both general, that is using weighted groups allowing fuzzy memberships, and classical, that is using squared Euclidean distances as measures of dissimilarities. Euclidean distances permit, in contrast to other dissimilarities, to extract the original features through MDS (up to a rotation in the features space); they furthermore additively decompose accordingly to Huygens principles, the use of which has been crucial in the present paper.
Non-Euclidean dissimilarities, to which alternatives measures of central tendency are associated, such as the trimmed mean or the median (e.g. Hampel et al. 1986), are perfectly legitimate, and possibly better justified form robustness considerations. The resuting polarization of the in-focus would certainly deserve proper studies, which are however bound to be technically more involved.
References
- [1] Hampel, F.R., Ronchetti, E.M., Rousseeuw, P.J., Stahel, W.A. (1986) Robust Statistics: The Approach Based on Influence Functions, Wiley
- [2] Haslam, S.A., Turner, J. C. (1995) Context-dependent variation in social stereotyping 3 : Extremism as a self-categorical basis for polarized judgement. European Journal of Social Psychology 25, 341–371
- [3] Hogg, M.A., Abrams, D., Otten, S., Hinkle, S. (2004) The Social Identity Perspective: Intergroup Relations, Self-Conception, and Small Groups. Small Group Research 35, 246–276
- [4] Hopkins, N., Cable, I. (2001) Group variability judgments: Investigating the context-dependence of stereotypicality and dispersal judgments. British Journal of Social Psychology 40, 455–470
- [5] Mardia, K.V., Kent, J.T., Bibby, J.M. (1979) Multivariate analysis. Academic Press
- [6] Mullen, B., Hu, L.-T. (1989) Perceptions of Ingroup and Outgroup Variability: A Meta-Analytic Integration. Basic and Applied Social Psychology 10, 233–232
- [7] Oakes, P.J., Haslam, S.A., Turner, J.C. (1994) Stereotyping and social reality. Blackwell
- [8] Park, B., Hastie, R. (1987) Perception of variability in category development: Instance- versus abstraction-based stereotypes. Journal of Personality and Social Psychology 53, 621–635
- [9] Quattrone, G.A., Jones. E.E. (1980) The Perception of Variability Within In-Groups and Out-Groups: Implications for the Law of Small Numbers. Journal of Personality and Social Psychology 38, 141–152
- [10] Realo, A., Allik, J., Lönnqvist, J.-E., Verkasalo, M., Kwiatkowska, A., Kööt, L., Kütt, M., Barkauskiene, R., Laurinavicius, A., Karpinski, K., Kolyshko, A., Sebre, S., Renge, V. (2009) Mechanisms of the national character stereotype: How people in six neighbouring countries of Russia describe themselves and the typical Russian. European Journal of Personality 23, 229–249
- [11] Salzarulo, L. (2006). A Continuous Opinion Dynamics Model Based on the Principle of Meta-Contrast. Journal of Artificial Societies and Social Simulation 9(1)13 http://jasss.soc.surrey.ac.uk/9/1/13.html
- [12] Taylor, S.E., Fiske, S.T., Etcoff, N.L., Ruderman, A.J. (1978) Categorical and Contextual Bases of Person Memory and Stereotyping. Journal of Personality and Social Psychology 36, 778–793
- [13] Turner, J.C. (1975) Social comparison and social identity: Some prospects for group behavior. European Journal of Social Psychology 5, 5–34
- [14] Turner, J.C., Hogg, M.A., Oakes, P.J., Reicher, S. D. Wetherell, M.S. (Eds.) (1987) Rediscovering the social group : A self-categorization theory. Blackwell.