stellar synthetic spectroscopy in the Virtual Observatory era
Abstract
Arguments for including in the VO large grids of synthetic spectra fully covering the HR diagram are presented. One obvious need is that of population synthesis at all redshifts. Theoretical spectra have also the power to predict peculiar behaviors, that could remain unnoticed in observed spectra, or lead to erroneous conclusions. One interesting example is given of the Ca II H & K lines in extremely metal-poor stars. In carbon-rich atmospheres, the H & K lines become much weaker relative to the continuum, which will lead to an underestimate of the metallicity. What actually happens is a displacement of the continuum, obvious in absolute-flux synthetic spectra, but not visible in observed continuum-normalized spectra. Libraries of synthetic spectra are described, as well as the codes used to compute them. A few remarks are made on issues with making these libraries available through the VO, as well as on the necessary input data, i.e. line lists and model atmospheres.
keywords:
Star: atmospheres; Stars: chemically peculiar; Technique: spectroscopic; Virtual Observatory1 Why synthetic spectroscopy in the VO ?
Synthetic spectra have several advantages over observed spectra: they naturally provide absolute fluxes (and intensities!), as well as normalization to the continuum, and they can be computed for whatever stellar parameters (even rare or unobserved types!). In principle, a database of synthetic spectra can cover the whole HR diagram at all metallicities, and non-standard chemical compositions, which is invaluable for stellar population synthesis. Synthetic spectra may be used for the preparation of instruments, e.g. GAIA, or to understand characteristics of sub-samples in large surveys (using e.g. color-color diagrams or low-resolution spectra). They are necessary to quickly classify spectra in large surveys (e.g. micro-lensing searches) with non-standard wavelength ranges at various spectral resolutions. And of course synthetic spectra are necessary to extract stellar parameters from observations (, [Fe/H], etc).
Various kinds of spectra can be computed, corresponding to the usage that is intended: population synthesis may require low resolution, full spectral coverage, or conversely a medium resolution, shorter spectral coverage (e.g. H band). High resolution, over a short spectral interval is required to prepare the GAIA RVS (Ca II IR triplet region). Exploitation of VLT-UVES spectra requires very high resolution over the whole optical and near-IR domain. In all cases, the variation of many parameters is a key to the superiority of synthetic spectra over observations (, gravity, [Fe/H], [/Fe], C, N, O abundances, etc). This may represent a large number of spectra if a significant portion of the HR diagram is to be covered (at least to spectra). The computation time of such an amount of spectra is not a big issue if the model atmospheres used are classical (in the sense 1-D, LTE, hydrostatic). If one at least of these simplifying hypotheses is lifted the computing time may become prohibitively large. For some regions of the HR diagram, or if a great precision is wanted, this proves necessary (e.g NLTE and wind hydrodynamics for OB stars, non-LTE and 3-D hydrodynamical models of convection for better than 5% accuracy in abundances in solar type stars). What is always necessary is a good set of physical input data (line lists, partition functions, etc).
2 What can be done with synthetic spectra: four illustrations
2.1 impact of stellar parameters on spectra
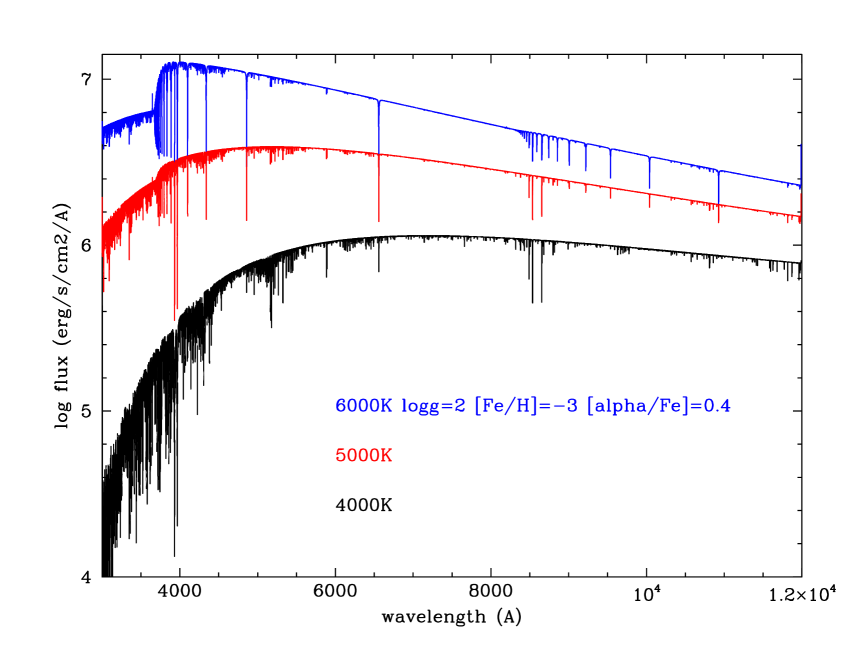
I chose here to illustrate this on some unusual extremely metal-poor carbon-rich stars. Carbon-enhanced stars make up around 20% of very metal-poor stars and have become a boiling field of research in recent years (see the review of Beers & Christlieb (2005)). The model atmospheres used for the calculation of the spectra shown on Fig. 1, 2, and 3 were


computed with the MARCS code (Gustafsson et al., 1975; Plez et al., 1992; Gustafsson et al., 2003). The Figures speak for themselves. Similar observed spectra are used to search for metal-poor stars with specific characteristics of temperature, metallicity or carbon enhancement in low-resolution spectroscopic surveys like the SDSS-SEGUE (Sloan Extension for Galactic Understanding and Exploration, see e.g. Sivarani et al. (2005)). Also, synthetic photometry can be directly computed from these spectra and used for similar purposes. One particular interest is the calibration of color-temperature relations for extremely metal-poor stars, especially of non-standard composition, that are only observed in small numbers, if at all.
2.2 Effect of carbon enhancement on the Ca II H & K lines
Fig. 4 shows the near-UV model spectra of extremely metal-poor

main sequence stars with =5000K. The Ca II lines appear weaker with higher C/Fe ratio, which gives the impression at first glance that the Ca abundance is lower. As many searches for metal-poor stars have relied upon H & K strength (in particular the many candidates extracted from the HK survey of Beers et al. (1985)), it is important to understand this H & K weakening to be able to disentangle Ca and C abundance effects. What happens is understood by looking at the opacity in the continuum and line forming region in the models. In the [C/Fe]=0 model atmosphere, the dominant continuum opacity source around 3500Å is H-, whereas in the model with [C/Fe]=2, the CH continuous absorption increases the opacity by a factor 10 to 100. This strong difference in the continuous opacity deeply affects the continuum flux, whereas line cores, with much larger opacities, remain mostly unchanged. This can be seen in Fig. 5 (absolute flux showing the change in continuum level),
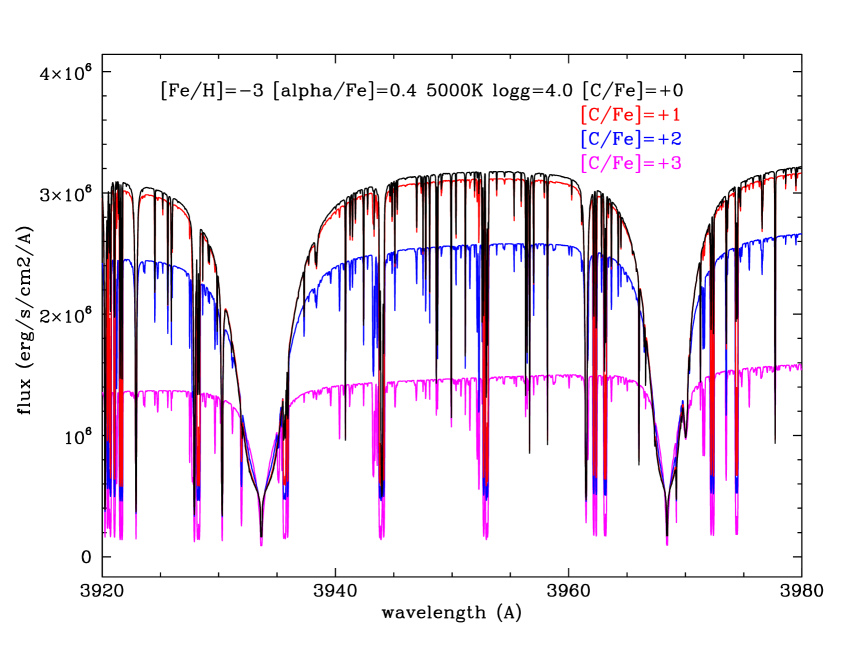
as well as in Fig. 3 (distortion of the continuum in the near-UV). The effect is only seen because the flux is plotted on an absolute scale, allowing comparison between spectra of stars with different abundances. When observing at the telescope, the situation would look as in Fig. 4, and therefore look as a Ca underabundance, not a C overabundance! Only synthetic spectra can reveal such an effect.
2.3 Other illustrations
Further illustration is given by the possibility to predict theoretical equivalent widths of, e.g., Balmer lines as a function of in hot stars, useful in population synthesis, as shown by Martins et al. (2005). A last example is given by the work of Massey et al. (2005) and Levesque et al. (2005, 2006), using synthetic MARCS spectra and observed spectro-photometry of red supergiant stars to derive simultaneously the of the stars and the reddening on the line of sight. The reddening law affecting the slope of the spectrum, does not change the strength of the TiO bands relative to the local continuum. As this strength is very sensitive to temperature, the can be derived independently of the reddening, that follows from an adjustment of the slope of the theoretical spectrum on the observed spectro-photometry. This work has lead to a revision of the temperature scale of red supergiants. Another result is that the reddening towards red supergiants is larger than in the surrounding OB associations, which shows that there is a circumstellar dust contribution to the reddening. The slope of the reddening indicates that the dust grains are of larger size than their interstellar counterparts. Such a work would not be possible without synthetic spectra, as virtually all red supergiants are reddened by unknown amounts, presumably by grains of various sizes.
3 Some challenges for synthetic spectroscopy in the VO
Some of the challenges ahead are, .e.g., (i) the analysis of huge amounts of spectra from GAIA, SDSS-SEGUE, RAVE, and multifibre spectrographs, esp. from ELTs, each of which represents millions to billions of spectra, or (ii) to synthesize stellar populations at high redshifts, low metallicity, in various wavelength regions, For that, we need very large grids of synthetic spectra, and fast, reliable and accurate algorithms to do it automatically. Two approaches may be chosen: to use large libraries of spectra from the VO to compare to observations with VO tools or to compute specific spectra for each observation , either locally with resident software and computer, but using data and other tools from the VO, or with codes running on a server inside the VO. We will further comment on these two philosophies below.
4 Libraries of synthetic spectra
A number of libraries already exist on the web, although not always integrated in the VO. Spectral Energy Distributions (SED) are available for the various brands of 1-D, static, LTE models ATLAS (Kurucz, 1979; Castelli et al., 1997), MARCS (marcs.astro.uu.se), and PHOENIX (Hauschildt et al., 1996; Hauschildt et al., 1999). Note that in some cases the SEDs are actually sampled spectra, as the models are usually computed with the opacity sampling algorithm, a Monte-Carlo approach to the radiative field calculation. All radiative quantities are computed at a large number of wavelengths, but nothing is known in between. The difference between a high resolution spectrum, and a spectrum sampled at a resolution of is shown in Fig 6. It is clear that the sampled flux cannot be compared to an observed spectrum at the same resolution. This can be done only at a degraded resolution. A sampled spectrum will globally provide the right fluxes at a much lower resolution, but not locally at high resolution.

Detailed high-resolution spectra are only available for subsets of the existing grids. There are too many to cite them all, but most can be found (together with observed libraries) on the excellent site of D. M. Gutiérrez (www.ucm.es/info/Astrof/invest/actividad/spectra.html). A problem still to be solved for many of these libraries is to properly include them in the VO (see one approach in the contribution by Rodrigo Blanco (2007) in this volume). One library of synthetic spectra that is just about to be made available is the POLLUX database (see the contribution by Palacios et al. (2007) in this volume). It will be directly VO compliant and includes high resolution synthetic spectra (300-1200 nm), covering most of the HR diagram, at all metallicities. It will also provide SEDs at lower resolution. Regular updates are planned.
4.1 Issues to keep in mind
Computing such large grids of models and spectra may become time-consuming. CPU time is of course needed, but also scientist time to assemble the input data, set up the calculations, and check that the output makes sense. Making the data available on the web, other than as a tar-file on an anonymous ftp, and especially if it has to be VO compliant may also become a burden. Here, help from our friends of the VO is critical. The benefits of getting ones models easily accessible on the web, are twofold: (i) the models get used and one hopefully gets acknowledged (the concern is that one has to find a way that when data is made available through the VO, and is passed from one tool to another to finally become part of some end product, proper referencing to the original source is ensured), (ii) as importantly, the use of the models towards different purposes, sometimes not anticipated by their producers, leads to a thorough tests of these models and their limits. However, users must remember that model spectra may be flawed, because of inappropriate physics (e.g. LTE O star atmospheres, 1D static models for convective 3D atmospheres), because of inaccurate input data (e.g. line positions and strengths), or because of missing data (e.g. cool stars without TiO). It is important to understand the limits of a given brand of models and to refrain from using them to far off limits. Differences will always appear at some level between observations and calculations, but the problems are often not easy to ascribe to either models or observations. Observers tend to blame the models, and vice-versa… One way to estimate systematic errors in models may be to compare models computed with different codes and input data sets. While not always possible this is certainly very instructive. Illustrations can be found in Martins et al. (2005). Differences tend to increase for more extreme spectral types, and progress needs to be made particularly on carbon stars, and very cool stars, although successes like the analysis of very cool AGB star spectra with down to 2700 K by García-Hernández et al. (2007) demonstrate the level of sophistication of modern model atmospheres and spectra.
5 Synthetic spectroscopy at home or Spectra on Demand from VO ?
To address the challenges outlined above, one approach would be to implement in the VO interfaces to synthetic spectroscopy codes that could be run on demand by the user for specific combinations of stellar parameters. This would be very flexible, but prohibitively demanding on resources due to the huge amount of computations that could be required (new calculation for each slightly different stellar parameter or abundance). A better way of doing is to provide in a simple and standard way large grids of pre-computed spectra, at very high resolution (it is easy to degrade them to lower resolutions), with only the main stellar parameters varied (, gravity, Fe/H, -elements/Fe, and possibly some CNO variations). These grids can be interpolated to produce population syntheses. All present needs in population synthesis can presumably be fulfilled with these basic grids. Similarly, to analyse large numbers of observed spectra, the calculated grids can be interpolated to feed automatic analysis codes, resulting in first estimates of the main stellar parameters. Refinements can be made locally using a spectrum synthesis code, model atmospheres, and spectral line lists. The automatic tools for stellar parameters determination are certainly something one would want to see integrated into the VO. The development of these codes has followed various lines: minimum distance methods, that are limited to few parameters, neural networks that may be difficult to teach, and also new solutions that seem fast and efficient like MATISSE (Recio-Blanco et al., 2006).
5.1 Synthetic spectroscopy codes (LTE)
If the user wants to compute spectra with specific stellar parameters, we have seen that the only viable solution is a local implementation of a synthetic spectroscopy code. However, ingredients to compute synthetic spectra may be found on the web, in the VO: stellar model atmospheres, and atomic and molecular line lists (see below). A number of synthetic spectroscopy codes are available from their authors. I will here only present the 1-D LTE codes that are most widely used (multi-D codes, or polarized radiation codes are usually not freely available; some non-LTE codes can be found on the web). SYNTHE was developed by R. Kurucz and is adapted to the calculation of spectra for the ATLAS models. It is available on line either on Kurucz page (kurucz.harvard.edu), or better, with updates and documentation, on wwwuser.oat.ts.astro.it/atmos. MOOG was initially written by C. Sneden, who continues to update it. The present version is pure-LTE (no continuum scattering included), and intended for FGK stars. It is available with documentation on verdi.as.utexas.edu/moog.html. SME (spectroscopy made easy) is developed by N. Piskunov, and is further described in his contribution in this volume. It allows in particular abundance stratifications. It is available upon request. TURBOSPECTRUM was developed by B. Plez from an older code of the Uppsala group (B. Gustafsson). The assumptions are similar to the MARCS code and the input physics is the same. It is optimized for the computation of cool star spectra (FGKMSC) and can compute large chunks of spectra with millions of spectral lines. It is available upon request, without documentation. Some issues have to be kept in mind when using off-the-shelf codes. Making a code available to a wide audience is not a simple task, if one wants to avoid its use in conditions it was not intended for. Many warnings and conditional tests have to be implemented (this is usually not done, and the result will be that the code may run and produce an erroneous output without any warning). Writing a documentation is a tedious task. It may be incomplete, and is often not read thoroughly. Ideally, there should be continued contact between users and providers of codes in order to help improve, correct, debug and document them.
5.2 Spectral line databases
A main ingredient for the computation of synthetic spectra is the line lists. There are many databases on the web. There are also lists of databases, always incomplete, but useful: www.cfa.harvard.edu/amdata/ampdata/amdata.shtml. The Kurucz home page is an enormous resource, but not always well documented with regards to, e.g., what input data was used to construct the lists. An excellent atomic line database is the VALD (Piskunov et al., 1995; Kupka et al., 1999; Piskunov, 2007). A third release is planned for the Fall 2007, including for the first time molecular lines (TiO). Molecular line lists are scattered on various sites: NASA-Ames, University College London, … A good source of information is the stellar atmosphere code descriptions, as their conceptors strive to use the best and most complete data. The contribution by E. Roueff in this volume provides also a few more references.
6 Summary and a few questions
I have shown that the setup of large libraries of synthetic spectra is needed in the VO and quite straightforward to implement if only a few stellar parameters are allowed to vary. Of course the data model needs to be finalized, but the discussions we had at the conference will certainly speed up the process. For example, calculated spectra cannot be queried with a position on sky, which is the usual way to query observations… On the other hand one would like to be able to query synthetic spectra with an abundance pattern, or a temperature. Such libraries will allow to address many challenges of modern astronomy, but more detailed investigations (e.g. with specific chemical composition) based on synthetic spectra require a local implementation of synthetic spectroscopy codes, that are available off-the-shelf. The input data (line lists) is not yet consistently included in the VO, and the data model is still under development. The situation is better for atomic data, with the existence of the VALD database. Molecular data is scattered on the web and the best way so far to assemble line lists is to contact people that have done it for their own work. Some challenges are ahead, like the automatic classification of spectra, and the determination of stellar parameters on samples of billions of spectra. New methods are being tested that may allow to do this reliably on a large scale. These tools could be included in the VO. Other tools that should be included in the VO are correlation and convolution (with rotation, macroturbulence, and instrumental profiles) tools that could be used on both observed and calculated spectra. And finally, n all instances one has to make sure that proper credit is given to all developers of such tools, models and calculations, if one wants to keep alive a spirit of sharing resources in the community. Credit is unfortunately needed to get jobs and money. An possible solution was given at the conference: forward the information on developers in the metadata sent to users, and inform journal editors and referees that they should ensure proper referencing of the source of data extracted from the VO. And finally, it is not easy to go mining into calculated (or observed data), and we will have to keep on learning to use tremendous amounts of data in an educated way.
Acknowledgments
I thank the organizers for inviting me to this meeting, allowing me to get in touch with the VO world, understand some of it, and hopefully transmit some useful information and constraints for the inclusion of synthetic spectra into the VO.
References
- Beers & Christlieb (2005) Beers, T.C. & Christlieb, N. 2005, ARAA, 43, 531
- Beers et al. (1985) Beers, T.C., Preston, G.W., & Shectman, S.A. 1985, AJ, 90, 2089
- Castelli et al. (1997) Castelli, F., Gratton, R.G., Kurucz, R.L., 1997, A&A, 318, 841
- García-Hernández et al. (2007) Garcia-Hernandez, D.A., Garcia-Lario, P., Plez, B., et al., 2006, A&A, 462, 711
- Gustafsson et al. (1975) Gustafsson, B., Bell, R.A., Eriksson, K., Nordlund, Å, 1975, A&A, 42, 407
- Gustafsson et al. (2003) Gustafsson B., Edvardsson B., Eriksson K., et al., 2003, ASP Conf. Ser. Vol. 288, (I.Hubeny, D.Mihalas, K.Werner eds.), p. 331
- Hauschildt et al. (1996) Hauschildt, P.H., Baron, E., Starrfield, S., & Allard, F. 1996, ApJ, 462, 386
- Hauschildt et al. (1999) Hauschildt, P.H., Allard, F., Baron, E., & Schweitzer, A., 1999, ApJ, 312, 377
- Kupka et al. (1999) Kupka, F., Piskunov, N.E., Ryabchikova, T.A., et AL., 1999, A&AS, 138, 119
- Kurucz (1979) Kurucz, R.L., 1979, ApJS, 40, 1
- Levesque et al. (2005) Levesque, E.M., Massey, P., Olsen, K.A.G., et al., 2005, ApJ, 628, 973
- Levesque et al. (2006) Levesque, E.M., Massey, P., Olsen, K.A.G., et al., 2006, ApJ, 645, 1102
- Martins et al. (2005) Martins, L.P., González Delgado, R.M., Leitherer, C., et al., 2005, MNRAS, 358, 49
- Massey et al. (2005) Massey, P., Plez, B., Levesque, E.M., et al., 2005, ApJ, 634, 1286
- Palacios et al. (2007) Palacios, A., Josselin, E., Lèbre, A., et al., 2007, this volume
- Piskunov (2007) Piskunov, N., 2007, this volume
- Piskunov et al. (1995) Piskunov, N.E., Kupka, F., Ryabchikova, T.A., et al., 1995, A&AS 112, 525
- Plez et al. (1992) Plez, B., Brett, J., Nordlund, Å1992, A&A, 256, 551
- Recio-Blanco et al. (2006) Recio-Blanco, A., Bijaoui, A., de Laverny, P., 2006, MNRAS, 370, 141
- Rodrigo Blanco (2007) Rodrigo Blanco, C., 2007, this volume
- Sivarani et al. (2005) Sivarani, T., Beers, T.C., Lee, Y., et al., 2005, AAS, 207, 131.13