Revisit Short Term X-ray Spectral Variability of NGC 4151 with Chandra
Abstract
We present new X-ray spectral data for the Seyfert 1 nucleus in NGC 4151 observed with Chandra for 200 ks. A significant ACIS pileup is present, resulting in a non-linear count rate variation during the observation. With pileup corrected spectral fitting, we are able to recover the spectral parameters and find consistency with those derived from unpiled events in the ACIS readout streak and outer region from the bright nucleus. The absorption corrected 2–10 keV flux of the nucleus varied between erg s-1 cm-2 and erg s-1 cm-2 ( erg s-1). Similar to earlier studies of NGC 4151 at a historical low state, the photon indices derived from the same absorbed power-law model are . However, we show that is highly dependent on the adopted spectral models. Fitting the power-law continuum with a Compton reflection component gives . By including passage of non-uniform X-ray obscuring clouds, we can reproduce the apparent flat spectral states with , typical for Seyfert 1 AGNs. The same model also fits the hard spectra from previous ASCA “long look” observation of NGC 4151 in the lowest flux state. The spectral variability during our observation can be interpreted as variations in intrinsic soft continuum flux relative to a Compton reflection component that is from distant cold material and constant on short time scale, or variations of partially covering absorber in the line of sight towards the nucleus. An ionized absorber model with ionization parameter can also fit the low-resolution ACIS spectra. If the partial covering model is correct, adopting a black hole mass M⊙ we constrain the distance of the obscuring cloud from the central black hole to be light-days, consistent with the size of broad emission line region of NGC 4151 from optical reverberation mapping.
1 Introduction
NGC 4151 is a well-known nearby ( Mpc for km s-1 Mpc-1; Mundell et al. 1999) bright Seyfert 1.5 galaxy (Osterbrock & Koski 1976), hosting one of the apparently brightest active galactic nuclei (AGN) (Crenshaw & Kraemer 2007; Storchi-Bergmann et al. 2009). For a review, Ulrich (2000) provides the multiwavelength properties of the galaxy, and the ultraviolet (UV)/X-ray spectra of the AGN. As an archetype of its class, the NGC 4151 nucleus has been intensively studied with all the major X-ray observatories. Its broad band X-ray spectrum is very complex; the main features are summarized as follows:
(1) The 2–10 keV (absorption corrected) luminosity is significantly variable, in the range erg s-1 ( erg s-1) with hard spectrum ( keV) characterized by a power law (Yaqoob et al. 1993; Warwick et al. 1995, 1996). The 2–10 keV flux can double on timescale of days (Tananbaum et al. 1978; Yaqoob & Warwick 1991) and flaring events are seen on timescales of days and weeks (Elvis 1976; Lawrence 1980; Edelson et al. 1996; Markowitz et al. 2003; de Rosa et al. 2007).
(2) The photon spectral index () of the hard power law spectrum varies between and , and correlates with the 2–10 keV flux111The linear relation between and the absorption corrected 2–10 keV flux in units of erg s-1 derived from EXOSAT and Ginga measurements is (Perola et al. 1986) and (Yaqoob & Warwick 1991), respectively.. The spectrum becomes softer with increasing flux, and the same variability in the X-ray continuum flux is observed on time scales of days to years in the spectral slope. Note that the range of corresponds to a harder spectrum than the canonical value for Seyferts of (e.g., Mushotzky 1984, Nandra & Pounds 1994).
(3) A soft “excess” ( keV) is present in the spectra when fitted with the power law measured in the hard-band and a uniform absorption (Holt et al. 1980). Extended soft X-ray emission associated with ionized gas observed in the optical has been detected (Elvis et al. 1983; Morse et al. 1995; Ogle et al. 2000; Yang et al 2001). The soft flux shows stability against the high variations in the UV and hard X-ray continua (Perola et al. 1986; Weaver et al. 1994a,b).
(4) A clear emission line is present at keV (Matsuoka et al. 1986; Wang et al. 2001; Schurch et al. 2003), consistent with being Fe emission line produced by the fluoresence of cold iron illuminated by the X-ray continuum. The line has a relatively narrow Gaussian profile and the line flux remains constant over time (Warwick et al. 1989; Schurch et al. 2003). Long term monitoring with RXTE/PCA over 800 days (Markowitz et al. 2003) shows a decreasing line flux. De Rosa et al. (2007) suggest that the line exhibits some variability related to the reflection component.
Particularly interesting results were reported from previous Chandra observations. Yang et al. (2001) presented Chandra observations of NGC 4151 and found that the 2–9 keV spectrum of the nucleus is described by a heavily absorbed ( cm-2), extremely hard power law (photon index ). This is consistent with the Chandra HETG spectra reported in Ogle et al. (2000), in which the hard continuum emission is characterized by a photon index with a column of cm-2. Note that both observations found NGC 4151 in a low state with erg s-1 and do not follow the – correlation. The rather unusually flat power law slope complicates the understanding of the X-ray spectrum of NGC 4151.
We have obtained deep Chandra observation aimed to take advantage of Chandra’s sub-arcsecond spatial resolution (van Speybroeck et al. 1997) to study the soft circum-nuclear extended emission. These data also present an opportunity to examine the spectra of this puzzling nucleus. The Chandra observations and data reduction are briefly described in § 2. We examine the light curves of the nucleus and perform diagnostic analysis of the X-ray spectra in § 3. In § 4 we explain the various ways to model the X-ray spectra. We then analyzed the archival deep ASCA observation of NGC 4151 in low state to check the validity of our models (§ 5). Finally we discuss the results in § 6 and summarize our findings in § 7.
2 Observations and Data Reduction
NGC 4151 was imaged with the Chandra X-ray Observatory (Weisskopf et al. 2002) on 2008 March 27 (ObsID 9218; 69 ks) and March 29 (ObsID 9217; 125 ks). Both observations were obtained with the back-illuminated chip of the Advanced CCD Imaging Spectrometer spectroscopy array (ACIS-S; Garmire et al. 2003) in Faint “1/8 subarray” mode. CCDs S2, S3, and S4 were read out. The NGC 4151 nucleus (=12h10m32.s6, =+39∘24′21′′; Clements 1981) was placed at the on-axis position near the ACIS-S3 aimpoint of Chandra’s High Resolution Mirror Assembly (HRMA; van Speybroeck et al. 1997) at a 186∘ roll angle. This reduced the frame time from the nominal 3.2 s in full array mode to 0.6 s to reduce photon pileup222For more information see Chandra ABC Guide to Pile Up, available at http://cxc.harvard.edu/ciao/download/doc/pileup_abc.ps–during the exposure of a frame, two or more photons from a high count rate X-ray source are recorded as a single event, causing loss of information from the original events.
The data were processed following the standard Chandra ACIS data preparation thread, with the Chandra X-Ray Center (CXC) CIAO v4.0 software and HEASOFT v6.4 package333See http://cxc.harvard.edu/ciao/ and http://heasarc.gsfc.nasa.gov/lheasoft/ for more information.. The CALDB444http://cxc.harvard.edu/caldb/ v3.4.3 calibration files were used. To remove periods of high background, we extracted light curves for chip S3 in both observations, excluding any bright sources in the field. Events during period of background flares were screened out, and the resulting total exposure was 124 ks for ObsID 9217 and 67 ks for ObsID 9218 before dead time correction (after dead time correction, 116 ks and 63 ks for ObsID 9217 and 9218, respectively).
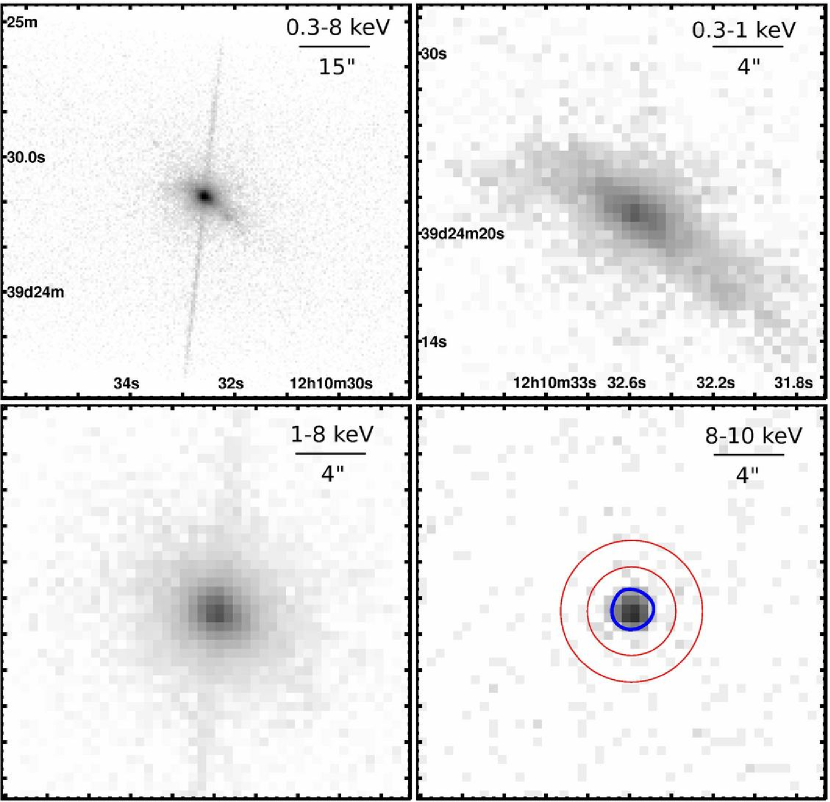
Figure 1 shows the ACIS view of the NGC 4151 galaxy and images zoomed in to its nucleus region in different energy ranges (0.3–1 keV, 1–8 keV, and 8–10 keV). The X-ray emission comprises an unresolved, bright nucleus and resolved soft extended regions (Elvis et al. 1983; Morse et al. 1995; Yang et al. 2001) with spatial scales of several hundred parsecs ( on both sides of the nucleus). Detailed ACIS study of the soft extended emission will be reported in a separate paper, complemented by Chandra High-Resolution Camera (HRC; Murray et al. 1997) data (Wang et al. 2009).
Yang et al. (2001) reported that both their 0.4 s and 3.2 s frame time ACIS images of the nucleus in low-flux state suffered considerable photon pileup. Even if NGC 4151 were at its lowest flux state, the brightness of the nucleus would cause photon pileup in our sub-array observations, despite the reduced frame time. This is already evident in Figure 1: the nucleus remains bright in the hardest band, while there is little effective area of HRMA/ACIS-S3 in the very hard energy range ( keV; see the Chandra Proposers’ Observatory Guide555http://cxc.harvard.edu/proposer/POG/, POG). Most of the hardest photons in the nucleus region actually come from piled soft photons. Pileup effect is a great concern to both timing and spectral analysis. Photon pileup can reduce the apparent count rate, causing a non-linear relation between the source flux and the count rate. It also skews the observed spectra towards higher energies. The impact of pileup to our data will be carefully evaluated in the next section.
3 Initial Analysis with Pileup
To have a better handle of the pileup and derive meaningful results, we will examine the light curves and spectra of the bright nucleus, using extracted data from the point spread function (PSF) core region, the PSF wing region, and the ACIS readout streak666X-ray photons arrived during the frame transfer were still recorded but mispositioned along the axis of CCD readout. For a bright source, this results in a streak along the entire column of the source. See Chandra POG and McCollough & Rots(2005).. By comparing the analysis for the piled and unpiled data, we demonstrate that the existing pileup modeling tool works well with our data.
3.1 X-ray Light Curves
Adopting the best-fit model parameters for NGC 4151 at low state (e.g., Ogle et al. 2000, Yang et al. 2001) and a 0.6 s frame time, the Portable Interactive Multi-Mission Simulator (PIMMS777http://heasarc.gsfc.nasa.gov/Tools/w3pimms.html) predicts a count rate of 1.4 count s-1 (0.8 count s-1 after pileup) and a pileup fraction of 28% (the estimated percentage of detected events that consist of more than one photon; see the Chandra POG). A higher observed flux of erg s-1 cm-2 (2-10 keV) was reported in Weaver et al. (1994b). If the nucleus is in a similar high flux state, a count rate of 5 count s-1 (0.9 count s-1 after pileup and a pileup fraction 70%) is expected.
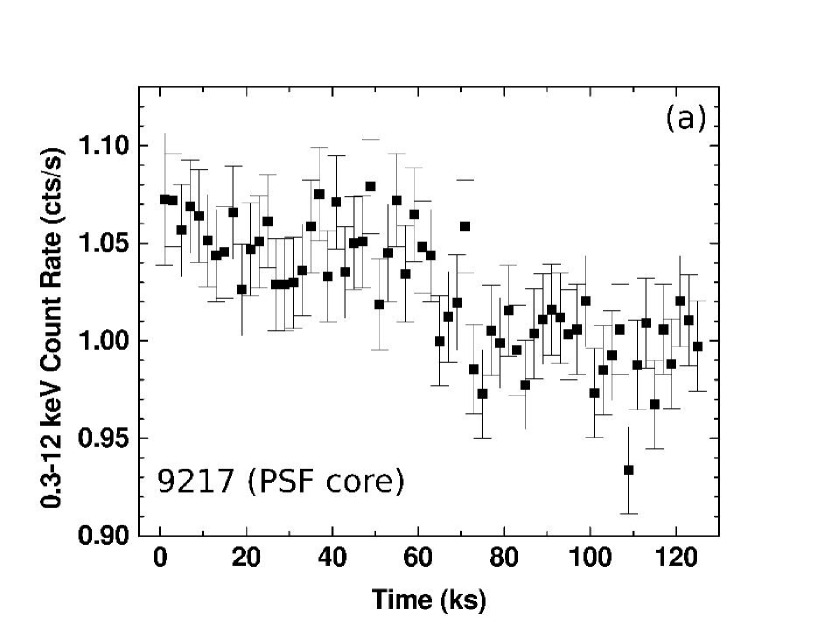
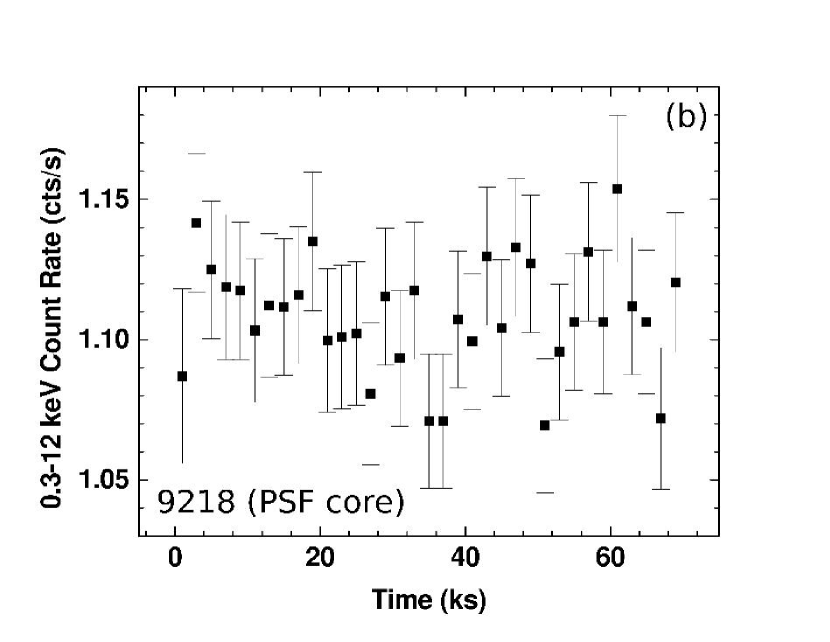
We first extracted light curves of the NGC 4151 nucleus in each observations from the PSF core. Data were extracted from a radius circular region centered on the source; this is approximately the 90% encircled energy radius of the point spread function (PSF) at 1.49 keV (Figure 1). The (negligible) background data were taken from a source free, radius circular region of the same chip. In the same PIMMS energy band, the observed count rate is between 0.88 and 0.97 count s-1 without pileup correction, implying a significant pileup fraction.
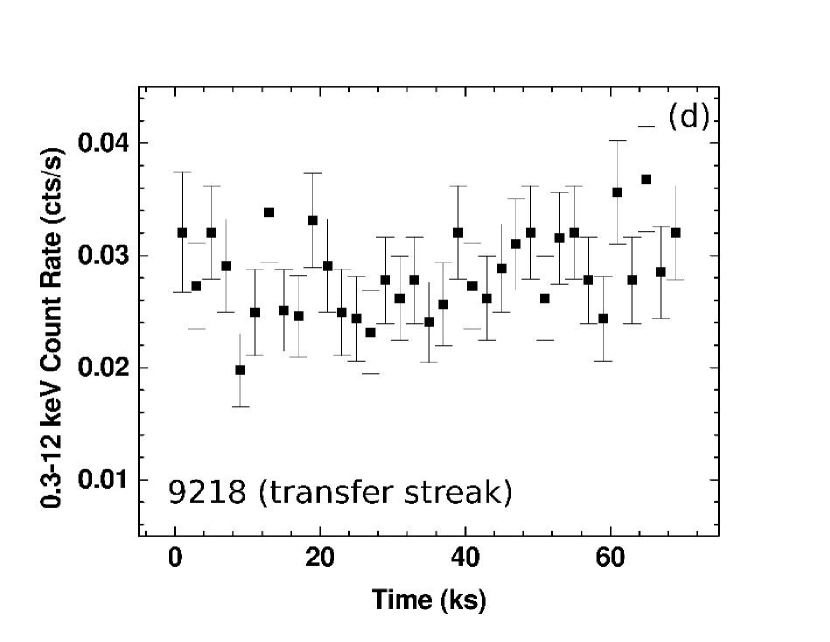
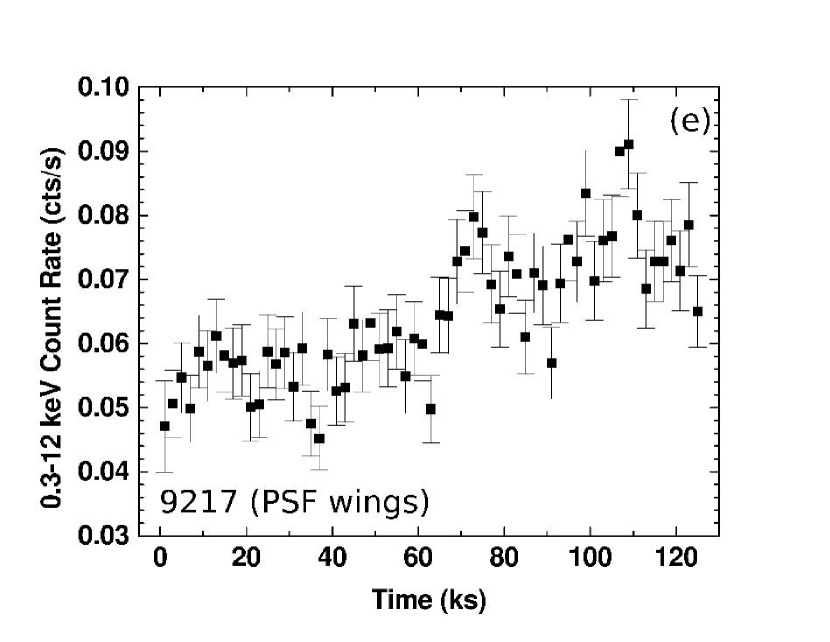
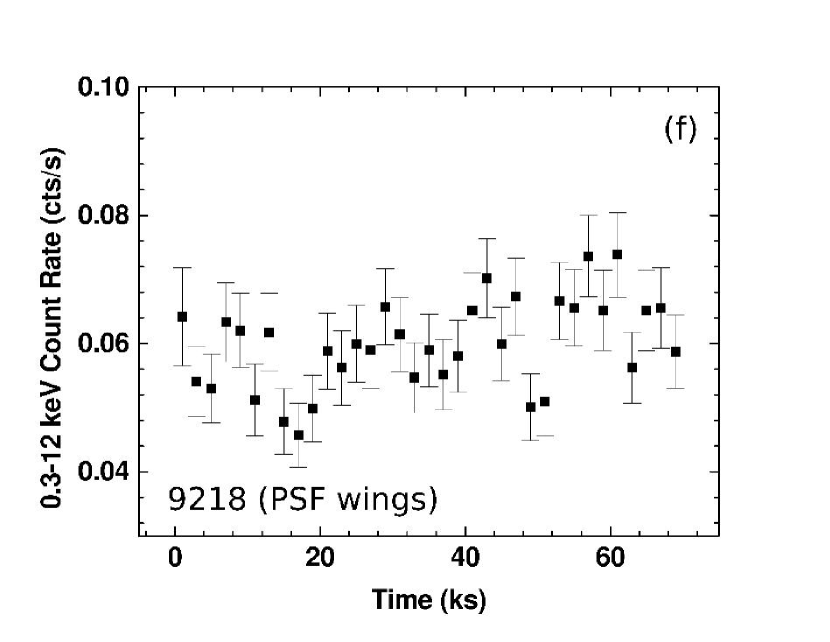
Figure 2 shows the resulting light curves (0.3–12 keV) of the nucleus for both ObsIDs. There is a 5% decrease in count rate over 10 ks during the second part of ObsID 9217. At first glance it may reflect a real decrease of the intrinsic source flux, due to enhanced obscuration of the nucleus as seen in some other Seyfert galaxies (e.g., Mrk 766, Turner et al. 2006; NGC 1365, Risaliti et al. 2009a,b). However, it is known that the relationship between the source flux and the ACIS count rate is non-linear for a bright source due to heavy pileup. An increased source flux may result in a reduced count rate, causing more severe pileup (sometimes a hole in the center of a bright source). We need to be aware of this possibility, and the following checking is applied.
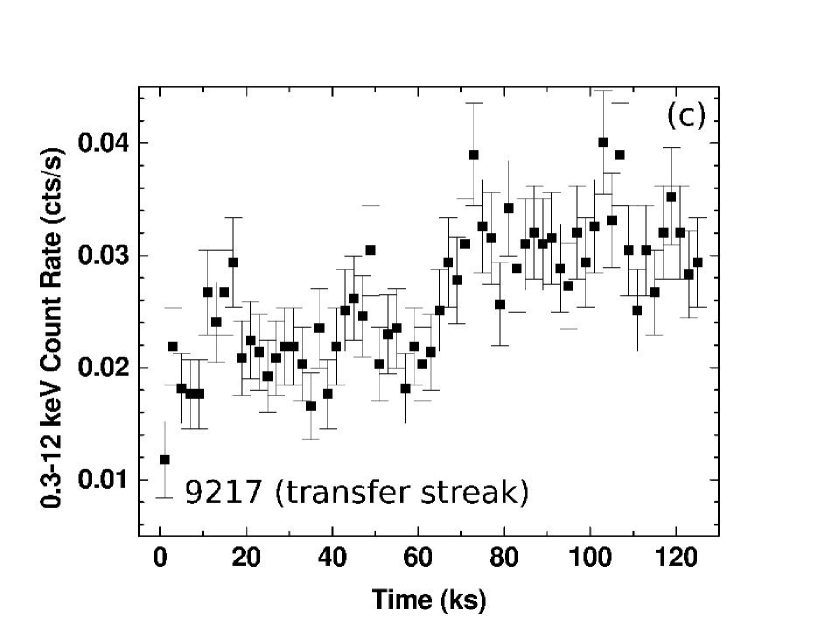
The events from CCD readout streaks are not affected by the pile up, because of the very short “frame time” (40s to clock out electrons from one row to another) and the spreading of photons over a larger area. Using CIAO tool acisreadcorr888Seehttp://cxc.harvard.edu/ciao/threads/acisreadcorr/index.html. With subarray observations, the readers are reminded that there is a known bug in the current version of acisreadcorr requiring modify the BACKSCAL header keyword., the out-of-time source events can be identified with a STATUS value. Light curves were extracted for these unpiled photons in the ACIS readout streak and shown in Figure 2. There is a 50% increase in source count rate ks after the starting of ObsID 9217, at the time of the apparent decrease in the PSF core count rate. To compute the source count rate from the readout streak, we used the formula in Marshall et al. (2005) for the accumulated exposure of a readout streak (), giving a s for ObsID 9217 and s for ObsID 9218. The inferred source count rate is 2.3 cps and 3.5 cps for the first and second part of ObsID 9217, respectively, and 3.2 cps during ObsID 9218.
A second check is offered by the wing of PSF which contains very little encircled energy and hence a low count rate spread over a much larger area. Therefore the events in the PSF wings are not affected by pileup. We extracted light curves from a ring region centered on the nucleus (with an inner radius of 5 pixel and an outer radius of 9 pixel; Figure 1) in the outer nucleus region, which are shown in Figure 2. Based on the encircled energy fraction, we expect the extracted count rate of the outer PSF region represents approximately 2% of the total count rate level (see § 3.2). The source count rate inferred from this method is 2.8 cps and 3.6 cps for the first and second part of ObsID 9217, respectively, and 3.0 cps during ObsID 9218, which indicates that the observed lower count rate in the first part of ObsID 9217 is due to an intrinsic low incident flux rather than the response of pileup to a higher flux.
The readout streak and PSF wings count rates agree well. The discrepancy between the observed count rates and these inferred true count rates indicates a significant pileup. PIMMS simulation indicates that the PSF core suffers from 30–50% pileup, which is consistent with the pileup fraction estimated from the spectral fitting in the following section.
3.2 Diagnostic Analysis with Empirical Spectral Modeling
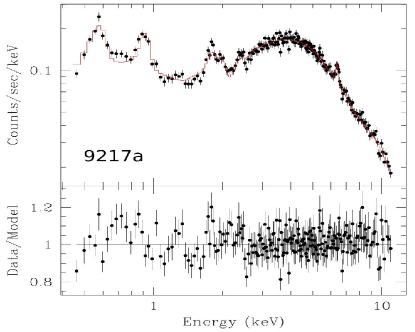
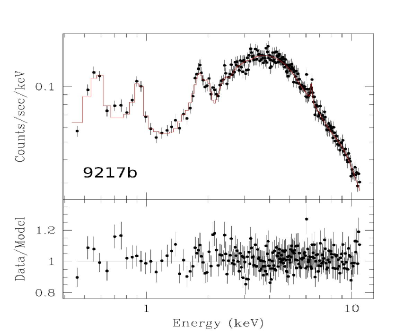
A pileup mitigation method, described in great details in Davis (2001), is widely used and has been implemented in the spectral modeling tools such as XSPEC (Arnaud 1996), Sherpa (Freeman et al. 2001). The effectiveness of the model is demonstrated by recovering identical spectral parameters from the moderately piled zeroth-order data of quasar S5 0836+7104 to those derived from unpiled HETG grating spectrum (Davis 2001). Next we use the Davis (2001) pileup model to derive spectral parameters from fitting the piled PSF core spectra and compare with unpiled spectra extracted from PSF wings and transfer streak. To apply the pileup model, it is important to analyze spectra extracted from observations with nearly constant count rate. We therefore divided ObsID 9217 into two segments separated at ks based on the light curve (Figure 2), dubbed 9217a (high PSF core count rate) and 9217b (low PSF core count rate).
Ogle et al. (2000) and Yang et al.(2001) both found that a hard power law absorbed by a large column and a soft power law absorbed by the Galactic column ( cm-2, Murphy et al. 1996) are needed to describe the continuum of NGC 4151 nucleus. We adopt the same dual power law model in the spectral fitting (hereafter, and is the photon index for the soft and the hard absorbed power law component, respectively). Following Yang et al. (2001), narrow gaussian features are also added to fit the most prominent emission lines in the spectra. An emission line feature at 6.37 keV is identified with a FeK line from neutral or weakly-ionized material.
A. Modeling the PSF Core Spectra with Pileup – Source and background Pulse Invariant (PI) spectra and the associated Auxiliary Response File (ARF) and Redistribution Matrix File (RMF) files were generated with CIAO tool specextract. A circular extraction region with a radius of 3 ACIS pixels () was used, which corresponds to a PSF fraction of 90% (1.49 keV). The spectra were grouped to a minimum of 25 counts per bin to use statistics. Fitting statistics were evaluated including channels above 0.3 keV, up to 11 keV. Davis (2008, 6th CIAO workshop) emphasized that, it is important to include the available photons in the hardest energy range, even where Chandra’s HRMA has little effective area. As these photons can only come from piled low energy photons, they are particularly useful to constrain the pileup model.
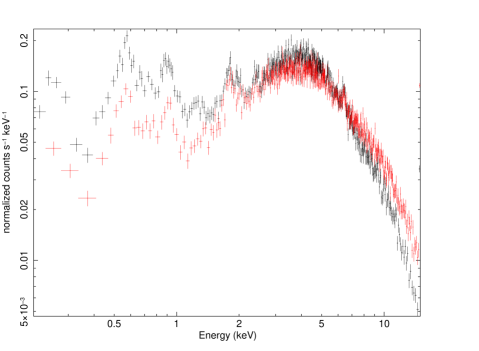
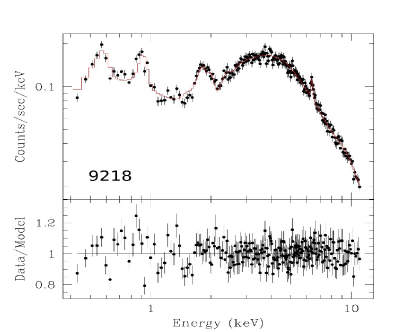
If we blindly fit the apparently piled spectra with standard model such as a simple two power-law components, we get an extremely flat photon index for the hard component ( for the soft component). A similar hard photon index was derived in the piled PSF core spectra in Yang et al. (2001). When the pileup model (jdpileup, Davis 2001) is applied, the corrected, still rather flat spectral indices are = (90% confidence interval for one interesting parameter), , and for ObsIDs 9217a, 9217b, and 9218, respectively. The resulting fits are shown in Figure 4.
B. Modeling the PSF Wings Spectra – Alternatively, we can extract unpiled photons from outer region at larger radial distance from the bright nucleus. We adopted the same extraction annulus that was used to extract light curve of the PSF wings (see § 3.1). Because of the luminous nucleus, the extracted spectrum still have enough photons to determine spectral slope.
To model the spectra extracted from events only in the outskirts of the PSF, we need to correct the ARF for the extraction region of a partial PSF coverage. This correction is energy dependent and can be done through simulation using Chandra HRMA ray-tracing simulator (ChaRT999http://cxc.harvard.edu/chart/) and MARX101010http://space.mit.edu/ASC/MARX/. The detector position (DETX, DETY) of the nucleus was converted to the set of (off-axis angle) and (rotation angle) and input to ChaRT, then the ray-tracing was used with our observation settings to create an event file with MARX. The simulated events from the annulus region were extracted, and a correction function can be derived111111Details including verification of this procedure are available at http://www.astro.isas.jaxa.jp/$∼$tsujimot/arfcorr.html. We find photon index =, , and for ObsIDs 9217a, 9217b, and 9218, respectively. The resulting fits with absorbed power law models and emission lines are shown in Figure 5.
We caution that the extended emission contributes to the extracted annulus when modeling the PSF wings spectra. To quantify this contamination, first, we made use of the PSF deconvolved HRC data (Wang et al. 2009) and compared the extended counts in the extracted annulus to the nucleus. Second, we took the readout streak spectra as the nuclear spectra, and simulated the nucleus as a point source with ChaRT and MARX. The extracted counts from the simulated events (PSF wings) were compared with the observed wing region (PSF wings and the extended soft emission). Both indicate the contamination from extended emission is 10% of the PSF wings and insignificant.
C. Modeling the Transfer Streak Spectra – To verify the results from the pileup model, we extracted source spectrum from the ACIS readout streak. Following the prescription of Smith et al. (2002), in calculating the effective area and the detector response we assumed that the events in the transfer streak originated at the on-axis source position. Similar approaches can be found in analysis of Chandra/ACIS observations of NGC 6251 (Evans et al. 2005) and NGC 2992 (Colbert et al. 2005). The X-ray spectra were extracted using photons flagged as source events by acisreadcorr. The photon index from the best-fit model is =, and for ObsIDs 9217a, 9217b and 9218, respectively. The resulting fits with simple absorbed power law models and emission lines are shown in Figure 6.
The fitting parameters of interest for the source spectra extracted using the three different methods are summarized in Table 1. Both indirect measurements of the nucleus spectra are consistent with the results of fitting the PSF core directly with the pileup model (e.g., for ObsID 9218, , , ). Even flatter spectral states have also been reported in previous unpiled Chandra observations (, Ogle et al. 2000; , Yang et al. 2001), derived using the same spectral model. This gives us confidence to attempt fitting the PSF core with more physically meaningful components while applying the pileup correction, as described in the next section.
4 Spectral Modeling with Reflection and Absorption
The most notable result from the spectral analysis above is the flat power law that characterizes the 2–10 keV spectrum of the NGC 4151 nucleus. As the circumnuclear region of an AGN is a complex mixture of emitting and absorbing materials (see Turner & Miller 2009 for a review), parameters from the satisfactory fitting with the simple phenomenological model adopted in § 3.2 does not necessarily represent the intrinsic spectral properties of the nucleus and instead should be used with caution to further interpret the spectral variability.
The variable X-ray spectra of AGN (low-flux, hard-spectrum state and high-flux, soft-spectrum state) have been interpreted with more complex models than simple power-law (e.g., Schurch & Warwick 2002; Miller et al. 2007). Reprocessing of some of the X-ray continuum by optically thick material in the accretion disk can create the “Compton reflection hump”. If the intrinsic flux of the continuum decreases and the hard reflection component remains constant (e.g., there is a long delay before the reflection component responds to the lower flux due to the light travel time), a low flux state with a hardened spectrum of the nucleus can be observed.
Almost indistinguishable from the reflection model, the same low flux, hard spectrum state can be observed if a dense cloud partially obscures the continuum source. Varying covering factor of partial covering cloud(s) in the line of sight can thus also account for the spectral variability (e.g., Risaliti et al. 2009a). Next, we try to develop more physical description of the Chandra spectra with reflection and partial covering components.
4.1 Modeling the Reflection Component
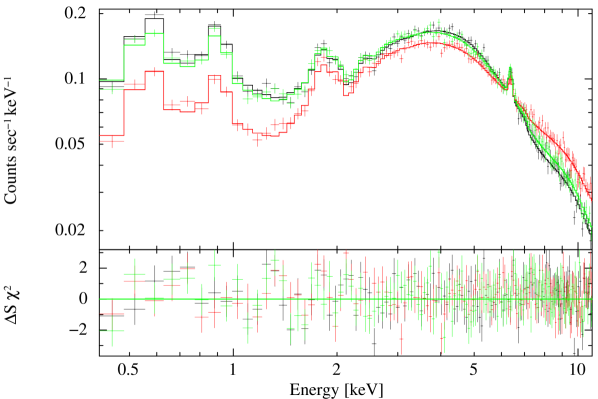
The PSF core spectra were fitted with an absorbed power law continuum and an additional steep power law to model the soft excess. A Compton reflection component is added with the PEXRAV model (Magdziarz & Zdziarski 1995), with parameter rel_refl, the reflection scaling factor, fixed at . The hard power law component and the reflection component have the same spectral slope. The same narrow gaussian components as in previous empirical fitting (§ 3.2) were added to improve the fit of the emission line features. All spectra in the three segments of observations are fitted simultaneously. Since the Compton reflection component is not expected to vary on the time scale of our observation, the photon indices of the reflection component in the three segments are linked and left free to vary. The ratio between the normalization of reflection component and the normalization of continuum component allows us to evaluate the strength of reflection. The spectral fitting parameters of interest are summarized in Table 2, and the resulting fits for the three observation segments are shown in Figure 7. The best-fit photon index of the hard continuum is with this model (/d.o.f=2260/2033).
Since most of the nuclear soft emission seen by ACIS originates from blended unresolved lines (see the Chandra/HETG spectrum, Ogle et al. 2000), alternatively we attempted another model with the HETG emission line data frozen to the measurements in Ogle et al. (2000) plus varying continuum components. This may be more accurate for the soft emission affected by the pileup, assuming that the emission line spectrum is unchanging. The spectral fitting parameters of interest are also summarized in Table 2, and the is very close to the above simple model. The resulting goodness of fit /d.o.f is 2380/2033.
4.2 Effect of Partial Covering
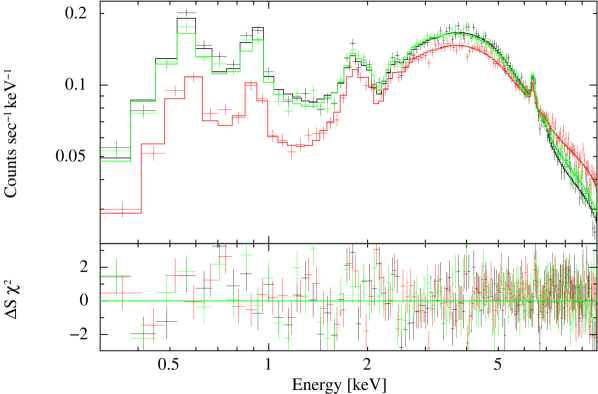
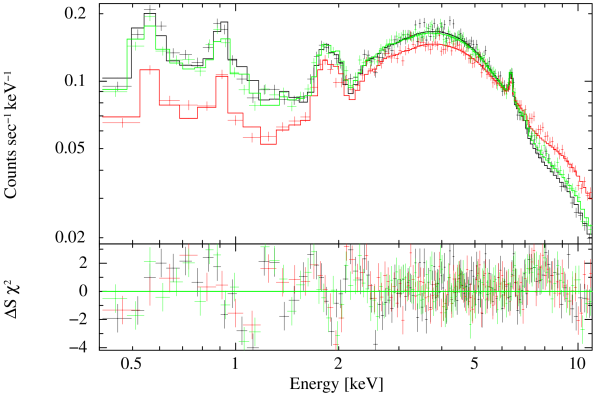
Complex variable X-ray absorption associated with NGC 4151 has long been identified (e.g., Ives et al. 1976, Weaver et al. 1994a,b, Schurch & Warwick 2002, Kraemer et al. 2005, Puccetti et al. 2007). Partial covering of the continuum source obscures a fraction of the soft continuum and hence gives the appearance of a much harder spectrum. Building on the above model, we add a partial absorber (PCFABS121212http://heasarc.gsfc.nasa.gov/xanadu/xspec/manual/XSmodelPcfabs.html) to the uniformly absorbed hard power law continuum component. Again all three segments are fitted simultaneously. The absorbing column densities of the partial obscuring cloud are linked and free to vary. This constrains the variation of the covering factor. The spectral fitting results with the partial covering component are summarized in Table 3. The model reproduces the spectra well, with the best-fit close to the “canonical” value for Seyfert 1 AGNs (=2219/2029). The covering factor varied between 37% and 49% during our observation, causing a decreased flux in ObsID 9217a.
Using the alternative model with frozen HETG lines (§ 4.1) does not significantly change the fitting results. The spectral fitting parameters of interest are also summarized in Table 2, and the resulting goodness of fit /d.o.f is 2372/2029. The is very close to the above simple model. There are similar variations in the covering factors.
4.3 Modeling an Ionized Absorber
Given that mostly the low-energy part of the spectrum is subjected to the “warm absorber” and that the current data are considerably affected by pileup, we did not attempt fitting with complex photoionization models to the CCD resolution ACIS spectra. We have replaced the partial covering absorber in § 4.2 with an XSPEC model component ABSORI131313http://heasarc.gsfc.nasa.gov/docs/xanadu/xspec/manual/XSmodelAbsori.html (Done et al. 1992, Zdziarski et al. 1995) assuming absorption from a simple ionized absorber present in the line of sight to the active nucleus. Again the soft emission is modeled with a power law continuum with fixed HETG lines. The modeling is further simplified by freezing the photon index of the hard component at (Schurch & Warwick 2002). The resulting fit is shown in Figure 9, and the fitting parameters are summarized in Table 4 (goodness of fit ). The ionization parameter of the warm gas, , is in agreement with the results in De Rosa et al. (2007) and Armentrout et al. (2007).
5 Revisiting the ASCA Long-Look
It is interesting to note that we have again observed NGC 4151 in a relatively low state ( erg s-1 cm-2), similar to two earlier Chandra Observations (Ogle et al. 2000, Yang et al. 2001). XMM-Newton also observed NGC 4151 three times December 21-23, 2000. The absorption corrected 2–10 keV flux was erg s-1 cm-2 (Schurch et al. 2003), indicating the nucleus was in a relatively low-flux state similar to that observed with Chandra in Ogle et al. (2000) and Yang et al. (2001).
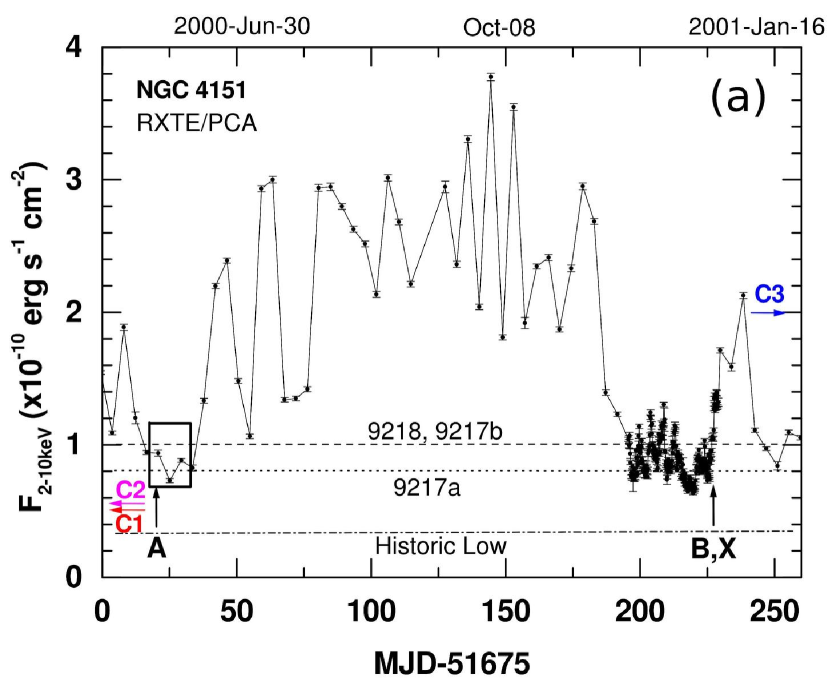
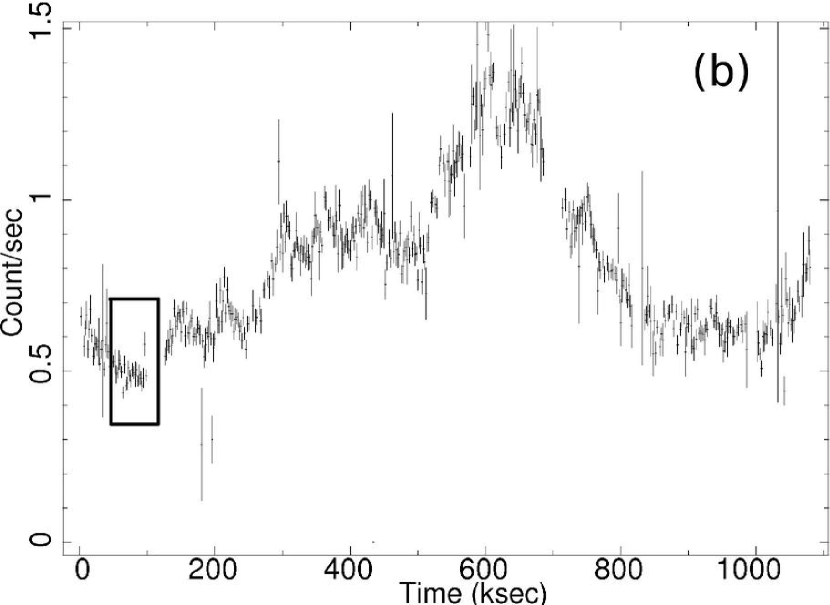
We then examined the “long-look” observation (1 Ms) of NGC 4151 with ASCA during May 12 to 25, 2000. Figure 10a shows the RXTE/PCA light curve during the monitoring of NGC 4151 in 2000 (see Markowitz et al. 2003). The RXTE light curve shows that the long ASCA observation caught the source in an overall low state. In addition, the ASCA light curve shows significant variations on time scales of a few hours. In order to investigate the nature of the lowest states, we extracted a spectrum from the whole observation, and from a 60 ks interval corresponding to the minimum in the light curve (Figure 10b). The data reduction has been performed following the standard procedure indicated by the ASCA team141414http://heasarc.gsfc.nasa.gov/docs/asca/ahp_analysis.html. We used screened events provided by the ASCA archive for the GIS intruments to extract the light curves and spectra from a circular region with a radius. The background was extracted from a source free region in the same field of view. The instrumental response files were created using the dedicated tools within the FTOOLS package151515http://heasarc.nasa.gov/docs/software/ftools/.
We analyzed both the total and the low-state spectra adopting two different models for the hard (2 keV) emission: a simple absorbed power law, and the partial covering+reflection model described in § 4.2. In all cases we obtained a statistically acceptable result, with for the first model, and for the second one. Given the low value of the reduced in both cases, we cannot estimate whether the partial-covering fit is better than the simple power law one only based on the global statistics of the two fits.
The analysis of the best fit spectral parameters provides interesting insghts on the nature of the X-ray emission: for both spectra, the partial covering model provides acceptable values for the continuum slope ( for the total spectrum, for the low-state spectrum). The intensity of the reflection component is R=10.5 for the total spectrum, and R=2.5 for the low state spectrum. This suggests that the reflected component seen in the low state spectrum is the echo of an on average higher emission, consistent with the RXTE and ASCA light curves. The simple power law model provides a “normal” value of the continuum slope for the total spectrum (), but an extremely flat value for the low state spectrum (). This confirms our interpretation of the Chandra spectra, and in particular that (1) harder spectra are associated to lower flux states, and (2) that the flat observed emission is not due to an intrinsic change in the continuum shape, but to absorption effects and/or to the higher relative weight of the reflection component in low intrinsic flux states.
6 Discussion
The overall picture of the observed source variation is now improved: counterintuitive to the apparent light curve, we actually witnessed the source going from a moderate count rate (ObsID 9218) to a low count rate (ObsID 9217a) and back to a high count rate (ObsID 9217b). As noted in § 4, the interpretation of the physical origin of this variation is not straightforward and depends on the spectral modeling.
6.1 An Intrinsic Flat Power Law Spectrum?
There have not been any reports for Seyfert galaxies with spectral indices as flat as , unless they are in the Compton thick regime. The earlier Chandra result of for NGC 4151, a clear-cut Seyfert 1 galaxy was noted to be “unusual” (Yang et al. 2001), but not further discussed by Ogle et al. (2000) or Yang et al. (2001). We note that a few cases of low spectra exist in the literature. For example, a was measured for a radio loud quasar PKS 2251+113 in the ASCA quasar sample (Reeves & Turner 2000). Strateva et al. (2008) reported that one of the broad double-peaked Balmer line emitting quasar SDSS J2125-0813, may also have an unusual flat X-ray spectrum .
If the measured with the empirical, uniformly absorbed two power law components model indeed represents the slope of the intrinsic NGC 4151 continuum in the low state, it may have some implications for the accretion flow onto the central black hole. For example, a radiatively inefficient accretion flow (RIAF; for reviews, see Narayan et al. 1998; Quataert 2001) is capable of producing a flat hard state X-ray spectrum. Using a low-flux state 2–10 keV luminosity erg s-1, we derive a erg s-1 for NGC 4151 from the bolometric correction derived in Marconi et al. (2004). Taking the latest measurement of the black hole mass M⊙ for NGC 4151 from Bentz et al. (2006) yields an Eddington luminosity of erg s-1, which implies the central engine of NGC 4151 is radiating at a relatively low efficiency, . The ratio indicates that the accretion rate of the NGC 4151 black hole is close to the critical value (Narayan et al. 1998, Yuan 2007) for a RIAF.
However, a more plausible interpretation is that the extreme flat slope is the outcome of over-simplified modeling. At least, the value of is known to depend strongly on the treatment of the complex absorbers (Weaver et al. 1994a, Zdziarski et al. 2002). We have verified that the physically meaningful models (reflection model discussed in § 6.2 and partial covering model discussed in § 6.3) also can fit the readout streak spectra well (, for the reflection model, and , for the partial covering model), yielding consistent values derived from the piled spectra but with poor constraints on the fitting parameters due to much less counts in the readout streak spectra and complexity of the models.
6.2 Compton Reflection Component
Although the reflection model (§ 4.1) fits the spectrum well, the problem of the flat spectral slope remains with the derived . The amount of reflection is characterised by , where is often observed for Seyfert 1s, meaning the illuminated infinite slab extends a solid angle of to the central source. It is also referred to as the ratio of the reflected intensity relative to the expected intensity from the surface subtending to the continuum source. The reflection seems unusally large, =1.5–2.7, while the Fe line EW is relatively small eV, inconsistent with the large of the Fe fluorescence line ( keV) expected for strong reflection (e.g., Guilbert & Rees 1988, George & Fabian 1991).
The Fe line flux is also constant within the errors during our observation, compared to the variable continuum. This result is easily explained in the standard cold reflection model where the narrow FeKα line is produced far from the primary X-ray source (e.g. from the putative obscuring torus) and so is not expected to vary rapidly. As NGC 4151 shows frequent “flaring” in the X-ray continuum light curve, the large observed here may result from a response to a previous X-ray flare produced in the inner disk region before the start of our Chandra observations. The response to changes in the X-ray flux by the illuminated gas could even take longer than the light-crossing time between the primary X-ray source and the reflecting material (Nicastro et al. 1999, Nayakshin & Kazanas 2002). For example, Liu et al. (2010) have analyzed SUZAKU monitoring of NGC 5548 and found no strong correlation between Fe flux and the continuum.
In particular, the reflector could be the inner wall of a torus (Antonucci 1993; Krolik et al. 1994) a few hundred light-days away from the nucleus (Suganuma et al. 2006). The inner size of a dust torus in NGC 4151 was measured as days based on the lag time between the optical and near-infrared light curves (Minezaki et al. 2004). The observed narrow Fe fluorescent line is expected, and is unresolved with Chandra/HETG ( km s-1, Ogle et al. 2000). The high signal-to-noise (S/N) XMM-Newton/EPIC spectra suggest a broader intrinsic width ( eV, km s-1, Schurch et al. 2003). Nevertheless, these values are consistent with a distant reflector. Therefore at short time scale (hours to days), correlation between the continuum flux, the reflection continuum and the iron line emission is unlikely to be found.
In Figure 11 we show the long-term variation of the Fe line flux based on earlier X-ray observations from ASCA, BeppoSAX, Chandra, XMM-Newton reported in the literature. The Fe in our observation ( photons cm-2 s-1) is consistent with that measured from the XMM-Newton spectrum ( photons cm-2 s-1; Schurch et al. 2003) and slightly lower than the earlier Chandra results ( photons cm-2 s-1; Ogle et al. 2000). Ogle et al. (2000) attributed nearly 70% of Fe line flux to the kpc scale extended X-ray emission. We will examine this claim more carefully in our study of the ENLR and compare with the lower spatial resolution -Newton study (Schurch et al. 2004). Significant line intensity variation is only seen at time scale longer than 1 year, consistent with an origin from a distant reflector and the result from RXTE monitoring (Markowitz et al. 2003). As suggested in Markowitz et al. (2003), the variation of Fe observed with RXTE may still trace the intrinsic continuum variation in the long term.
Other means of obtaining a larger are possible, such as: the light-bending model which takes into account relativistic aberration (Ballantyne et al. 2003); a peculiar inner disk geometry with deep funnel; or a partly hidden continuum that is only seen by the reflector (see Turner & Miller 2009 for review on strength of the reflection component). However, these models apply to X-ray reprocessing by a Compton-thick inner accretion disk, which is inconsistent with the fact that neither do we see a broad Fe line, nor a strong Fe line with large EW. It is also inconsistent with the low Eddington ratio of NGC 4151.
Nevertheless, a considerable number of observations of Seyfert 1 galaxies have yielded values (e.g., Mrk 335, Bianchi et al. 2001, Larsson et al. 2008; Mrk 841, Petrucci et al. 2002). Notably, Miniutti et al. (2007) obtained for MCG–6-30-15, which shows the broad iron line and reflection hump expected from X-ray reflection in the innermost regions of an accretion disk. Terashima et al. (2009) found for the reflection component in NGC 4051 with a modest eV for FeK line, similar to the NGC 4151 results. They suggest that the large reflection fraction is due to a delayed reflected emission to the variations between high-flux state and low-flux state.
6.3 Partial Covering
To evaluate whether the partial covering component is required by the Chandra data, we performed an F-test comparing the statistics for the reflection model ( = 2380/2033 = 1.171) and the partial covering model ( = 2371/2029 = 1.169) based on the spectral models with fixed soft emission lines. The F-test statistic gives a probability 14% that suggests only a marginal improvement over the simpler reflection-only model. Nevertheless the advantage of the spectral model consisting of Compton reflection component and an additional partial covering component is that it provides a spectral slope (§ 4.2) well within the typical values of Seyfert 1 AGNs. This suggests that we do not need to invoke an exotic explanation of the apparent flat spectrum. The spectral variations among the three segments could be attributed simply to a 10% change in covering fraction of a high column absorber towards NGC 4151, although a variation in the “intrinsic” continuum is equally possible (e.g., variation of Compton-thick materials), given the uncertainties in the fitted values. Fiore et al. (1990) argued that the variation of the NGC 4151 spectral slope is intrinsic. However, De Rosa et al.(2007) found the spectral variability is small above 10 keV () using BeppoSAX data covering 0.1–200 keV.
The presence of a high column density ( cm-2) X-ray absorber in the line of sight towards the NGC 4151 nucleus is not surprising and observed in previous studies. Whitehouse & Cruise (1985) reported a 2-ks dip in the EXOSAT light curve of NGC 4151, perhaps related to occultation by passage of a star across the line of sight towards the black hole. Puccetti et al. (2007) also concluded that the absorption variability plays a crucial role in the observed flux variability in NGC 4151. In another rare case, Risaliti et al. (2007, 2009b) witnessed occultation by a Compton-thick cloud crossing the line of sight towards NGC 1365.
We note that the spectral study of NGC 4151 (De Rosa et al. 2007) included the same model components as ours, but introduced a photoionized gas component as warm absorber to the partial covering cold absorber. Their results show that, the column density of the warm absorber is consistent with being constant and only changes over a time scale longer than months. It is the covering fraction of the cold absorber (varying on time scale of days) that dominates the spectral variability. Accordingly, the ionization parameter increases when the covering fraction becomes lower, as the warm absorber exposed to more continuum (see also Schurch & Warwick 2002). The presence of the warm absorber will be discussed next. Our results (Table 3) quantitatively agree with what De Rosa et al. (2007) find (e.g., photon index of the hard power law , column density of the partial covering absorber cm-2, variations in the covering fraction =0.48–0.73 during their observation in 1996).
6.4 Presence of a Warm Absorber
The presence of highly ionized gas close to AGN becomes evident in recent observations by Chandra, XMM-Newton, and SUZAKU, where high resolution spectra have shown the presence of highly ionized absorber as well as lower ionization gas (e.g., Ogle et al. 2000; Kraemer et al. 2005; Young et al. 2005; Miniutti et al. 2007; Krongold et al. 2009).
Kraemer et al. (2005) revisited NGC 4151 in 2002 in a relatively low state (25% of the historic maximum), again with the HETG, focusing on the intrinsic X-ray absorption. They found that, comparing to the 2002 data, a combination of higher column density and lower ionization of the intervening gas may explain the HETG spectrum in 2000 with an assumed (see also Armentrout et al. 2007). The spectral model consists of five different absorption components with various radial distances, filtered ionizing continuum, and covering factor. It is clearly not feasible to apply such complex models to our piled spectra.
Our simple ionized absorber fit to the lower-resolution ACIS CCD spectra suggested an ionization parameter , which is comparable with the values in De Rosa et al. (2007). The variations of the ionization parameters during the three observation segments hint that the spectral variability may be related to the warm absorber responding to the varying ionizing luminosity (Schurch & Warwick 2002). We note that the deep absorption edges from ions like OVII and NeIX will be blended together at low resoltuion and result in a smooth curvature (Kraemer et al. 2005). This may explain why our simpler reflection and partial covering models provide good description of the ACIS spectra. Although our reflection and partial covering models using neutral absorbers are over-simplified given the presence of warm absorber evident in the HETG spectra, they are consistent with the ACIS data and not conflicting with the HETG results. First of all, the warm absorber model in Kraemer et al. (2005) focused on reproducing the spectral slope in the hard band (1.5 keV), and excluded fitting the soft energy range because of the strong emission lines. This leaves room for contribution from a neutral absorber or a partial covering absorber (e.g., Schurch & Warwick 2002, De Rosa et al. 2007). In a separate XMM-Newton RGS grating study of NGC 4151, Armentrout et al. (2007) modeled the soft emission lines with three photoionized components, with covering fractions ranging between 0.03–0.70. Secondly, it is possible that the amount of low ionization gas can be extremely variable on short time-scales, as noted in Kraemer et al. (2001). Although limited by the signal to noise ratio, studies of short term spectral variability with high resolution grating spectra will be interesting.
6.5 Constraints on the X-ray Emission and the Obscuring Clouds
If the observed X-ray light curve reflects real variation of the intrinsic continuum of NGC 4151 on time scale of 10 ks, it is consistent with the rapid X-ray variability previously reported (Elvis 1976, Lawrence 1980) and also seen in other local Seyfert galaxies (e.g., Lawrence et al. 1985; Mushotzky et al. 1993; Nandra et al. 1997). This variability time scale constrains the X-ray emission region to be small (, where is Schwarzschild radius; see Turner & Miller 2009), assuming M⊙ for NGC 4151 (Bentz et al. 2006), thus likely close to the central supermassive black hole.
If the lower count rate and higher covering fraction during ObsID 9217a is due to motions of clumpy absorbers, then, following Risaliti et al. (2002), we can constrain the distance of the discrete cloud from the central black hole assuming that the obscuring clouds are moving with Keplerian velocities, in terms of the variations in . Adopting M⊙, cm-3 (typical of broad emission line region [BELR] clouds), day (duration of ObsID 9217a), and cm-2, we derive ( light-day) from Equation (6) of Risaliti et al. (2002). This is consistent with the inferred BELR size ( light-day) from reverberation mapping with Hβ and HeII 4686 emission lines (Peterson & Cota 1988) and the location of obscuring clouds derived from BeppoSAX observation (Puccetti et al. 2007).
7 Conclusions
The deep 200 ks Chandra observation of the Seyfert 1 nucleus in NGC 4151 was analyzed to understand its complex spectral variability, in particular the unusally flat photon index reported from earlier observations. We find:
(1) The 2–10 keV flux of the nucleus varied from erg s-1 cm-2 (ObsID 9218 and ObsID 9217a) to erg s-1 cm-2 (ObsID 9217b), resulting in a non-linear count rate variation of opposite sign because of significant pileup.
(2) With pileup corrected spectral fitting, we are able to recover the spectral parameters and find consistency with those derived from unpiled events in the ACIS readout streak and outer region of the bright PSF core.
(3) The low flux segment shows a hard photon index similar to that seen in the historical low state for a simple power-law fit. More complex, physically meaningful models are attempted and provide good fits to the piled spectra, including a Compton reflection model, the reflection model subjected to a partially covered absorber, and the reflection model subjected to an ionized absorber.
(4) The observed flat spectrum and its variability can be interpreted as due to an intrinsically varying continuum with respect to an underlying Compton reflection component, or a variable X-ray absorber partially covering the continuum source. Including the partial covering absorber provides only a marginal improvement over the simpler reflection-only model, nevertheless it gives a continuum photon index that is typical of Seyfert 1s.
(5) If the absorption model is correct, the size of X-ray emission region is constrained , and the X-ray absorber is located at from the nucleus, possibly associated with the BELR clouds.
(6) If instead the reflection-only model is correct, the presence of a constant reflection component with respect to the rapidly flaring continuum of NGC 4151 implies the reflector is located far from the nucleus, consistent with the absence of broad FeK fluorescence line.
References
- Antonucci (1993) Antonucci, R. 1993, ARA&A, 31, 473
- Armentrout et al. (2007) Armentrout, B. K., Kraemer, S. B., & Turner, T. J. 2007, ApJ, 665, 237
- Arnaud (1996) Arnaud, K. A. 1996, Astronomical Data Analysis Software and Systems V, 101, 17
- Ballantyne et al. (2003) Ballantyne, D. R., Vaughan, S., & Fabian, A. C. 2003, MNRAS, 342, 239
- Bentz et al. (2006) Bentz, M. C., et al. 2006, ApJ, 651, 775
- Bianchi et al. (2001) Bianchi, S., Matt, G., Haardt, F., Maraschi, L., Nicastro, F., Perola, G. C., Petrucci, P. O., & Piro, L. 2001, A&A, 376, 77
- Clements (1981) Clements, E. D. 1981, MNRAS, 197, 829
- Colbert et al. (2005) Colbert, E. J. M., Strickland, D. K., Veilleux, S., & Weaver, K. A. 2005, ApJ, 628, 113
- Crenshaw & Kraemer (2007) Crenshaw, D. M., & Kraemer, S. B. 2007, ApJ, 659, 250
- Davis (2001) Davis, J. E. 2001, ApJ, 562, 575
- de Rosa et al. (2007) de Rosa, A., Piro, L., Perola, G. C., Capalbi, M., Cappi, M., Grandi, P., Maraschi, L., & Petrucci, P. O. 2007, A&A, 463, 903
- Done et al. (1992) Done, C., Mulchaey, J. S., Mushotzky, R. F., & Arnaud, K. A. 1992, ApJ, 395, 275
- Edelson et al. (1996) Edelson, R. A., et al. 1996, ApJ, 470, 364
- Elvis (1976) Elvis, M. 1976, MNRAS, 177, 7P
- Elvis et al. (1983) Elvis, M., Briel, U. G., & Henry, J. P. 1983, ApJ, 268, 105
- Evans et al. (2005) Evans, D. A., Hardcastle, M. J., Croston, J. H., Worrall, D. M., & Birkinshaw, M. 2005, MNRAS, 359, 363
- Fiore et al. (1990) Fiore, F., Perola, G. C., & Romano, M. 1990, MNRAS, 243, 522
- Freeman et al. (2001) Freeman, P., Doe, S., & Siemiginowska, A. 2001, Proc. SPIE, 4477, 76
- Garmire et al. (2003) Garmire, G. P., Bautz, M. W., Ford, P. G., Nousek, J. A., & Ricker, G. R., Jr. 2003, Proc. SPIE, 4851, 28
- George & Fabian (1991) George, I. M., & Fabian, A. C. 1991, MNRAS, 249, 352
- Guilbert & Rees (1988) Guilbert, P. W., & Rees, M. J. 1988, MNRAS, 233, 475
- Ho (2008) Ho, L. C. 2008, ARA&A, 46, 475
- Holt et al. (1980) Holt, S. S., Mushotzky, R. F., Boldt, E. A., Serlemitsos, P. J., Becker, R. H., Szymkowiak, A. E., & White, N. E. 1980, ApJ, 241, L13
- Ives et al. (1976) Ives, J. C., Sanford, P. W., & Penston, M. V. 1976, ApJ, 207, L159
- Kraemer et al. (2001) Kraemer, S. B., et al. 2001, ApJ, 551, 671
- Kraemer et al. (2005) Kraemer, S. B., et al. 2005, ApJ, 633, 693
- Krolik et al. (1994) Krolik, J. H., Madau, P., & Zycki, P. T. 1994, ApJ, 420, L57
- Krongold et al. (2009) Krongold, Y., et al. 2009, ApJ, 690, 773
- Larsson et al. (2008) Larsson, J., Miniutti, G., Fabian, A. C., Miller, J. M., Reynolds, C. S., & Ponti, G. 2008, MNRAS, 384, 1316
- Lawrence (1980) Lawrence, A. 1980, MNRAS, 192, 83
- Lawrence et al. (1985) Lawrence, A., Watson, M. G., Pounds, K. A., & Elvis, M. 1985, MNRAS, 217, 685
- Liu et al. (2010) Liu, Y., et al. 2010, ApJ in press, astro-ph/1001.0356
- Magdziarz & Zdziarski (1995) Magdziarz, P., & Zdziarski, A. A. 1995, MNRAS, 273, 837
- Markowitz et al. (2003) Markowitz, A., Edelson, R., & Vaughan, S. 2003, ApJ, 598, 935
- Marconi et al. (2004) Marconi, A., Risaliti, G., Gilli, R., Hunt, L. K., Maiolino, R., & Salvati, M. 2004, MNRAS, 351, 169
- Marshall et al. (2005) Marshall, H. L., et al. 2005, ApJS, 156, 13
- Matsuoka et al. (1986) Matsuoka, M., Ikegami, T., Inoue, H., & Koyama, K. 1986, PASJ, 38, 285
- McCollough & Rots (2005) McCollough, M. L., & Rots, A. H. 2005, Astronomical Data Analysis Software and Systems XIV, 347, 478
- Miller et al. (2007) Miller, L., Turner, T. J., Reeves, J. N., George, I. M., Kraemer, S. B., & Wingert, B. 2007, A&A, 463, 131
- Minezaki et al. (2004) Minezaki, T., Yoshii, Y., Kobayashi, Y., Enya, K., Suganuma, M., Tomita, H., Aoki, T., & Peterson, B. A. 2004, ApJ, 600, L35
- Miniutti et al. (2007) Miniutti, G., et al. 2007, PASJ, 59, 315
- Morse et al. (1995) Morse, J. A., Wilson, A. S., Elvis, M., & Weaver, K. A. 1995, ApJ, 439, 121
- Mundell et al. (1999) Mundell, C. G., Pedlar, A., Shone, D. L., & Robinson, A. 1999, MNRAS, 304, 481
- Murray et al. (1997) Murray, S. S., et al. 1997, Proc. SPIE, 3114, 11
- Mushotzky (1984) Mushotzky, R. F. 1984, Advances in Space Research, 3, 157
- Mushotzky et al. (1993) Mushotzky, R. F., Done, C., & Pounds, K. A. 1993, ARA&A, 31, 717
- Nandra & Pounds (1994) Nandra, K., & Pounds, K. A. 1994, MNRAS, 268, 405
- Nandra et al. (1997) Nandra, K., George, I. M., Mushotzky, R. F., Turner, T. J., & Yaqoob, T. 1997, ApJ, 476, 70
- Narayan et al. (1998) Narayan, R., Mahadevan, R., & Quataert, E. 1998, Theory of Black Hole Accretion Disks, 148, eds. Marek A. Abramowicz, Gunnlaugur Bjornsson, and James E. Pringle. Cambridge University Press
- Nayakshin & Kazanas (2002) Nayakshin, S., & Kazanas, D. 2002, ApJ, 567, 85
- Nicastro et al. (1999) Nicastro, F., Fiore, F., Perola, G. C., & Elvis, M. 1999, ApJ, 512, 184
- Ogle et al. (2000) Ogle, P. M., Marshall, H. L., Lee, J. C., & Canizares, C. R. 2000, ApJ, 545, L81
- Osterbrock & Koski (1976) Osterbrock, D. E., & Koski, A. T. 1976, MNRAS, 176, 61P
- Peterson & Cota (1988) Peterson, B. M., & Cota, S. A. 1988, ApJ, 330, 111
- Perola et al. (1986) Perola, G. C., et al. 1986, ApJ, 306, 508
- Petrucci et al. (2002) Petrucci, P. O., et al. 2002, A&A, 388, L5
- Pounds et al. (1986) Pounds, K. A., Turner, T. J., & Warwick, R. S. 1986, MNRAS, 221, 7P
- Puccetti et al. (2007) Puccetti, S., Fiore, F., Risaliti, G., Capalbi, M., Elvis, M., & Nicastro, F. 2007, MNRAS, 377, 607
- Quataert (2001) Quataert, E. 2001, Probing the Physics of Active Galactic Nuclei, 224, 71
- Reeves & Turner (2000) Reeves, J. N., & Turner, M. J. L. 2000, MNRAS, 316, 234
- Risaliti et al. (2002) Risaliti, G., Elvis, M., & Nicastro, F. 2002, ApJ, 571, 234
- Risaliti et al. (2007) Risaliti, G., Elvis, M., Fabbiano, G., Baldi, A., Zezas, A., & Salvati, M. 2007, ApJ, 659, L111
- Risaliti et al. (2009) Risaliti, G., et al. 2009a, MNRAS, 393, L1
- Risaliti et al. (2009) Risaliti, G., et al. 2009b, ApJ, 696, 160
- Schurch & Warwick (2002) Schurch, N. J., & Warwick, R. S. 2002, MNRAS, 334, 811
- Schurch et al. (2003) Schurch, N. J., Warwick, R. S., Griffiths, R. E., & Sembay, S. 2003, MNRAS, 345, 423
- Schurch et al. (2004) Schurch, N. J., Warwick, R. S., Griffiths, R. E., & Kahn, S. M. 2004, MNRAS, 350, 1
- Smith et al. (2002) Smith, R. K., Edgar, R. J., & Shafer, R. A. 2002, ApJ, 581, 562
- Storchi-Bergmann et al. (2009) Storchi-Bergmann, T., McGregor, P. J., Riffel, R. A., Simões Lopes, R., Beck, T., & Dopita, M. 2009, MNRAS, 291
- Strateva et al. (2008) Strateva, I. V., Brandt, W. N., Eracleous, M., & Garmire, G. 2008, ApJ, 687, 869
- Suganuma et al. (2006) Suganuma, M., et al. 2006, ApJ, 639, 46
- Tananbaum et al. (1978) Tananbaum, H., Peters, G., Forman, W., Giacconi, R., Jones, C., & Avni, Y. 1978, ApJ, 223, 74
- Terashima et al. (2009) Terashima, Y., et al. 2009, PASJ, 61, 299
- Turner et al. (2006) Turner, T. J., Miller, L., George, I. M., & Reeves, J. N. 2006, A&A, 445, 59
- Turner & Miller (2009) Turner, T. J., & Miller, L. 2009, A&A Rev., 17, 47
- Ulrich (2000) Ulrich, M.-H. 2000, A&A Rev., 10, 135
- van Speybroeck et al. (1997) van Speybroeck, L. P., Jerius, D., Edgar, R. J., Gaetz, T. J., Zhao, P., & Reid, P. B. 1997, Proc. SPIE, 3113, 89
- Wang et al. (2001) Wang, J.-X., Wang, T.-G., & Zhou, Y.-Y. 2001, ApJ, 549, 891
- Wang et al. (2009) Wang, J., Fabbiano, G., Karovska, M., Elvis, M., Risaliti, G., Zezas, A., & Mundell, C. G., 2009, ApJ, 704, 1195
- Warwick et al. (1989) Warwick, R. S., Yaqoob, T., Pounds, K. A., Matsuoka, M., & Yamauchi, M. 1989, PASJ, 41, 721
- Warwick et al. (1995) Warwick, R. S., Done, C., & Smith, D. A. 1995, MNRAS, 275, 1003
- Warwick et al. (1996) Warwick, R. S., et al. 1996, ApJ, 470, 349
- Weaver et al. (1994) Weaver, K. A., Yaqoob, T., Holt, S. S., Mushotzky, R. F., Matsuoka, M., & Yamauchi, M. 1994a, ApJ, 436, L27
- Weaver et al. (1994) Weaver, K. A., et al. 1994b, ApJ, 423, 621
- Weisskopf et al. (2002) Weisskopf, M. C., Brinkman, B., Canizares, C., Garmire, G., Murray, S., & Van Speybroeck, L. P. 2002, PASP, 114, 1
- Whitehouse & Cruise (1985) Whitehouse, D. R., & Cruise, A. M. 1985, Nature, 315, 554
- Yang et al. (2001) Yang, Y., Wilson, A. S., & Ferruit, P. 2001, ApJ, 563, 124
- Yaqoob & Warwick (1991) Yaqoob, T., & Warwick, R. S. 1991, MNRAS, 248, 773
- Yaqoob et al. (1993) Yaqoob, T., Warwick, R. S., Makino, F., Otani, C., Sokoloski, J. L., Bond, I. A., & Yamauchi, M. 1993, MNRAS, 262, 435
- Young et al. (2005) Young, A. J., Lee, J. C., Fabian, A. C., Reynolds, C. S., Gibson, R. R., & Canizares, C. R. 2005, ApJ, 631, 733
- Yuan (2007) Yuan, F. 2007, The Central Engine of Active Galactic Nuclei, 373, 95, Eds. Luis C. Ho and Jian-Min Wang, ASP Conference Series
- Zdziarski et al. (1995) Zdziarski, A. A., Johnson, W. N., Done, C., Smith, D., & McNaron-Brown, K. 1995, ApJ, 438, L63
- Zdziarski et al. (2002) Zdziarski, A. A., Leighly, K. M., Matsuoka, M., Cappi, M., & Mihara, T. 2002, ApJ, 573, 505


| Fitting | Obs 9217a | Obs 9217b | Obs 9218 | |||||||||
|---|---|---|---|---|---|---|---|---|---|---|---|---|
| Parameter | A | B | C | A | B | C | A | B | C | |||
| PhoIndx | ||||||||||||
| Normalization | ||||||||||||
| Absorption ( cm-2) | ||||||||||||
| PhoIndx | ||||||||||||
| Normalization | ||||||||||||
| Flux (erg s-1 cm-2) | ||||||||||||
| Goodness of Fit () | 641/664 | 96/93 | 44/46 | 614/705 | 133/127 | 97/69 | 619/679 | 123/114 | 55/71 | |||
| Pileup Fraction | 32% | … | … | 41% | … | … | 35% | … | … | |||
Note. — A fixed Galactic column cm-2 is assumed for the first absorption column (Yang et al. 2001). and is the photon index and the normalization for the soft power law component, respectively. , , and is the absorption column, the photon index, and the normalization for the hard power law component, respectively.
|
|
|
|
|
|
|
|
||||||||||||||||||||||||
|---|---|---|---|---|---|---|---|---|---|---|---|---|---|---|---|---|---|---|---|---|---|---|---|---|---|---|---|---|---|---|---|
| (A) | |||||||||||||||||||||||||||||||
| 9217a | 35% | ||||||||||||||||||||||||||||||
| 9217b | 42% | ||||||||||||||||||||||||||||||
| 9218 | 37% | ||||||||||||||||||||||||||||||
| (B) | |||||||||||||||||||||||||||||||
| 9217a | 35% | ||||||||||||||||||||||||||||||
| 9217b | 42% | ||||||||||||||||||||||||||||||
| 9218 | 37% |
Note. — Model (A) allows zero width gaussian emission lines to vary and Model (B) uses gaussian lines frozen to the values measured in the HETG spectra (Ogle et al. 2000).
Note. — and are the absorption column and the photon index for the soft power law component, respectively. The following parameters were fitted simultaneously for all three spectra: (A) cm-2, ; (B) cm-2, , where , and are the absorption column for the hard power law component, the photon index for the hard power law component and for the Compton reflection component, respectively; normalization for the Compton reflection component: (A) ; (B) .
|
|
|
|
|
|
|
|
|
|||||||||||||||||||||||||||
|---|---|---|---|---|---|---|---|---|---|---|---|---|---|---|---|---|---|---|---|---|---|---|---|---|---|---|---|---|---|---|---|---|---|---|---|
| (A) | |||||||||||||||||||||||||||||||||||
| 9217a | 35% | ||||||||||||||||||||||||||||||||||
| 9217b | 42% | ||||||||||||||||||||||||||||||||||
| 9218 | 39% | ||||||||||||||||||||||||||||||||||
| (B) | |||||||||||||||||||||||||||||||||||
| 9217a | 35% | ||||||||||||||||||||||||||||||||||
| 9217b | 42% | ||||||||||||||||||||||||||||||||||
| 9218 | 39% |
Note. — Model (A) allows zero width gaussian emission lines to vary and Model (B) uses gaussian lines frozen to the values measured in the HETG spectra (Ogle et al. 2000).
Note. — and are the absorption column and the photon index for the soft power law component, respectively. The following parameters were fitted simultaneously for all three spectra: (A) cm-2, , and cm-2; (B) cm-2, , and cm-2, where is the column for the partial covering absorber, and are the absorption column and the photon index for the hard power law component, respectively; normalization for the Compton reflection component: (A) ; (B) .
|
|
|
|
|
|
|
|
|
|||||||||||||||||||||||||||
|---|---|---|---|---|---|---|---|---|---|---|---|---|---|---|---|---|---|---|---|---|---|---|---|---|---|---|---|---|---|---|---|---|---|---|---|
| 9217a | 35% | ||||||||||||||||||||||||||||||||||
| 9217b | 42% | ||||||||||||||||||||||||||||||||||
| 9218 | 37% |
Note. — Model uses gaussian lines frozen to the values measured in the HETG spectra (Ogle et al. 2000). and are the absorption column and the photon index for the soft power law component, respectively. The following parameters were fitted simultaneously for all three spectra: cm-2, (frozen) where , are the absorption column for the hard power law component, and the photon index for the hard power law component, respectively. Goodness of fit .