Superconducting phase diagram and FFLO signature in -(BETS)2GaCl4 from rf penetration depth measurements
Abstract
We report the phase diagram of -(BETS)2GaCl4 from rf penetration depth measurements with a tunnel diode oscillator in a pulsed magnetic field. We examined four samples with 1100 field sweeps in a range of angles with the magnetic field parallel and perpendicular to the conducting planes. In the parallel direction, appears to include a tricritical point at 1.6 K and 10 T with a phase line that increases to 11 T as the temperature is decreased to 500 mK. The second phase line forms a clearly defined high field low temperature region satisfying several of the conditions of the Fulde-Ferrell-Larkin-Ovchinnikov (FFLO) state. We show remarkably good fits of to WHH in the reentrant , regime. We also note a sharp angle dependence of the phase diagram about the field parallel orientation that characterizes Pauli paramagnetic limiting and further supports the possibility of FFLO behavior. Unrelated to the FFLO study, at fields and temperatures below and , we find rich structure in the penetration depth data that we attribute to impurities at the surface altering the superconducting properties while maintaining the same crystallographic axes as .
pacs:
74.70.Kn, 74.25.Dw, 74.81.-gI Introduction
Organic conductors provide an excellent platform for researching unconventional superconductivity because they are clean low-dimensional materials whose critical temperatures and fields are accessible, yet their superconducting mechanisms are not yet fully understood. By developing the Tunnel Diode Oscillator (TDO) penetration depth measurement and pulsed field techniques, we aim to discover finer details in the phase diagram of the organics.
The cation BEDT-TSF (bis(ethylene-dithio)tetraselenafulvalene), usually called BETS, is closely related to the commonly studied BEDT-TTF (bis(ethylene-dithio)tetrathiafulvalene), which is shortened to ET, with the innermost four sulfur atoms of ET replaced by selenium to form BETS. The -(BETS)2GaCl4 crystals are needle-shaped and crystalize alongside platelets of -(BETS)2GaCl4, which do not superconduct. Layer spacing for -(BETS)2GaCl4 is 18.58 Å. Kobayashi et al. (1993) A very interesting relationship exists between the title compound and -(BETS)2FeCl4, which becomes an insulator at the title compound’s critical temperature. -(BETS)2FeCl4 also exhibits field-induced superconductivity, and may have an FFLO state of its own.Uji et al. (2001, 2006)
In a quasi-2d layered superconductor, the tunneling current between layers is small, but finite, so the layers act nearly independently, but maintain long-range coherence.Singleton et al. (2002) If the vortices are able to fit between the layers, the orbital limiting field increases dramatically, and superconductivity persists to much higher fields.Klemm et al. (1975); Lee et al. (2002) Barring other limits, when the Zeeman energy of a Cooper pair exceeds its binding energy at the Pauli paramagnetic limit, the pair will align parallel and the sample will no longer superconduct.Clogston (1962); Maki (1966); Hake (1967) We have employed the theory of WHHWerthamer et al. (1966); Collings (1986) to model , taking into account both orbital and Pauli paramagnetic limiting.
Paramagnetically limited materials present interesting possibilities for novel superconducting behavior. In a sample where the orbital limit is significantly larger than the Pauli paramagnetic limit, a large magnetic field may cause the ground state wave function to become spatially modulated. In this case, the Cooper pairs acquire a non-zero linear momentum. This inhomogeneous superconducting state is known as the Fulde-Ferrell-Larkin-Ovchinnikov (FFLO or LOFF) state after the two groups who postulated it independently in 1964.Fulde and Ferrell (1964); Larkin and Ovchinnikov (1964) There have been a number of reports of FFLO behavior in various samples, although none have been definitive. Even so, the organic superconductors remain some of the ripest ground for the search. In the title compound, thermal conductivity measurementsTanatar et al. (2002) show a cusp at the appropriate location in the phase diagram. There are also reports in other organicsSingleton et al. (2000); Smith et al. (2007); Lortz et al. (2007); Cho et al. (2009); Bergk et al. (2009), including some using the same technique we use here. Notably, -(ET)2NH4(SCN)4 does not exhibit any FFLO phase.Coffey et al. (2010) In the heavy fermion superconductor CeCoIn5, specific heat measurementsRadovan et al. (2003); Bianchi et al. (2003) suggested FFLO behavior, and penetration depth studiesMartin et al. (2005) followed. Ref. Aperis et al. (2010) argues for a competition between ordered states that results in a spin density wave. Ref. Koutroulakis et al. (2010) suggests that the SDW may coexist with an FFLO state. The actual behavior is still unclear.
II Experimental details
Single-crystal samples of -(BETS)2GaCl4 were grown using an electrochemical techniqueKobayashi et al. (1993); Montgomery et al. (1993) in 1995–6 and stored for 13 years. We will follow the crystallographic convention that the long axis of the needle grows in the c-direction, and the best conduction occurs in the a-c plane with layers stacked along the b-axis. Samples A and C measured 0.1 mm each along the a- and b-axes and 0.3 mm along the c-axis. Sample D had the same proportions in a slightly larger size. Sample B was slightly wider than A and C along the a-axis, electrically different from the other three, and does not agree with the literature on -(BETS)2GaCl4. It appears to superconduct, but at K and T. We measured Sample D ( K) in a slightly modified experiment and obtained a limited amount of data, all of which was consistent with Samples A and C.
Penetration depth studies of -(BETS)2GaCl4 have been difficult in the past due to the small size of the samples. We redesigned portions of the tunnel diode oscillator circuit to make effective use of standing waves that appear when using high frequencies. We mounted the samples on a 1-axis rotator with resolution and ensuring precise alignment by pulsing the field up and down at a range of angles 0.23∘ apart about the parallel orientation. We oriented the sample on the rotator to apply the magnetic field along the b- or c-axes (Samples A and C) and along the b- or a-axes (Samples B and C). We ran Sample C twice, with fields parallel to the a- and c-axes, and noticed no significant differences. Orientation in the a-c plane was set upon sample mounting within a tolerance of . The magnetic field of the oscillator was always along the b-axis, so that currents are excited within the planes of the conductor.
We performed the experiments in a 3He cryostat inside the 40 T medium pulse magnet at Clark University with a rise-time of 27 ms. By using either 3He or 4He in the cryostat, we were able to take data from 367 mK to 4.3 K in a liquid environment.

To measure the in-plane penetration depth, we designed a Tunnel Diode OscillatorVan Degrift (1975); Coffey et al. (2000); Gevorgyan et al. (1998) shown in Fig. 1 and described in Coniglio et al. , to operate at 390 MHz with the sample contained in a 4-turn 0.5 mm diameter coil. For maximum sensitivity, the oscillator circuitry was placed next to the rotator and connected to the sample coil with 18 mm of twisted pair. We reduced the amount of heat generated near the sample by moving our biasing and matching resistor network above the 3He liquid level and used a length-tuned coaxial cable to connect the oscillator to the matching network. We achieved minimal noise in pulsed field despite locating the diode in the region of greatest field by using rf techniques such as impedance matching the signal into the 50 coax leading up the probe, regulating the supply, and the use of ferrite chokes around coax terminations throughout. With the LC oscillator free running at 390 MHz, our pre-pulse data gave a frequency measurement with a scatter of about Hz, corresponding to an independent 0.5 ppm measurement every 13 µs. The noise was about times smaller than the total frequency shift from the superconducting to normal state.
Our RF receiver used a single-conversion to 5 MHz. The radio environment between 390 and 400 MHz was quiet, and conversion images were minimal. The conversion introduces a minus sign into the receiver frequency, and a graph of received frequency vs. magnetic field may be interpreted as a penetration depth vs. magnetic field, although it is difficult to obtain absolute units for the penetration depth.Schawlow and Devlin (1959); Prozorov and Giannetta (2006) We digitized the signal at 20 MS/s for computational frequency demodulation and analysis. Coniglio et al.
II.1 Definition of
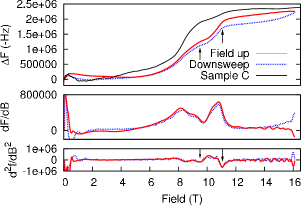
There is inherent ambiguity in the definition of because the transition is often broad. We favor identifying the critical field using minima in , an approach that is well-defined, highly localized, requires little to no human judgement, and produces self-consistent results over many trials. We use the exact same criteria (minima in ) to identify the Vortex SC-FFLO, FFLO-Normal, and Vortex SC-Normal phase transitions. Inspection of the top plot in Fig. 2 clearly show two complete transitions at low temperature in both samples – the lower one from a vortex superconductor to FFLO, and the upper one from FFLO to a normal metal.
In addition, we have found that the critical temperature we determine by an analogous method (minima in ) agrees with the critical fields extrapolated to . Our agrees with a specific heat studyIshizaki et al. (2003).
When in the superconducting state, the sample excludes RF energy from its center. The excluded volume lowers the inductance of the measurement coil, raising the oscillation frequency.Prozorov and Giannetta (2006) In the superconducting state, we measure the London penetration depth . In the normal state, the rf exclusion is governed by the metallic skin depth of the sample , which depends on frequency and conductivity. From normal state resistivity measurementsTanatar et al. (2002), we expect skin depths from 25 to 80 µm. We measure at the point where the rapidly increasing penetration depth reaches the same size as the skin depth. We can represent that point very precisely by taking the second derivative of oscillation frequency as a function of field or temperature. We define at the point where the concavity is a minimum, signifying a corner between metallic and superconducting behavior.
III Results and discussion
We examined each sample in zero magnetic field and with the conducting layers both parallel and perpendicular to a magnetic field. Average was 4.93 K, in agreement with Mielke et al. (2001); Ishizaki et al. (2003). From our measurements, we have two reports to make. First, we will establish the phase diagram with the field perpendicular to the conducting layers using a full superconducting phase diagram measurement on a single sample and argue against the conclusion in Mielke et al. (2001) that -(BETS)2GaCl4 exhibits a dimensional crossover at 1.9 K. Second, with the assistance of the WHH model, we will use our new penetration depth data with field parallel and nearly parallel to the conducting layers to identify the high field low temperature phase as a function of temperature, field, and angle, and affirm the suggestion of Tanatar et al. (2002) that the phase may be due to the Fulde-Ferrell-Larkin-Ovchinnikov state. We observe that as the angle is rotated away from parallel to the planes, the transition between the vortex state and FFLO increases in field, while the introduction of vortices destabilizes the FFLO phase and causes its transition to the normal state to reduce in field. We attribute the vortex-FFLO behavior to an increase in spin-orbit scattering caused by vortices entering the conducting layers.
III.1 Perpendicular phase diagram

Fig. 3 shows as a function of temperature for a single sample. Comparing our phase diagram to Fig. 9 of Mielke et al. (2001), we do not see the abrupt change in slope of that they report at 1.9 K. Instead, we see a gradual increase in slope at about 3 K. Ref. Mielke et al. (2001) suggested that at 1.9 K, the sample undergoes a dimensional crossover from a three-dimensional behavior to a quasi-two-dimensional one when the across-plane coherence length becomes smaller than the interlayer spacing. While we cannot rule out that explanation, we disagree with their conclusions regarding the dimensional crossover. The use of to measure is not easily justified. Whether the sample is 2d or 3d, the in-plane size of a vortex depends on , and their cross-plane extent is the entire sample. Fields aligned parallel to the layers should be used to study the anisotropy and dimensionality, as we have done in Fig. 5 and discuss in the section on angle dependence of .
We find two-dimensional behavior at both 1.35 K and 2.85 K. Since we do see a gradual change in slope near 3 K, we wish to keep open the question about the origin of this behavior. Due to the change in slope, WHH does not fit this data. WHH may not generally apply to the organics in the perpendicular orientation because samples are in the clean limit, where the mean free path is much greater than coherence length. Using our perpendicular orientation phase diagram and extrapolating to zero temperature, we find Å.
III.2 Parallel phase diagram and WHH fit
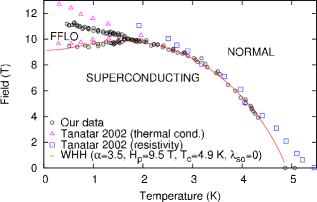
The phase at high field and low temperature has been ascribed to the FFLO state.Tanatar et al. (2002) Our study has produced and values with significantly more detail than the previous work. Points from both measurement techniques of Tanatar et al. (2002) and the present work appear in Fig. 4.
We will now compare our data to the theory of Werthamer, Helfand, and HohenbergWerthamer et al. (1966); Collings (1986). Starting from fixed K and no spin-orbit scattering (), we use the low temperature data to tune T and high temperature data to tune
| (1) |
From and , we find and produce the fit shown in Fig. 4. Remarkably, the fit reproduces the maximum at 1.6 K, in excellent agreement with both the present work and the interpolated value in Tanatar et al. (2002). For comparison with Agosta et al. (2006), using the Dingle temperature from Mielke et al. (2001) (whose samples came from the same batch as ours) and our Å, we find . Using only data from Mielke et al. (2001), might be 10% lower.
Despite the good fit, we pay careful attention to the intended purpose of the WHH model: First, WHH was designed for bulk superconductivity, and no consideration is made for the effects of layers, particularly the orbital lock-in effect. We considered the theory of Klemm, Luther, and BeasleyKlemm et al. (1975), which does examine the effect of layers. At low temperatures in the parallel orientation, the behavior of KLB and WHH is identical, and WHH require fewer parameters. While we continue to examine the application of KLB in hopes of modeling the microscopic behavior and tilted fields more carefully, the present parallel orientation data appears to be modeled well as a bulk-2d anisotropic superconductor with K, , T, , and the addition of FFLO behavior at temperatures below the reentrant point. In particular, WHH reproduce the maximum in , which appears to be the tricritical point for the FFLO phase. According to MakiMaki (1966), that local maximum is also the temperature below which the transition becomes first order. Determining the order of a transition from penetration depth data is difficult, and we cannot make any strong statements. We instead point out that the present data has a qualitatively different shape from CeCoIn5, which has a second order transition at the lower field (change in slope of in Martin et al. (2005)) and a first order transition at the higher field (sharp increase in in Martin et al. (2005)).
Second, the model is stated to apply in the dirty limit, which sounds as though it should not apply to the clean organic superconductors. With the field aligned exactly in the parallel orientation, cyclotron orbits prevent electrons from traveling great distances in most directions without encountering a layer boundary. The presence of layers scattering normal electrons causes their mean free path to become short, and the dirty limit becomes an acceptable approximation.
Third, WHH require that spin-orbit scattering is a small portion of the total scattering. Since we must set the spin-orbit scattering parameter () to zero, we have satisfied this limitation of the model. We suspect the orbital lock-in effect prevents scattering by removing the vortices from the strongly conducting layers and away from (in direct space) the majority of the Cooper pairs. Support for the suppression of spin-orbit scattering in the parallel orientation comes from Figs. 5 and 6, where we observe the transition from a vortex superconductor to FFLO (9.7 T in Fig. 5) in the parallel orientation rising as the angle is rotated very slightly away from parallel, and vortices begin to cut through the layers. When vortices enter the conducting layers, spin-orbit scattering begins to occur, and the critical field bounding the vortex superconducting state rises. The introduction of spin-orbit scattering in the WHH model indeed causes an increase in , even after the reduction in due to anisotropy is considered through Tinkham’s 2d equation. Other effects due to the orbital lock-in effect are also possible and are under consideration. WHH should not apply when the fields are aligned far from from the parallel orientation, as the mean free path extends into the clean limit. The model does not fit our perpendicular data at all.
We have attempted preliminary fits to other superconductors with reported FFLO states. While the transition from vortex superconductivity to FFLO in the organics seems to fit WHH, CeCoIn5Martin et al. (2005) cannot be fitted to a reentrant WHH model because the tricritcal point is too low in temperature. The difference suggests that the mechanism for the high field, low temperature state in CeCoIn5 is different from the organics. The competition between ordered states explored in CeCoIn5Aperis et al. (2010)Koutroulakis et al. (2010) therefore does not discount the possibility of FFLO in the organics.
III.3 vs. angle
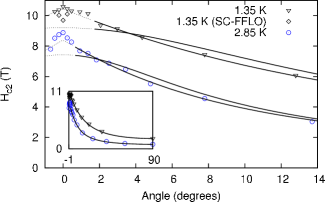
With Sample A, we measured vs. angle for a range from slightly before the parallel orientation to the perpendicular for temperatures 1.35 and 2.85 K. Resolution of the rotator was , and our finest step size was . The portion of both sweeps below is shown in Fig. 5. At both temperatures, even when the immediately parallel data is ignored, fitting to the Tinkham 2d form is superior to the G-L 3D one, eliminating the possibility of the 2d/3d crossover described in Mielke et al. (2001). For small angles about the parallel, we see evidence of the orbital lock-in effect, as critical fields jump above the Tinkham prediction below a critical angle.
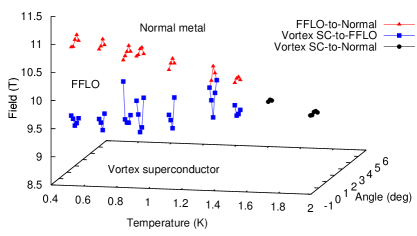
In order to ensure the exact parallel alignment of our sample to the magnetic field, we performed field sweeps at a range of angles near . Critical fields as a function of angle and temperature appear in Fig. 6 as a 3d plot. The FFLO state is sideways pyramid-shaped pocket with its point at the tricritical point (1.7 K, , 10.0 T). Of particular experimental interest, the critical field between the superconducting vortex state and FFLO rises as the angle is rotated away from parallel, even as at 11 T falls.
III.4 Features below
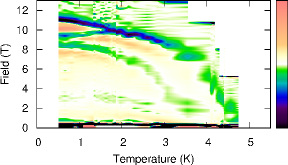
We have noticed features in our data below and . We attribute them to impurities at the surface of the sample, but their similarity to a superconducting transition interests us. One of them is visible in Fig. 7 from 3.75 K to 8.5 T (green online), and also appears in Sample C. A second only occurs in Sample C and matches exactly with the only transition visible in Sample B. The newer (and probably cleaner) Sample D has no extra features. We have noted similar behavior in three samples of LiFeAs,Cho et al. (2011) suggesting an effect of surface reconstruction or oxidation. The effect is visible as a deviation of penetration depth from the bottom of the diagonal lines in Fig. 1 of Ref. Cho et al. (2011).
Lower features in both the title compound and LiFeAs appear very much the way a superconducting transition would, but do not appear to affect the bulk superconductivity in the material. They exhibit no hysteresis between the up and down sweep, often have -like signatures in a zero-field temperature sweep, and have an angle dependence that follows the 3d G-L or 2d Tinkham forms, depending on the dimensionality of the sample. The crystallographic axis is shared with the main transition at higher field, eliminating the possibility of a twinned crystal or a different morphology from consideration.
The coexistence of two forms of superconductivity that appear not to interact but share the same crystal structure is puzzling. If the surface of the samples exhibit different superconducting properties, the penetration depth measurement technique is sensitive to the behavior of one order parameter even if the other is fully superconducting, as the susceptibility of the sample will still change. Electrical conductivity, in particular, will not be sensitive to either the low field transition or the one between the ordinary superconducting state and FFLO one because the resistance will be zero below .
IV Conclusion
We show a phase diagram for -(BETS)2GaCl4 with 116 field sweeps showing a high field, low temperature phase we attribute to the FFLO state. The angular dependence of the phase diagram is consistent with expected FFLO behavior. Our great point density allows us to reliably fit the ground state superconducting phase to the model by WHH. To our knowledge, this is the first example of experimental data that fits the reentrant WHH phase diagram. As no conclusive experiments have been done so far on the FFLO phase in the organics, it is difficult to prove that explanation. However, the body of evidence for the phase is growing, and it has been reported from a number of different measurement techniques. In addition to the ongoing phase diagram work by several groups, parallel-aligned high field studies of specific heat, neutron scattering, or STM, although difficult, would provide valuable confirmation or redirection of the research effort so far.
V Acknowledgements
We would like to thank an anonymous reviewer, who prompted us to consider the WHH model. We acknowledge support from the U. S. Department of Energy ER46214.
References
- Kobayashi et al. (1993) A. Kobayashi, T. Udagawa, H. Tomita, T. Naito, and H. Kobayashi, Chemistry Letters pp. 2179–2182 (1993).
- Uji et al. (2001) S. Uji, H. Shinagawa, T. Tereshima, T. Yakabe, Y. Teral, M. Tokumoto, A. Kobayashi, H. Tanaka, and H. Kobayashi, Nature 410, 908 (2001).
- Uji et al. (2006) S. Uji, T. Terashima, M. Nishimura, Y. Takahide, T. Konoike, K. Enomoto, H. Cui, H. Kobayashi, A. Kobayashi, H. Tanaka, et al., Phys. Rev. Lett. 97, 157001 (2006).
- Singleton et al. (2002) J. Singleton, P. A. Goddard, A. Ardavan, N. Harrison, S. J. Blundell, J. A. Schlueter, and A. M. Kini, Phys. Rev. Lett. 88, 037001 (2002).
- Klemm et al. (1975) R. A. Klemm, A. Luther, and M. R. Beasley, Phys. Rev. B 12, 877 (1975).
- Lee et al. (2002) I. J. Lee, P. M. Chaikin, and M. J. Naughton, Phys. Rev. Lett. 88, 207002 (2002).
- Clogston (1962) A. M. Clogston, Phys. Rev. Lett. 9, 266 (1962).
- Maki (1966) K. Maki, Physical Review 148, 362 (1966).
- Hake (1967) R. R. Hake, Phys. Rev. 158, 356 (1967).
- Werthamer et al. (1966) N. R. Werthamer, E. Helfand, and P. C. Hohenberg, Phys. Rev. 147, 295 (1966).
- Collings (1986) E. W. Collings, Applied Superconductivity, Metallurgy, and Physics of Titanium Alloys, vol. 1 (Plenum Press, New York, 1986).
- Fulde and Ferrell (1964) P. Fulde and R. A. Ferrell, Phys. Rev. 135, A550 (1964).
- Larkin and Ovchinnikov (1964) A. I. Larkin and Y. N. Ovchinnikov, Zh. Eskp. Teor. Fiz 47 (1964), [Sov. Phys. JETP 20, 762 (1965)].
- Tanatar et al. (2002) M. A. Tanatar, T. Ishiguro, H. Tanaka, and H. Kobayashi, Physical Review B 66, 134503 (2002).
- Singleton et al. (2000) J. Singleton, J. A. Symington, M.-S. Nam, A. Ardavan, M. Kurmoo, and P. Day, J. Phys.: Condens. Matter 12, L641 (2000).
- Smith et al. (2007) B. E. Smith, K. Cho, I. Mihut, C. C. Agosta, S. W. Tozer, T. P. Murphy, E. C. Palm, and J. A. Schlueter (2007), Clark University Graduate Student Multidisciplinary Conference, poster session.
- Lortz et al. (2007) R. Lortz, Y. Wang, A. Demuer, P. H. M. Böttger, B. Bergk, G. Zwicknagl, Y. Nakazawa, and J. Wosnitza, Phys. Rev. Lett. 99, 187002 (2007).
- Cho et al. (2009) K. Cho, B. E. Smith, W. A. Coniglio, L. E. Winter, C. C. Agosta, and J. A. Schlueter, Physical Review B 79, 220507(R) (2009).
- Bergk et al. (2009) B. Bergk, A. Demuer, I. Sheikin, Y. Wang, J. Wosnitza, Y. Nakazawa, and R. Lortz (2009), URL http://arxiv.org/abs/0907.3769.
- Coffey et al. (2010) T. Coffey, C. Martin, C. C. Agosta, T. Kinoshota, and M. Tokumoto, Phys. Rev. B 82, 212502 (2010).
- Radovan et al. (2003) H. Radovan, N. Fortune, T. Murphy, S. Hannahs, E. Palm, S. Tozer, and D. Hall, Nature 425, 51 (2003).
- Bianchi et al. (2003) A. Bianchi, R. Movshovich, C. Capan, P. G. Pagliuso, and J. L. Sarrao, Phys. Rev. Lett. 91, 187004 (2003).
- Martin et al. (2005) C. Martin, C. C. Agosta, S. W. Tozer, H. A. Radovan, E. C. Palm, T. P. Murphy, and J. L. Sarrao, Phys. Rev. B 71, 020503(R) (2005).
- Aperis et al. (2010) A. Aperis, G. Varelogiannis, and P. B. Littlewood, Phys. Rev. Lett. 104, 216403 (2010).
- Koutroulakis et al. (2010) G. Koutroulakis, M. D. Stewart, V. F. Mitrović, M. Horvati, C. Berthier, G. Lapertot, and J. Flouquet, Phys. Rev. Lett. 104, 087001 (2010).
- Montgomery et al. (1993) L. K. Montgomery, T. Burgin, J. C. Huffman, K. D. Carlson, J. D. Dudek, G. A. Yaconi, L. A. Megna, P. R. Mobley, W. K. Kwok, J. M. Williams, et al., Synthetic Metals 55-57, 2090 (1993).
- Van Degrift (1975) C. T. Van Degrift, Rev. Sci. Instrum. 46, 599 (1975).
- Coffey et al. (2000) T. Coffey, Z. Bayindir, F. DeCarolis, M. Bennett, G. Esper, and C. C. Agosta, Rev. Sci. Instrum. 71 (2000).
- Gevorgyan et al. (1998) S. G. Gevorgyan, G. D. Movsesyan, A. A. Movsisyan, V. T. Tatoyan, and H. G. Shirinyan, Rev. Sci. Instrum. 59, 2550 (1998).
- (30) W. A. Coniglio, L. E. Winter, C. Rea, K. Cho, and C. Agosta, Improvements to the tunnel diode oscillator technique for high frequencies and pulsed magnetic fields with digital acquisition, arXiv:1003.5233.
- Schawlow and Devlin (1959) A. L. Schawlow and G. E. Devlin, Phys. Rev. 113, 120 (1959).
- Prozorov and Giannetta (2006) R. Prozorov and R. W. Giannetta, Supercond. Sci. Technol. 19, R41 (2006).
- Ishizaki et al. (2003) Y. Ishizaki, H. Uozaki, H. Tsuchiya, Y. Abe, E. Negishi, H. Matsui, S. Endo, and N. Toyota, Synthetic Metals 133–134, 219 (2003).
- Mielke et al. (2001) C. Mielke, J. Singleton, M.-S. Nam, N. Harrison, C. C. Agosta, B. Fravel, and L. K. Montgomery, J. Phys.: Condens. Matter 13, 8325 (2001).
- Agosta et al. (2006) C. Agosta, C. Martin, H. Radovan, E. Palm, T. Murphy, S. Tozer, J. Cooley, J. Schlueter, and C. Petrovic, Journal of Physics and Chemistry of Solids 67, 586 (2006).
- Tinkham (1985) M. Tinkham, Introduction to Superconductivity (McGraww-Hill, 1985).
- Cho et al. (2011) K. Cho, H. Kim, M. A. Tanatar, Y. J. Song, Y. S. Kwon, W. A. Coniglio, C. C. Agosta, A. Gurevich, and R. Prozorov, Phys. Rev. B 83, 060502(R) (2011).