Emergent order in the spin-frustrated system DyxTb2-xTi2O7 studied by ac susceptibility measurements
Abstract
We report the a.c. susceptibility study of DyxTb2-xTi2O7 with [0, 2]. In addition to the single-ion effect at (single-ion effect peak temperature) corresponding to the Dy3+ spins as that in spin ice Dy2Ti2O7 and a possible spin freezing peak at ( K), a new peak associated with Tb3+ is observed in at nonzero magnetic field with a characteristic temperature (). increases linearly with in a wide composition range ( at 5 kOe). Both application of a magnetic field and increasing doping with Dy3+ enhance . The peak is found to be thermally driven with an unusually large energy barrier as indicated from its frequency dependence. These effects are closely related to the crystal field levels, and the underlying mechanism remains to be understood.
pacs:
75.50.Lk; 75.40.GbI introduction
Geometrically frustrated magnetic materials,Ramirez1994 ; Schiffer1996 ; Diep2005 which are ordered systems with specific geometry that accommodates closely competing spin-spin interactions and therefore frustration, attract extensive interests because of their novel ground states. The pyrochlores Gardner2009 provide a variety of geometrically frustrated magnetic materials, including spin liquid,Gardner1999 spin ice,Harris1997 ; Bramwell2001 and spin glass,Gingras1997-SG ; Gardner1999-SG ; Greedan2009-SG where magnetic exchange and dipolar interactions of the nearest-neighbor spins dominate the low-temperature magnetic property. Among these, two pyrochlores are of particular interests, spin ice Dy2Ti2O7 (DTO), Ho2Ti2O7 and spin liquid Tb2Ti2O7 (TTO), which have completely different ground states while sharing essential similarities.
For the spin ice compound, spins upon each tetrahedron adopt the two-in-two-out configuration in the ground state, which is a direct analogy to the two-short-two-long proton bond configuration in water ice.Harris1997 This results in the zero point entropy.Ramirez1999 Strong crystal field (CF) splitting induces uniaxial anisotropy of Dy3+ spins giving rise to the Ising-like ground state doublet, in DTO, with spins pointing along the local (111) axis, which lies more than 200 K below the first excited state.Rosenkranz2000 ; Matsuhira2001 ; Snyder2001 Novel spin dynamics has been observed. The single-ion effect at 15 K and spin freezing into the ice stateSnyder2003 ; Snyder2004 ; Ke2007 ; Snyder2004b (strictly, spins falling into compliance with the ice rule and freezing into disordered states) below 2 K are found to be responsible for the low-temperature dynamic properties. Moreover, it has been predictedCastelnovo2008 ; Jaubert2009 and most recently verified experimentallyFennell2009 ; Bramwell2009 ; Kadowaki2009 that the dipole-dipole interactions give rise to magnetic monopoles, therefore a new wave of reconsideration of the equivalency of electricity and magnetism is invoked.
The spin liquid compound TTO has Ising type spins similar to DTO but with a much smaller gap of 18.7 K between the ground and excited spin states, Gingras2000prb ; Gardner2001 which is one order of magnitude smaller than that of DTO. TTO remains in spin liquid state down to 50 mK despite a short-range antiferromagnetic (AFM) order.Gardner2001 ; Gardner2003-50mk With a Curies-Weiss temperature of -14 K (Ref.Gingras2000prb ), the absence of an ordered ground state is unusual and has been attributed to the delicate balance between the AFM exchange and ferromagnetic (FM) dipolar interactions, which then places TTO right at the phase boundary according to the phase diagram by Hertog and Gingras.Hertog2000 This delicate balance, however, is vulnerable to external perturbations, such as pressure and magnetic fields. For example, TTO shows an AFM ground state with spin-liquid-like fluctuations under high pressure,Mirebeau2002 a long range order with spin wave excitations Rule2006 and a spin-ice-like order with the propagation vector Cao2008 under high magnetic fields along the [110] axis. It is also proposed that quantum fluctuations are responsible for the lack of an ordered ground state, and TTO is argued to be in a quantum mechanically fluctuating spin ice state.Molavian2007 ; Molavian2009
It is therefore interesting to ask how the ground state and magnetic interactions evolve if both Dy and Tb ions are introduced into the rare earth (RE) sites. In a brief reportChang2007 , both spin ice and liquid signatures are found in the ground state of HoxTb2-xTi2O7. Here, using the a.c. susceptibility study on DyxTb2-xTi2O7 (DTTO), we observed a new peak in at the characteristic temperature (). is found to increase linearly with Dy composition in a surprisingly wide range () for kOe. The phase diagram of the composition dependent is obtained. The peak is found to be thermally driven with an unusually large energy barrier as indicated from its frequency dependence. The observed peaks are closely related to the CF, and possible origins are discussed using the composition and the field dependence of a.c. susceptibility.notes-0
II experimental methods
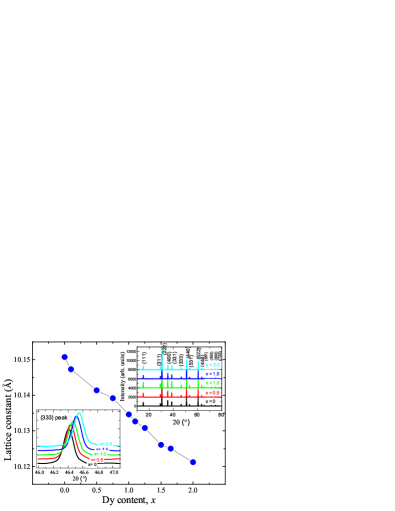
Polycrystalline DTTO with were prepared by the standard solid-state reaction method.Snyder2001 ; Gardner1999 . The X-ray diffraction data show that all samples are of single phase with a pyrochlore structure. The lattice constants (cubic phase, ) are shown in Fig. 1. For the two samples at the composition boundaries, lattice constants of 10.15(1) Å for TTO ( = 2.0) and 10.12(1) Å for DTO ( = 0) are in good agreement with previous reports,Gardner1999 ; Diep2005 Curie-Weiss temperatures by fitting to the d.c. susceptibility between 10 and 20 K are consistent with values reported.notes-0 As there are two spin species on the RE sites, it is important to address the issue of possible phase separation. As shown in the lower inset of Fig. 1, the full width at half maximum of the diffraction peaks does not show obvious increase with different , which indicates that the system is free from phase separations. The quasi-linear decrease of the lattice constants with increasing further confirms the samples’ quality. D.c. and a.c. susceptibilities are measured by a Quantum Design SQUID magnetometer and a physical properties measurement system (PPMS) using an excitation field of Oe at frequency Hz) respectively.
III results and discussions
In Fig. 2, we take sample as an example and show the real and imaginary parts of the a.c. susceptibility at varying magnetic fields. At , increases monotonically with an increasing slope upon cooling for all excitation frequencies in study ( = 1, 2, 5, 10 kHz), which signals a canonical paramagnetic behavior.Ueland2006 ; Ke2007 The imaginary part in the lower panel shows a sharp increase as well, even when approaching our lowest available temperature 2 K. Therefore there should exist a strongly dissipative process at K. The zero field a.c. susceptibility is qualitatively similar to that of TTO (Ref.Ueland2006 ) for all DTTO samples in study. The magnitude of at grows with increasing , presumably due to the larger moment of Dy3+ spins. As the field increases to 5 kOe, a clear dip in appears around 8.5 K, leading to a local maximum in as well as a correlated peak in dictated by the Kramers-Kronig relation. It is also notable that there is an emerging maximum on the right shoulder of the peak in , which becomes prominent as the field increases. At kOe, shows two clear dips at 12 K and 17.5 K, thereby two local maxima appear in . As the frequency increases, the separation between the two local maxima increases (Fig.2 c′′).
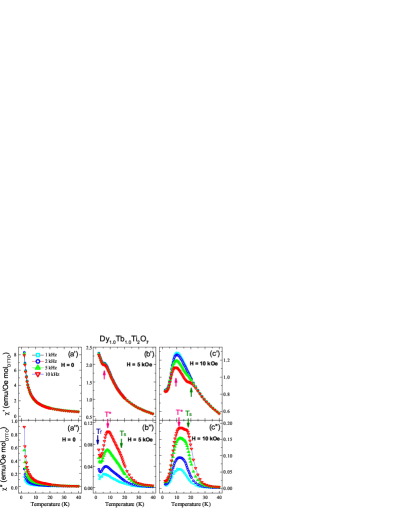

The two spin-freezing-like peaks cannot be attributed to a collective spin glass transition, although the random occupancy of rare earth sites by Dy3+ and Tb3+ is a likely source of spin glassiness. In contrast to the spin glass transition, the d.c. susceptibility of DTTO shows simply a Curie-Weiss behavior, more strictly, a superposition of Curie-Weiss and Van Vleck terms,Zinkin1996 ; Gingras2000prb ; Ueland2006 with no freezing transition. Secondly, the application of a magnetic field enhances the characteristic temperature of the two freezing-like peaks, as opposed to the case of spin glass where the transition temperature is suppressed.Binder1986 Furthermore, the interactions for Dy-Dy and Tb-Tb on the ground state doublet in DTO and TTO cases are only of the order of 1 K, much lower than the temperature of the observed peaks. Therefore the freezing-like peaks are most likely not due to spin glass transitions. With higher magnetic fields ( kOe data shown in Fig. 4(b) and higher field data not shown here), the thermal spin contribution is suppressed at low and high temperatures, leaving only a broad peak in as observed in TTO and DTO.Ueland2006 Other samples with 0.5 1.5 show qualitatively similar behaviors. The appearance of the two freezing-like peaks as well as their strong frequency dependence are reminiscent of the single-ion effect peak in pure DTO, i.e., , and will be discussed in detail by examining the composition dependence below.
Fig. 3 shows the a.c. susceptibility of five representative samples with = 0, 0.5, 1.0, 1.5 and 1.8 at = 5 kOe. For = 0, there appears to be a peak below 3 K in . The imaginary part of the sample with = 0 is clearly different from other doped samples regarding their frequency dependence. This is presumably related to the fact that the exchange coupling and the energy gap between narrowly spaced CF levels of TTO are of comparable energy scale and therefore both have nonnegligible contributions to the susceptibility.Gingras2000prb ; Ueland2005 For samples with (data not shown here), the crystal field contribution increases progressively as increases, manifesting as the transition to the behavior of the sample with . The sample with shows a single peak in ( indicated by the red arrow). Additional peaks ( and indicated by the blue and green arrows) start to emerge for = 1.0, and become more pronounced in = 1.5 and 1.8 samples. These additional peaks for have the same origin as the two peaks in pure DTO. In pure DTO, two peaks are observed in , a high temperature peak corresponding to the single-ion effect, and a low temperature peak associated with the spin freezing dictated by the ice-rule ground state.Snyder2003 ; Snyder2004 ; Ke2007 ; Snyder2004b For the sample with = 1.8, the position of the high temperature peak (indicated by the green arrow) are in good agreement with the single-ion peak in DTO. Moreover, the frequency dependence of the high temperature peak and the extracted energy scale corresponding to the crystal field splitting are qualitatively similar to that of pure DTO, as discussed below. We therefore identify the high temperature peak as the single-ion peak of Dy3+ spins. The low temperature peak (indicated by the blue arrow) also possesses a similar characteristic temperature with the spin freezing peak in DTO,Snyder2004b the corresponding peak in should appear below 2 K, the limit of PPMS, thereby only a rapid increase in upon cooling below 5 K is observable, and a direct comparison with the DTO data is not allowed. Following the convention of previous reports, we define the characteristic temperature as the high temperature peak position (green arrow) in and similarly for the low temperature peak (blue arrow).
The most important new feature in all samples studied, is the presence of a third peak (indicated by the red arrow) between and . We define () as the characteristic temperature for this third peak. peak should root in the Tb3+ spins as it exists at regions with small (including at kOe, see the insets in Fig. 3) , where the peaks associated with Dy3+ disappear and the effect of Dy3+ should play a minor role. Combined with the susceptibility of Dy1.0Tb1.0Ti2O7 at different fields shown in Fig. 2, it is interesting to note that the evolution of the a.c. susceptibility with increasing (Fig. 3) is similar to that with constant but increasing magnetic field (Fig. 2). In both cases, the increase of or magnetic field leads to the appearance of the peak and subsequently the peak.
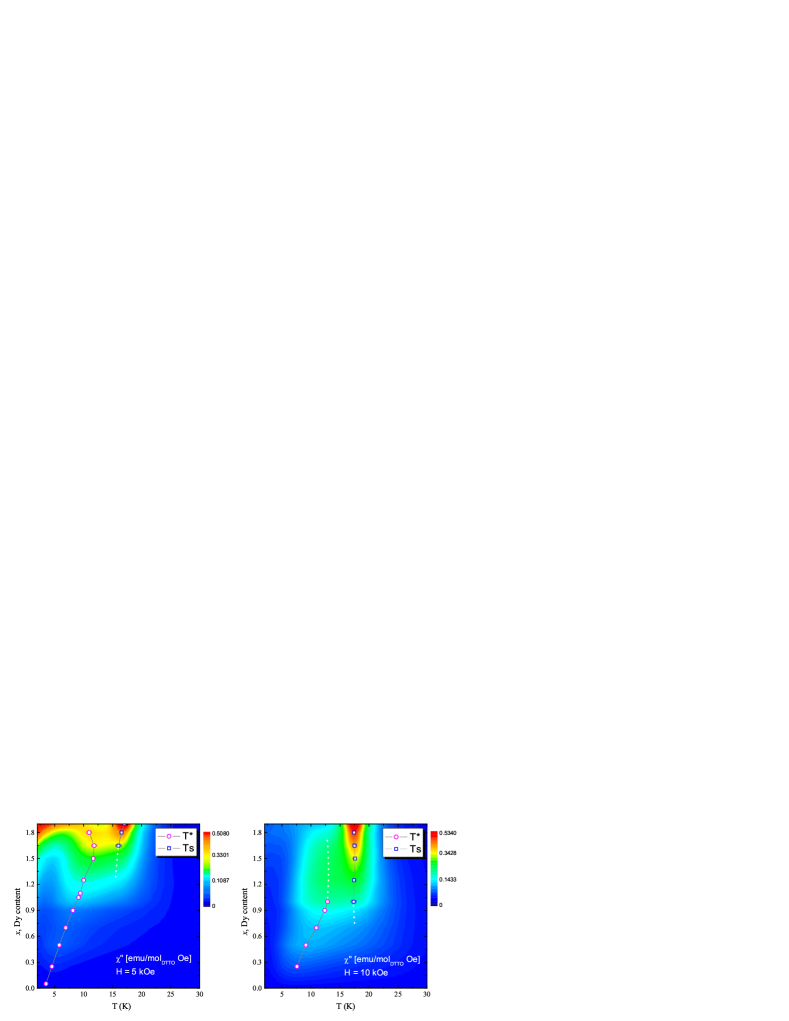
In order to investigate the origin of the peak, we studied a series of samples with [0, 2], and track and in all samples when observable. A global view of with different is shown in the contour plot in Fig. 4. It is clearly seen that the peak exists in a wide range of . Most interestingly, () increases linearly with increasing in a wide range of , both at 5 kOe and 10 kOe. At = 10 kOe, the low temperature upturn is strongly suppressed compared with the 5 kOe case, as mentioned above. The linearity of () persists in a wide range, from to 1.5, obvious deviation from the linearity occurs when . The characteristic peak temperature of is also shown in Fig. 4, with a slight decrease as becomes smaller.
A clear deviation from linearity in for is also an indication for its Tb3+ origin. The pyrochlore structure of DTTO consists corner-shared tetrahedrons, by assuming that Dy3+ and Tb3+ spins in DTTO occupy the lattice randomly therefore uniformly, there are two critical values of (Dy) where large change in local environment (i.e. tetrahedron that consists of only one spin species: all Dy3+ or all Tb3+) emerges: for 1.5 (), tetrahedrons of Dy3+-only (Tb3+-only) spins appears, while Tb3+(Dy3+) still lies in the uniform neighborhood coordinated with six Dy3+ (Tb3+) spins. The deviation from the linearity in () can be understood as a direct consequence of the critical value of = 1.5. It is important to note that there is no such deviation at the Tb end. The presence of the deviation at as well as the lack of that at is a strong indication of the asymmetric roles of Tb3+ and Dy3+ spins in the origin of peak, consistent with our argument that the peak is associated with Tb3+.
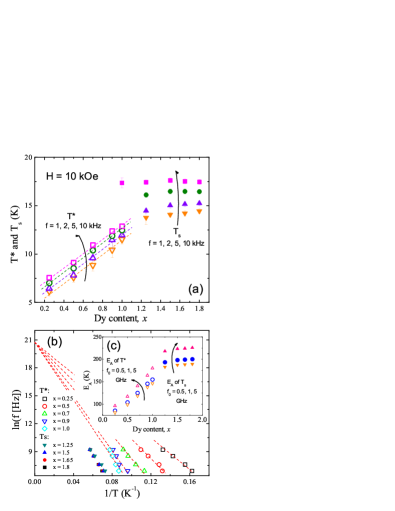
To see the nature of , we show in Fig. 5(a) the phase diagrams of the () and () with different a.c. excitation frequencies (1, 2, 5 and 10 kHz) at kOe. The quasilinear increase of (x) is preserved at kOe at different frequencies. The frequency dependence of both and behaves according to the Arrhenius relation, as shown in Fig. 5(b). One note that to achieve a reliable fitting with the exponential function , data with frequencies spanning over several decades are necessary. In our case, however, at frequencies lower than 1 kHz, and peaks are indistinguishable, making the data at lower frequency range inaccessible. Thus we only focus on the data above 1 kHz. From the fitting of , where is taken to be the physically reasonable values of 1 GHz,Snyder2001 ; Snyder2003 the energy barrier can be extracted. The extracted energy barrier is shown in Fig. 5(c), including by fitting with and GHz to verify the reliability of the fittings. The validity of the fitting by Arrhenius law indicates that in the presence of a magnetic field the spin relaxation is thermally driven.Snyder2003 In pure DTO, has been found to be 200 K (Ref.Snyder2004 ). This energy barrier has been interpreted as the gap between the lowest lying crystal field levels of Dy3+. In DTTO, it can be seen that associated with changes only slighly from 193 K for = 1.25 to 200 K for = 1.8, a value very close to the energy barrier in pure DTO. This again proves our understanding that peak is associated with the single-ion effect of Dy3+. On the other hand, associated with (attributed to Tb3+ above) increases rapidly from 85 K for = 0.25 to 154 K for = 1.0. These values are unusually high, since the crystal field gap of ground state doublets for TTO is only O(20 K). Similar fittings with data at 5 kOe cannot be performed since the and peaks are not well resolved for low frequencies.
Our observations including the field, composition and frequency dependence of raise the question of its underlying mechanism. Knowing the exchange and dipolar interaction in both DTO and TTO (for TTO, nearest neighbor exchange Jnn = -0.88 K, nearest dipolar interaction Dnn = 0.8 K (Ref.Mirebeau2006 ), for DTO Jnn = -1.2 K, Dnn = 2.35 K (Ref.Hertog2000 )), it is hard to imagine that certain combinations of interactions between Dy and Tb spins (i.e. Dy-Dy, Tb-Tb and Dy-Tb) can give rise to a characteristic temperature with its energy barrier two orders of magnitude higher than the energy scale set by the interactions. Instead, the large energy gap extracted from the frequency dependence of suggests that single-ion effects may play an important role. The CF levels for pure TTO and DTO have been studied in detail previously.Rosenkranz2000 ; Gingras2000prb ; Gardner2001 For the DTTO samples, there exist two sets of CF schemes associated with Dy3+ and Tb3+ respectively, with their CF level structures determined by the local chemical environment. The zero-field in pure DTO is around 200 K. With = 10 kOe, associated with Dy3+ in DTTO also stays around 200 K as is shown in Fig. 5(c). Thus one may expect that the single-ion peak temperature corresponding to the CF of Dy3+ in DTTO should be robust against the change in magnetic field. However, according to the a.c. susceptibility data at zero field, e.g., Fig. 2(a′ ) and (a′′ ), none of the sample with show signs of a single-ion peak above 2 K, implying narrowly spaced CF levels similar to that in TTO. Moreover, the field dependence of and in Fig. 2 indicate a dominant impact on their respective CF gap by the field. The possible field dependence of the CF levels is novel and deserves further investigation. Here with the current limited data, we discuss possible mechanisms that may give rise to the field dependence. It is known that with the application of a magnetic field, the Zeeman splitting of the spin states may cause changes in the CF scheme. Take Dy3+ ions as an example,Fukazawa2002 O. With the magnetic field of 1 T, the Zeeman energy is O(10) K, which is one order of magnitude smaller than the experimental value. We therefore reason that there should be some interactions beyond the CF interaction that contribute to the magnetic field dependence. Previous studies on TTO and similar geometrically frustrated systems revealed the softening of the crystal field gap due to the presence of the spin-spin correlation.Gardner1999 ; Zhou2008 The spin-spin correlation can significantly alter the CF in TTO since its energy gap is only O(10) K. It is therefore possible that the interplay between CF interaction and spin-spin correlation dominate the magnetic field dependence of the single-ion peaks. At zero field, the gap of CF is softened due to the spin-spin correlation between Dy3+ and Tb3+, causing the disappearance of the and peak. With the presence of a field, the spin-spin correlation is dramatically altered, the gap of CF is again activated and thus the peaks appear. However, the spin-spin interactions are orders of magnitude smaller than the gap observed here, thus may not cause sizable softening of the gap. Another possibility is the presence of magneto-elastic couplingAlexandrov1985 ; Mirebeau2002 ; Mirebeau2004 . A giant magnetostriction has been reported in TTO (Ref.Alexandrov1985 ), indicating strong coupling between spin and lattice degree of freedom. In DyxTb2-xTi2O7, it is possible that similar magneto-elastic coupling act in a way that the magnetic field may change the chemical environment of the RE ion, and tune the crystal field effectively. However, such a strong effect on crystal field (change by several tens of Kelvin) by a moderate magnetic field (1 T) is still surprising. The detailed mechanism remains to be explored.
At = 10 kOe, with associated with Dy3+ attaining its zero-field value of 200 K, the composition dependence of the peak can be understood as a consequence of the change of the crystal field with Dy3+ doping. The crystal field scheme is intimately related to the structural parameters of the system,Gingras2000prb including the lattice constants and the positional parameters of the eight oxygen surrounding the RE ion. Dy3+ doping leads to a systematic change in the structure and the corresponding changes in the crystal field levels. A very recent specific heat measurement on the same systemnotes-0 shows that for small concentration of Dy, a high temperature peak corresponding to the first excited CF level of Tb3+ moves to higher temperature, indicating a modification of the CF of Tb3+ site, which is consistent with our understanding. Also, the linearity of () can be understood as a consequence of the monotonic increase of by the Arrehnius relation with suitable parameters. Another possibility for the composition dependence of peak is the crystal field-phonon coupling as suggested in TTO,Lummen2008 as Dy3+ doping alters the phonon spectrum and thus the CF level scheme.
The aforementioned similarity between the evolution of the a.c. susceptibility with increasing Dy doping and that with constant but increasing magnetic field now has a plausible interpretation. In both cases, the change in crystal field levels dominates the behavior of the a.c. susceptibility: in the former case, the Dy doping changes the structure and alters the crystal field directly; in the latter case, the magnetic field affect the crystal field possibly through the magneto-elastic coupling.
IV conclusion
To conclude, we have systematically studied the a.c. susceptibility of DyxTb2-xTi2O7. A new peak associated with single-ion Tb3+ ( peak) is observed, together with another peak associated with that of Dy3+ ( peak). The phase diagram of both () and () is presented showing the characteristic temperature increasing linearly with . Both and peaks show strong frequency dependence, suggesting that the transition is thermally activated. We interpret the origin of the energy barrier to be associated with the gap in the lowest lying CF levels of Dy3+ and Tb3+. However, the extracted energy barrier for the peak is an order of magnitude higher than that of TTO and comparable to that of DTO. Furthermore, despite the large energy barrier, O(100 K), these characteristic temperatures are strongly influenced by applied magnetic field. Further neutron experiments and theoretical calculations may help to fully understand the system.
Acknowledgements.
We gratefully acknowledge M. J. P. Gingras, P. Schiffer, Y. Zhou and Y. Liu for very helpful and stimulating discussions. This work is supported by the NSFC (Grant No.10634030), NSF of US (Grant No. DMR0547036), National Basic Research Program of China (Grant No. 2007CB925001) and the PCSIRT of the Ministry of Education of China (Grant No. IRT0754).References
- (1) A. P. Ramirez, Annu. Rev. Mater. Sci. 24, 453 (1994).
- (2) P. Schiffer and A. P. Ramirez, Comments Condens. Matter Phys. 18, 21 (1996).
- (3) Frustrated Spin Systems edited by H. Diep, Word Scientific 2005.
- (4) J. S. Gardner, M. J. P. Gingras, and J. E. Greedan, Rev. Mod. Phys. 82, 53 (2010).
- (5) J. S. Gardner, S. R. Dunsiger, B. D. Gaulin, M. J. P. Gingras, J. E. Greedan, R. F. Kiefl, M. D. Lumsden, W. A. MacFarlane, N. P. Raju, J. E. Sonier, I. Swainson, and Z. Tun, Phys. Rev. Lett. 82, 1012 (1999).
- (6) M. J. Harris, S. T. Bramwell, D. F. McMorrow, T. Zeiske, and K. W. Godfrey, Phys. Rev. Lett. 79, 2554 (1997).
- (7) S. T. Bramwell and M. J. P. Gingras, Science 294, 1495 (2001).
- (8) M. J. P. Gingras, C. V. Stager, N. P. Raju, B. D. Gaulin, and J. E. Greedan, Phys. Rev. Lett. 78, 947 (1997).
- (9) J. S. Gardner, B. D. Gaulin, S. H. Lee, C. Broholm, N. P. Raju, and J. E. Greedan, Phys. Rev. Lett. 83, 211 (1999).
- (10) J. E. Greedan, D. Gout, A. D. Lozano-Gorrin, S. Derahkshan, T. Proffen, H.-J. Kim, E. Bozin, and S. J. L. Billinge, Phys. Rev. B79, 014427 (2009).
- (11) A. P. Ramirez, A. Hayashi, R. J. Cava, R. Siddharthan, and B. S. Shastry, Nature 399, 333 (1999).
- (12) There is no direct neutron study on Dy2Ti2O7 since the 164Dy isotope has very large neutron absorption. For a similar case in Ho2Ti2O7, see S. Rosenkranz, A. P. Ramirez, A. Hayashi, R. J. Cava, R. Siddharthan, and B. S. Shastry, J. Appl. Phys. 87, 5914 (2000).
- (13) K. Matsuhira, Y. Hinatsu, and T. Sakakibara, J. Phys.: Condens. Matter 13, L737 (2001).
- (14) J. Snyder, J. S. Slusky, R. J. Cava, and P. Schiffer, Nature 413, 48 (2001).
- (15) J. Snyder, B. G. Ueland, J. S. Slusky, H. Karunadasa, R. J. Cava, A. Mizel, and P. Schiffer, Phys. Rev. Lett. 91, 107201 (2003).
- (16) J. Snyder, B. G. Ueland, A. Mizel, J. S. Slusky, H. Karunadasa, R. J. Cava, and P. Schiffer, Phys. Rev. B70, 184431 (2004).
- (17) X. Ke, R. S. Freitas, B. G. Ueland, G. C. Lau, M. L. Dahlberg, R. J. Cava, R. Moessner, and P. Schiffer, Phys. Rev. Lett. 99, 137203 (2007).
- (18) J. Snyder, B. G. Ueland, J. S. Slusky, H. Karunadasa, R. J. Cava, and P. Schiffer, Phys. Rev. B69, 064414 (2004).
- (19) C. Castelnovo, R. Moessner, and S. L. Sondhi, Nature 451, 42 (2008).
- (20) L. D. C. Jaubert and P. C. W. Holdsworth, Nature Physics 5, 258 (2009).
- (21) T. Fennell, P. P. Deen, A. R. Wildes, K. Schmalzl, D. Prabhakaran, A. T. Boothroyd, R. J. Aldus, D. F. McMorrow, and S. T. Bramwell, Science 326, 415 (2009).
- (22) S. T. Bramwell, S. R. Giblin, S. Calder, R. Aldus, D. Prabhakaran, and T. Fennell, Nature 461, 956 (2009).
- (23) H. Kadowaki, N. Doi, Y. Aoki, Y. Tabata, T. J. Sato, J. W. Lynn, K. Matsuhira, and Z. Hiroi, J. Phys. Soc. Jpn. 78, 10 (2009).
- (24) M. J. P. Gingras, B. C. den Hertog, M. Faucher, J. S. Gardner, S. R. Dunsiger, L. J. Chang, B. D. Gaulin, N. P. Raju, and J. E. Greedan, Phys. Rev. B62, 6496 (2000).
- (25) J. S. Gardner, B. D. Gaulin, A. J. Berlinsky, P. Waldron, S. R. Dunsiger, N. P. Raju, and J. E. Greedan, Phys. Rev. B64, 224416 (2001).
- (26) J. S. Gardner, A. Keren, G. Ehlers, C. Stock, Eva Segal, J. M. Roper, B. Fåk, M. B. Stone, P. R. Hammar, D. H. Reich, and B. D. Gaulin, Phys. Rev. B68, 180401(R) (2003).
- (27) B. C. den Hertog and M. J. P. Gingras, Phys. Rev. Lett. 84, 3430 (2000).
- (28) I. Mirebeau, I. N. Goncharenko, P. Cadavez-Peres, S. T. Bramwell, M. J. P. Gingras, and J. S. Gardner, Nature 420, 54 (2002).
- (29) K. C. Rule, J. P. C. Ruff, B. D. Gaulin, S. R. Dunsiger, J. S. Gardner, J. P. Clancy, M. J. Lewis, H. A. Dabkowska, I. Mirebeau, P. Manuel, Y. Qiu, and J. R. D. Copley, Phys. Rev. Lett. 96, 177201 (2006).
- (30) H. Cao, A. Gukasov, I. Mirebeau, P. Bonville, and G. Dhalenne, Phys. Rev. Lett. 101, 196402 (2008).
- (31) H. R. Molavian, M. J. P. Gingras, and B. Canals, Phys. Rev. Lett. 98 157204 (2007).
- (32) H. R. Molavian and M. J. P. Gingras, J. Phys.: Condens. Matter 21, 172201 (2009)
- (33) L. J. Chang, H. Terashita, W. Schweika, Y. Y. Chen, and J. S. Gardner, J. Magn. Magn. Mater. 310, 1293 (2007).
- (34) As this manuscript is in preparation, we became aware of a study by Ke et al. reporting the magnetic and thermal properties at zero field on the same material system, see X. Ke, D. V. West, R. J. Cava and P. Schiffer, Phys. Rev. B80, 144426 (2009).
- (35) B. G. Ueland, G. C. Lau, R. J. Cava, J. R. O’Brien, and P. Schiffer, Phys. Rev. Lett. 96, 027216 (2006).
- (36) M. P. Zinkin, M. J. Harris, Z. Tun, R. A. Cowley, and B. M. Wanklyn, J. Phys.: Condens. Matter 2, 193 (1996).
- (37) K. Binder and A. P. Young, Rev. Mod. Phys. 58, 801 (1986).
- (38) B. G. Ueland and G. C. Lau, APS March Meeting abstract N9.006, Los Angeles (2005).
- (39) I. Mirebeau, A. Apetrei, I. N. Goncharenko, and R. Moessner, Physica B-Cond. Matter 385, 307 (2006).
- (40) H. Fukazawa, R. G. Melko, R. Higashinaka, Y. Maeno, and M. J. P. Gingras, Phys. Rev. B65, 054410 (2002).
- (41) H. D. Zhou, C. R. Wiebe, L. Balicas, Y. J. Yo, Y. Qiu, J. R. D. Copley, and J. S. Gardner, Phys. Rev. B78, 140406(R) (2008).
- (42) I. Mirebeau, I. N. Goncharenko, G. Dhalenne, and A. Revcolevschi, Phys. Rev. Lett. 93, 187204 (2004).
- (43) I. V. Alexandrov, B. V. Lidskii, L. G. Mamsurova, M. G. Neigauz, K. S. Pigal skii, K. K. Pukhov, N. G. Trusevich, and L. G. Shcherbakova, Sov. Phys. JETP 62, 1287 (1985) [Zh. Eksp. Teor. Fiz. 89, 2230-2247 (1985)].
- (44) T. T. A. Lummen, I. P. Handayani, M. C. Donker, D. Fausti, G. Dhalenne, P. Berthet, A. Revcolevschi, and P. H. M. van Loosdrecht, Phys. Rev. B77, 214310 (2008).