CO Spectral Line Energy Distributions of IR-luminous galaxies and AGN
Abstract
We report on new sensitive CO J=6–5 line observations of several luminous infrared Galaxies (LIRGs: LIR(8–1000m1011 L⊙), 36% (8/22) of them ULIRGs (LIR1012 L⊙), and two powerful local AGN: the optically luminous QSO PG 1119+120, and the powerful radio galaxy 3C 293 using the James Clerk Maxwell Telescope (JCMT) on Mauna Kea in Hawaii. We combine these observations with existing low-J CO data and dust emission Spectral Energy Distributions (SEDs) in the far-infrared - submillimetre from the literature to constrain the properties of the star-forming ISM in these systems. We then build the first local CO Spectral Line Energy Distributions (SLEDs) for the global molecular gas reservoirs that reach up to high J-levels. These CO SLEDs are neither biased by strong lensing (which affects many of those constructed for high-redshift galaxies), nor suffer from undersampling of CO-bright regions (as most current high-J CO observations of nearby extended systems do). We find: 1) a significant influence of dust optical depths on the high-J CO lines, suppressing the J=6–5 line emission in some of the most IR-luminous LIRGs, 2) low global CO line excitation possible even in vigorously star-forming systems, 3) the first case of a shocked-powered high-excitation CO SLED in the radio galaxy 3C 293 where a powerful jet-ISM interaction occurs, and 4) unusually highly excitated gas in the optically powerful QSO PG 1119+120. In Arp 220 and possibly other (U)LIRGs very faint CO J=6–5 lines can be attributed to significant dust optical depths at short submm wavelengths immersing those lines in a strong dust continuum, and also causing the C+ line luminosity deficit often observed in such extreme starbursts. Re-analysis of the CO line ratios available for submillimeter galaxies (SMGs) suggests that similar dust opacities may be also present in these high-redshift starbursts, with genuinely low-excitation of large amounts of SF-quiescent gas the only other possibility for their often low CO (high-J)/(low-J) line ratios. We then present a statistical method of separating these two almost degenerate possibilities, and show that high dust optical depths at submm wavelengths can impede the diagnostic potential of submm/IR lines (e.g. starburst versus AGN as gas excitation agents), which is of particular importance for the upcoming observations of the Herschel Space Observatory and the era of ALMA.
1 Introduction
Obtaining unbiased Spectral Energy Distributions (SEDs) for local and distant galaxy populations provides a crucial yardstick by which to compare their properties and eventually relate such populations along evolutionary paths within any given galaxy evolution framework. Unbiased Spectral Line Energy Distributions (hereafter SLEDs) of the rotational transitions of molecules such as CO, HCN, HCO+ are of particular importance since:
-
•
they can trace the mass distribution of the star formation fuel, the molecular gas, across its considerable range of properties ((–) cm-3, (10–200) K)
-
•
relative molecular line strengths are in principle extinction-free probes of molecular gas properties and AGN-versus-starburst as power sources of IR luminosities of galaxies (Meijerink & Spaans 2005; Meijerink, Spaans, & Israel 2006)
-
•
imaging their emission distribution and velocity fields at mm/submm wavelengths yields unique dynamical mass probes of deeply dust-enshrouded star-forming galaxies and QSO host galaxies across the Universe (e.g. Walter et al. 2004; Greve et al. 2005; Tacconi et al. 2006)
-
•
cooling and thus the thermodynamic state of the molecular gas (heated by stellar far-UV light, cosmic rays, and turbulent motions) is regulated by [C II], [O II] and high-J CO line emission, which in turn may efficiently regulate the local Jeans mass and the stellar IMF (Elmegreen, Klessen, & Wilson 2008).
Much of the star formation in the distant Universe occurs in heavily dust-enshrouded IR-luminous systems (e.g. Smail, Ivison, & Blain 1997), challenging to image at optical wavelengths even with the current 8-10 meter-class telescopes. Thus it may well be that in the upcoming era of ALMA molecular lines will replace optical and even IR lines as the most potent probes of galaxy structure and of the power sources that drive galaxy evolution across cosmic epoch. The recent discovery of significant dust optical depths even at submm wavelengths in Arp 220 (a local prototype of dust-enshrouded extreme starbursts) by Sakamoto et al. 2008 further highlights how deeply obscured such extreme star-forming systems can be.
Local templates are key in understanding not only the properties of local galaxy populations, but also of those in the distant Universe. To this end we have undertaken a large multi-J CO and HCN line survey of local Luminous Infrared Galaxies (LIRGs) – dust-obscured, star-forming systems with SFR(10–100) (eg. Sanders & Ishida 2004), for which the dominant fraction of the bolometric luminosity is in the rest-frame IR with (8-1000) m). The prodigious star formation events in LIRGs/ULIRGs, most often due to dissipative galaxy interactions/mergers of gas-rich progenitors, make them the best local analogues of the submillimeter galaxies (SMGs) (Tacconi et al. 2006; Iono et al. 2009), dust-enshrouded starbursts at high redshifts with even higher star formation rates () and the sites of a significant part of cosmic star formation history (e.g. Hughes et al. 1998; LeFloch et al. 2009). Finally we observed the hosts of two local AGN: the powerful radio galaxy 3C 293, and the optically luminous but radio quiet QSO PG 1119+120, as part of a pilot study of the molecular gas excitation in the presence of a bona fide AGN. The latter remain as the most effective beacons of the most distant galaxies where molecular lines have been detected (Walter et al. 2004), and can be the cause of distinct molecular gas excitation conditions in high redshift quasars (Schleicher, Spaans, & Klessen 2010).
In this paper we report on sensitive CO J=6–5 line measurements for galaxies in our survey. This allows: a) a first systematic glimpse of their high-excitation molecular gas phase, b) constraints on their CO SLEDs, and c) direct comparisons with starburst and AGN-dominated systems at high redshifts where predominantly only high-J CO lines are currently available (e.g. Solomon & Vanden Bout 2005; Omont 2007). Throughout this work we adopt a flat -dominated cosmology with km s-1 Mpc-1 and , and calculate luminosity distances using the NED calculator developed by Wright (2006).
2 Sample selection, observations and data reduction
Our sample of LIRGs where =L(8–1000 m)1011 L⊙ as estimated from all 4 IRAS bands, (e.g. Sanders & Mirabel 1996), of which 36% (8/22) are ULIRGs (1012 L⊙), is drawn from two CO J=1–0 surveys of LIRGs by Sanders et al. 1991, and Solomon et al. 1997 (themselves drawn from the IRAS BGS flux-limited sample with 5.24 Jy; Soifer et al. 1987, 1989; Sanders et al. 2003). We then imposed two additional criteria, namely: a) z0.1 (the maximum redshift for which the JCMT B-band receivers can tune to CO J=3–2), and b) compact CO-emitting regions (sizes obtained from interferometric images in Sanders et al. 1988; Planesas et al. 1991; Wang et al. 1991; Downes & Solomon 1998; Bryant & Scoville 1999; Evans et al. 2000, 2001, 2002) so that one or two telescope pointings can record the total line flux up to the highest line frequency of the survey (i.e. 690 GHz of the CO J=6–5 line). The availability of the CO J=1–0 line flux (5.5 K and 410 cm-3) for all selected LIRGs allows an inventory of all the CO-rich molecular gas phases irrespective of their average excitation state, and is thus a prerequisite if the fraction of the star-forming dense and warm molecular gas is to be determined. The latter is constrained from high-J CO line luminosities and reliable global CO (high-J)/(1–0) line ratios (and hence our second criterion for source compactness).
Finally, along with the aforementioned LIRG sample, two local powerful AGN were also included for multi-J CO observations as a pilot study of the possible effects of the AGN on the global molecular gas reservoir of their hosts, and to guide future efforts towards a large molecular line survey of AGN-selected rather than starburst-selected systems. The two AGN chosen are the powerful F-R II radio galaxy 3C 293 whose powerful jets strongly interact with the ambient neutral gas (Morganti et al. 2003), and the optically luminous but radio quiet QSO PG 1119+120. Both have single dish and interferometric CO J=1–0 line measurements that find its emission concentrated in regions with 5′′–7′′ around their active nucleus (Evans et al. 1999, 2001, 2005), and thus satisfy our compactness criterion.
2.1 Observations and data reduction
We conducted the CO J=6–5 measurements as part of our multi-J CO and HCN line survey of LIRGs in the local Universe. The first CO J=6–5 (691.473 GHz) line measurements with the James Clerk Maxwell Telescope (JCMT)111The James Clerk Maxwell Telescope is operated by The Joint Astronomy Centre on behalf of the Science and Technology Facilities Council of the United Kingdom, the Netherlands Organisation for Scientific Research, and the National Research Council of Canada. atop Mauna Kea (Hawaii) were conducted for the luminous ULIRG/QSO Mrk 231 and the LIRG Arp 193, using the old W/D band (620–710 GHz) receiver (operating in SSB mode) on 20 of February and 22 of April 2005 respectively, under very dry conditions (0.035). The typical system temperatures were (3700–5500) K (including atmospheric absorption). The DAS spectrometer was used at its widest mode of 1.8 GHz (780 km s-1 at 690 GHz), and rapid beam switching at =2 Hz with azimuthal throws of resulted in remarkably flat baselines. The beam size at 691 GHz is =8′′. Good pointing with such narrow beams is crucial and was checked every 45–60 mins using differential pointing with receiver B3(350 GHz). The latter technique can access many more compact sources in the sky in order to conduct pointing checks than direct pointing with the W/D receiver, and was found accurate to within 2.6′′ (rms). The aperture efficiency for these periods was found to be =0.25.222This is higher than the value adopted by Papadopoulos et al 2007, and we deduced it from a larger number of planetary measurements for that period.
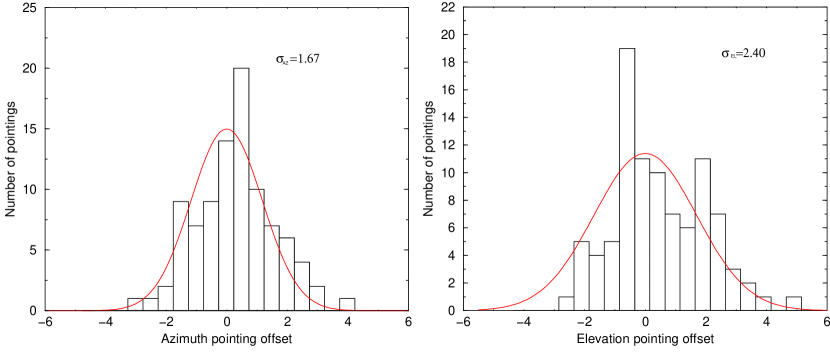
The main set of CO J=6–5 observations were conducted during several periods in January, February, March and May 2009 with the upgraded W/D receiver and its new SIS mixers (effectively the same type that will equip the ALMA telescopes at this waveband) that dramatically enhance its performance. The resulting low receiver temperatures allowed very sensitive observations with typical (1500–3000) K (including atmospheric transmission) for 0.035–0.06. Dual channel operation (two polarization channels aligned within 1′′) further enhanced the W/D band observing capability of the JCMT. The new ACSIS spectrometer was used at its widest mode of 1.8 GHz (780 km s-1 at 690 GHz), and in a few cases (e.g. Arp 220) two separate tunnings per object with an effective bandwidth of 3.2 GHz (1390 km s-1) ensured adequate coverage of CO lines with FWZI 800–1000 km s-1. Rapid beam switching at =4 Hz (continuum mode) with a throw of (in azimuth) yielded flat baselines under most circumstances. Finally the pointing was checked every 45–60 mins by observing compact sources with W/D receiver itself, and differential pointing with the A 3 receiver (230 GHz), yielding rms residual error radius of (see Figure 1). The aperture efficiency for these periods is =0.32, and a flux calibration uncertainty of 25% (encompassing variations and 3-load calibration uncertainties) was estimated from observations of several strong spectral line standards at 690 GHz.
A final set of CO J=6–5 observations were obtained recently during several days between 12 and 23 of January, and 5-6 of February 2010 under dry weather conditions (0.05) that yielded typical system temperatures of (1400–2800) K. The spectrometer setup was identical to that used in our 2009 observations with two separate tunnings used to cover a wide line in a few objects (e.g. Mrk 273, NGC 6240). Observations of Mars yielded an aperture efficiency of =0.35, while the overal calibration uncertainty remained within 25%. The same beam switching scheme was employed while pointing was checked every hour and its accuracy remained within the range shown in Figure 1.
2.2 Line intensity estimates
We inspected each 10-min spectrum for baseline ripples and intensity “spikes” in individual channels. The edited CO J=6–5 spectra were then co-added and are shown in Figure 2, overlaid (mostly) with CO J=3–2 lines. The velocity-integrated line flux densities were then estimated from those spectra, after subtraction of linear baselines, using
| (1) |
where =15.62 and is the aperture efficiency. The factor =, with and =(source diameter) accounts for the geometric coupling of a gaussian main beam to a finite-sized disk-like source when is available.
2.2.1 Observing compact sources with narrow beams: a bias
For point-like sources, even with the accurate tracking and pointing achievable by enclosed telescopes such as the JCMT, the residual rms pointing errors and the narrow beams of large mm/submm telescopes at high frequencies can lead to a substantial systematic reduction of the measured fluxes of compact sources. In Papadopoulos et al. (2009) this is shown to be
| (2) |
(see also Condon 2001) where is the rms pointing error per direction (for identical error distributions per coordinate). Thus in Equation 1, when , , since the geometric coupling correction is then overtaken by the pointing error correction.
2.3 New observations of Arp 220: a revised CO J=6–5 line flux
The archetypal starburst Arp 220 has been reobserved during our 2010 observing campaign, and a significantly larger (2.6 times) integrated line flux has been measured, along with a different line profile. The latter now agrees well with those from high-density gas tracers such as HCN J=3–2 (see Figure 3) which places the highest density gas at the high velocity component corresponding to emission from the eastern nucleus (see Greve et al. 2009 and references therein). We thus conclude that the first CO J=6–5 measurement of Arp 220 reported by Papadopoulos et al. 2010 has likely been affected by a pointing offset of the order of 4.7′′ (3.3′′ per direction). This is clearly an outlier of the distributions shown in Figure 1 but is certainly possible and accounts also for the different CO J=6–5 line profile shown in Papadopoulos et al. 2010 (4.7′′ in this system of two CO-bright nuclei 1′′ apart can yield a maximum apparent emission asymmetry of S(V1)/S(V2)0.54 between two intrinsically equal emission contributions at the velocity centers V1 and V2 of the two nuclei). Finally our fast-switching scheme allows an independent estimate of the adjacent dust continuum from the line-free part of the spectrum, which we find to be = Jy, in good agreement with the value given by Dunne & Eales 2001 rather than that in the JCMT calibrator database. The ramifications from this revision are discussed in section 3.2.
2.4 CO J=6–5 line and IR continuum luminosities
The sources, their coordinates and CO J=6–5 line flux densities (using Equation 1) are tabulated in Table 1. The corresponding line luminosities are estimated using
| (3) |
where is the continuum-subtracted line brightness temperature emerging at the source frame, and are the total linewidth and line-emitting source area, is the luminosity distance, and the line rest-frame frequency. Substituting and converting to astrophysical units yields
| (4) |
while the conversion to ordinary luminosity units (), used for the CO SLEDs, is
| (5) |
In Table 2 we tabulate the total IR luminosity LIR of each system, with any contribution from a warm AGN-heated dust subtracted when possible. In that table we also list the IR luminosity due to star formation L (see section 4), as well as the = and = line ratios. The latter is currently the most widely available one for conducting comparisons between the excitation conditions in our local LIRG sample and high-z starbursts, though for some high-z systems the “neighboring” J=7–6 transition rather than J=6–5 is the one available (Tacconi et al. 2006).
3 Molecular gas in LIRGs: the star forming phase
The star formation rates of LIRGs are fueled by molecular gas masses of (109–1010) (Tinney et al. 1990; Sanders, Scoville & Soifer 1991; Solomon et al. 1997), at efficiencies reaching up to what could be a maximum possible value of SFE=500 , set by the radiative feedback of massive stars on the dust mixed with the molecular gas accreted by the star forming sites (Scoville 2004). Such high SFEs are one the many indicators of the extreme ISM conditions found in such systems, with several studies (e.g. Solomon et al. 1992; Aalto et al. 1995; Yao et al. 2003; Greve et al. 2009) revealing also a qualitatively different molecular ISM than that of quiescent gas-rich systems. In LIRGs a diffuse () non self-gravitating phase (a likely product of high gas pressures inducing an intercloud HIH2 phase transition, and/or tidal disruption of molecular clouds in merging systems) dominates the CO J=1–0, 2–1 line emission. Nevertheless a dense phase with 104 cm-3 often contains most of the molecular gas mass present, especially in ULIRGs (e.g. Solomon et al. 1992; Gao & Solomon 2004), dominating their CO J+1J, J+13 and HCN line emission. The latter phase is warm, (40–100) K, a result of strong far-UV photoelectric and/or turbulent gas heating, its high-J CO transitions will thus be very luminous and expected to be excellent unobscured “markers” of dust-enshrouded starburst regions of galaxies over most cosmic epochs (e.g. Walter & Carilli 2008).
3.1 CO J=6–5 in LIRGs: evidence for dust-affected CO lines
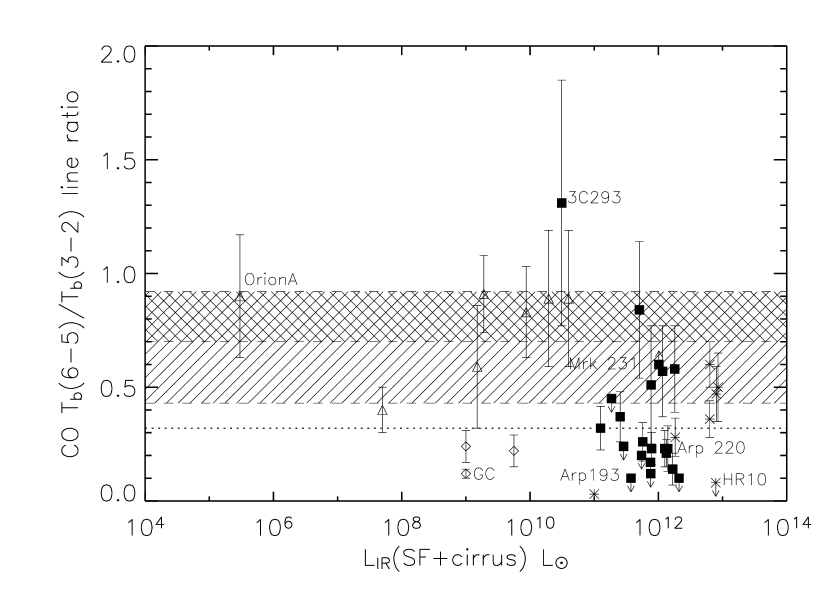
In Figure 4 the ratio is plotted versus for all the LIRGs in Table 1, and any local or distant galaxies for which this or a similar (high-J)/(low-J) global CO line ratio is available. The lightly-shaded area marks the range of values expected for the dense and warm gas phase that fuels star formation in starbursts, determined using our Large Velocity Gradient (LVG) molecular line radiative transfer code for: =(104–106) cm-3 and =(30–100) K, which encompasses the conditions of star-forming molecular gas. In this determination of the range we consider only self-gravitating gas, as appropriate for any star-forming gas phase, where
| (6) |
(e.g. Goldsmith 2001; Greve et al. 2009). Values of 1 correspond to unbound gas motions (1-2.5 depending on the assumed cloud density profile). The parameter = along with and classify the LVG solutions (we assume a Galactic abundance =10-4).
From Figure 4 it is clear that for several LIRGs the ratio falls well below the range expected for star-forming gas, and this happens in some of the most extreme starbursts in the local (e.g. Arp 220: 0.2) or the distant (e.g. HR 10: 0.053–0.08) Universe333If a “neighboring” CO line ratio rather than is avalaible for a high-z object, we obtain a range for by using the available one to obtain LVG solutions over =30–110 K, =– cm-3, and with 1. For HR 10: =0.160.053–0.08). On the other hand all nearby galaxies clearly seggregate into two groups with the star-forming ones exhibiting consistently high ratios (0.8–0.9), whilst the SF-quiescent ones have much lower CO ratios (0.12–0.24) reflecting a much less excited state of their molecular gas. Thus in some local LIRGs as well as some of their high-z counterparts, can be as low or even lower than in SF-quiescent systems. This contradiction between the excitation conditions of the star-forming molecular gas and the emergent faint CO J=6–5 line emission (and thus low ) found in some LIRGs becomes even more acute when additional information from other transitions tracing the same phase as CO J=6–5 (e.g. those of HCN) is used to further narrow the expected range of . The (U)LIRGs Arp 220 and NGC 6240 are excellent such examples, with a multi-J line survey of several heavy rotor molecules available to constraint the ratio (see section 3.2). For all other local LIRGs much less such information is available (and is virtually non-existent for their high redshift counterparts), with only two small surveys of HCN J=1–0, 3–2 (Graciá-Carpio et al. 2008; Krips et al. 2008) currently providing the most uniform line datasets probing the star-forming phase locally. These yield an average HCN (3–2)/(1–0) brightness temperature ratio of 0.55, reaching up to 0.8–0.9 for the dense gas found in starbursts such as M 82 (Krips et al. 2008) and Arp 220, NGC 6240 (Greve et al. 2009). Adopting =0.55 and 1 (implemented for an assumed =210-8) as constraints on our LVG code yields =(35–65) K and =(3104–105) cm-3, conditions that are indeed typical for the dense star-forming molecular gas (e.g. Güesten et al. 1993; Mao et al. 2000) and corresponding to an even narrower range of 0.70–0.85 (cross-hatched area in Figure 4), excluding several more LIRGs.
In the absence of dominant low-excitation molecular gas mass in LIRGs (a real possibility which is discussed in section 5.1), non-negligible dust optical depths at short submm wavelengths provide the only other mechanism that can suppress the large CO J=6–5 line luminosities expected from their star-forming molecular gas. This has been recently demonstrated in the archetypal ULIRG Arp220, where its average dust optical depth of 1 (Sakamoto et al. 2008) has been shown to be responsible for its very faint CO J=6–5 line (Papadopoulos et al. 2010). Our current results indicate that such ISM conditions may occur often in extreme starburst systems throughout the Universe.
3.2 The special cases of Arp 220 and NGC 6240
A recent multi-J HCN, HCO+ and CS line survey of these two archetypal ULIRGs by Greve et al. 2009 allows placing their CO J=6–5 line luminosities in the best context currently possible for such systems. Moreover the significantly higher CO J=6–5 luminosity we measured for Arp 220 than that reported by Papadopoulos et al. 2010 necessitates a revisit of the analysis for this ULIRG. From the findings of the aforementioned line survey it is immediately obvious that for the dense and warm gas phase of (105–106) cm-3 and (50–120) K dominating the gaseous ISM in these two starbursts: 0.85–0.93. This confines it well into the upper (cross-hatched) range of values in Figure 4, and well above the observed values for both systems. For Arp 220 the new higher value of = remains 3-6 smaller than that expected for its dense gas phase, and thus the evidence for significant dust optical depths at short submm wavelengths quenching its CO J=6–5 line emission (Papadopoulos et al. 2010) remains strong. Regarding the dust emission itself, even for the larger value of 6 Jy and = Jy (Sakamoto et al. 2008), the same analysis as in Papadopoulos et al. 2010 yields 0.27. The latter is smaller than that deduced by Sakamoto et al. 2008, but remains more than enough (with a corresponding 1) to quench the CO J=6–5 line emission in Arp 220 by immersing it into a nearly blackbody continuum at short submm wavelengths. For NGC 6240 a similar discordance between the expected for its HCN/CS-bright gas and its measured =0.26 (Table 2) exists.
Given the large impact that high dust optical depths at short submm wavelengths will have to a large number of issues (see discussion in 4.3 and 5), it is worth asking whether a large “boost” of the CO J=3–2 rather than a suppresion of the CO J=6–5 line luminosity by dust can be responsible for the low ratios in some ULIRGs. This can happen only if the diffuse non self-gravitating gas phase found in these systems contributes substantially to the CO J=3–2 emission (but not to CO J=6–5). For Arp 220 the detailed study by Greve et. al. yields a diffuse phase with (1–3)102 cm-3, 40 K and (1–3)10-5 (km s-1 pc-1)-1, with negligible CO J=3–2 line emission. This is also obvious from the fact that even the CO J=2–1 transition appears globally subthermally excited in this system. Thus a diffuse gas phase cannot be responsible for the very low value in Arp 220. For NGC 6240 this is less clear since its diffuse phase: (1–3)103 cm-3, 40 K and (1–3)10-6 (km s-1 pc-1)-1 can contribute to CO J=3–2 while having negligible CO J=6–5 line luminosity. This demonstrates the “degeneracy” between dust-affected and genuinely low-excitation CO SLEDs, and the need for multi-J and multi-species molecular line observations with excitation characteristics spanning the entire range of molecular gas physical conditions in LIRGs. For an earlier such study, conducted for the archetypal ULIRG/QSO Mrk 231, that finds luminous CO J=6–5, 4–3 line emission from the same gas phase as that emitting HCN lines see Papadopoulos, Isaak, & van der Werf 2007.
4 Global dust emission SEDs in LIRGs: fundamental limitations
Dust emission SEDs could in principle provide independent constraints on the average dust optical depths and thus help settle the issue whether these can affect molecular line emission at short submm and far-IR wavelengths. Moreover, particularly well-sampled SEDs are available for ULIRGs because of their early importance in deciding their dominant power source, i.e. AGN or starburst (e.g. Haas 2001 and references therein). We start by first assuming optically thin dust emission SEDs with over the entire (10–1200) m range, and a superposition of three such SEDs
| (7) |
This characterizes: a) an AGN-heated dust phase (, ) (estimated so that its contribution can be reliably subtracted from the global SED), b) a star formation (SF)-heated dust (, ), and c) a cold cirrus-type dust (, ). In all cases the important 850m and 1.2 mm fluxes have also been included (when available), after been corrected for CO J=3–2, 2–1 line contamination. We also correct for any non-thermal radio continuum contributions, and a dust emissivity law with =2 is adopted as the most suitable for global dust emission SEDs of LIRGs (Dunne & Eales 2001). The SED fits are then used to estimate the total-AGN () and SF-related () dust IR luminosities (Table 2). When a lack of long-wavelength data prevents constraints on the cold dust component, the fits are performed by setting =22 K (the average value obtained from all the other SEDs where enough data allowed its estimate). Dust masss and temperatures as well as H2 gas mass (obtained from CO J=1–0 data reported in the literature), and the corresponding gas/dust ratios are listed in Table 3. For all estimates we used a CO-H2 conversion factor of ==1 (Downes & Solomon 1998).
4.1 Dust in ULIRGs: cold or optically thick?
From Table 3 it becomes apparent that cold dust mass obtained from typical multi-component SED fits always contains most of the mass in LIRGs with 5-100, even in extreme starbursts such as Arp 220 and Mrk 231. This is a direct result of the far-IR/submm “excess” found in their SEDs once submm data became available (Lisenfeld et al. 2000; Dunne & Eales 2001), and was suspected even when only IR data were available because of the high gas/dust ratios deduced with respect to the Milky Way (Devereux & Young 1991). Sensitive submm imaging has conclusively demonstrated the presence of massive and extended cold dust mass in some LIRGs by spatially separating its emission from that of a more luminous SF-heated dust in nuclear regions (e.g. Papadopoulos & Seaquist 1999, Thomas et al. 2001). From Figure 5 it would then seem that the cold dust mass dominates across the entire LIR range of our sample and up to ULIRGs. Nevertheless there are some serious problems with this scenario, at least in extreme starburst systems, namely
-
•
The bulk of the molecular gas mass in most ULIRGs is in a dense, warm, and presumably star-forming phase (i.e. 105 cm-3, 40 K), and thus most of the concomitant dust should also be warm (at such high densities ).
-
•
The ratio obtained from classical dust SED fits of such objects can be very low: 4–20 (Table 3), thus requiring most of the gas in ULIRGs to be atomic (with a presumably Galactic gas/dust ratio) so that the global gas/dust ratio can attain Galactic values (140–190, Sodroski et al. 1994). However ULIRGs are found to be exceptionally H2-rich with of the gas in atomic form (Mirabel & Sanders 1989, for the factor used in our work).
-
•
Submm imaging of ULIRGs with the SMA (Sakamoto et al. 2008; Wilson et al. 2008) found most of the dust emission emanating from very compact regions (100-150 pc), of hot dust (100–140 K), and with close to the Galactic value.
These issues could be resolved if the far-IR/submm “excess” found in the dust SEDs of most LIRGs is, in some of them, of different origin rather than cold dust emission. Indeed such “excess” can be also generated by emission that is optically thick at far-IR and even short submm wavelengths. Recently this has been shown for the compact molecular gas disks in Arp 220 (e.g. Sakamoto et al. 2008, Matsushita et al. 2009), and is indeed expected if most of the molecular gas in ULIRGs is in a very dense state. For (105–106) cm-3 (e.g. Solomon, Radford, & Downes 1990; Greve et al. 2009), solar metalicities, and thickness of (40–60) pc (e.g. Downes & Solomon 1998) such molecular gas disks, if not very clumpy, will have dust optical depths of
| (8) |
( is the inclination angle, =0: face-on). Such extreme gas configurations are the results of mergers and/or strong dynamical interactions found in all ULIRGs (Sanders & Ishida 2004), essentially packing the entire molecular gas supply of two gas-rich spirals within a few hundred parsecs. Their emergent IR luminosities will then be less than proportional to their dust mass reservoirs, and can be further absorbed by outer dust distributions that are optically thick at IR/far-IR wavelengths (Condon et al. 1991; Solomon et al. 1997). For such very dense gas disks the dust mass estimates using submm fluxes and temperatures obtained from global SED fits (e.g. Dunne at al. 2000) can be significant overestimates since an outer cooler dust distribution, while not containing the bulk of the mass, dominates most of the observed SED (see also 4.2). This may explain why submm interferometric imaging can recover a Galactic value for M(H2)/Mdust in ULIRGs (e.g. Wilson et al. 2008) while global SED fits can yield significantly lower ones (Table 3; Dunne & Eales 2001)444The M(H2)/Mdust ratios deduced for ULIRGs in Dunne & Eales 2001 must be divided by 5 if an appropriate conversions factor is used for such systems. Then from their Table 10: M(H2)/Mdust(Arp 220).
4.2 Optically thick dust emission: a new degeneracy
Optically thick dust emission in ULIRGs at far-IR wavelengths has been first noticed by Condon et al. 1991 using interferometric radio continuum imaging to identify the true sizes of their starburst regions. To explore its effect on emergent dust emission we follow Lisenfeld et al. 2000 and replace the SF-heated and cold dust components inside the brackets of Equation 7 with
| (9) |
where . In Table 3 we list the results of these dust SED fits, and in Figure 6 show the distribution of the deduced optical depths for all the LIRGs with available submm data from the literature. Substantial dust optical depths are found at 100m (4–21) for most LIRGs, in accord with earlier results (e.g. Solomon et al. 1997; Lisenfeld et al. 2000). Even NGC 1068, a vigorously star-forming LIRG where a massive and extended cold dust reservoir with(10–15) K is revealed via submm imaging (Papadopoulos & Seaquist 1999), can have its non-AGN global dust emission fitted equally well with a single-temperature but optically thick SED. The latter would then erroneously interpret its cold dust as optically thick emission with 4.6. Thus the SED fits using Equations 7 and 9 are degenerate, with both cold and optically thick dust emission capable of producing a far-IR/submm emission “excess”. This - degeneracy can lead to a misinterpretation of the true state of the dust in LIRGs, and cannot be broken even for well-sampled SEDs such as those of Mrk 231 and Arp 220 (Figure 7). Only sensitive mm/submm imaging can overcome it by: a) spatially separating the cold from the warm and much more luminous SF-heated dust, and b) identifying any warm compact dust/gas regions (with potentially significant submm optical depths) “nested” inside more extended cooler dust distributions that are optically thick at far-IR wavelengths. In Arp 220 such submm imaging has identified hot and spatially extended (i.e. starburst-heated) dust reservoirs, with 2r100 pc, (100–180) K and 1 (Eckart & Downes 2007; Sakamoto et al. 2008), within its extended cooler dust distribution with (45–60) K and significant optical depths at the far-IR (10; Lisenfeld et al. 2000). A simple expression for the emergent SED of such a dust configuration
| (10) |
where , =, can easily show the inadequacy of global dust emission SEDs in disentangling the true dust components. In Figure 8, after setting =40 K, =120 K 1, and 10, =108 M⊙ we plot the aforementioned SED which makes apparent that hot and compact starburst regions can remain inconspicuous in the global dust emission SED, apart from an emission contribution in the mm/sub-mm domain where a cold dust reservoir would also contribute (and thus the - degeneracy). This is a result of the high dust temperatures in the compact regions (which makes their emission peak at wavelengths where the outer dust distribution remains very absorptive i.e. at IR/far-IR wavelengths), and their high dust optical depths over almost the entire observed range of a typical SED. The latter diminishes the emission contribution of those compact and warm starburst regions well below from being proportional to their dust mass content.
4.3 The [C II] line luminosity deficit in ULIRGs: a dust optical depth effect?
One of the most unexpected discoveries made by ISO was the so-called [CII] line luminosity deficit for some of the most extreme starbursts in the local Universe (Malhotra et al. 1997; Luhman et al. 1998, 2003). This was deemed all the more perplexing for ULIRGs since the [CII] fine structure line at 157.74 m is the major ISM cooling line and would thus be expected to be particularly bright in such extreme star-forming systems. Various explanations have been offered for this such as : a) absorption by a cooler dust foreground “screen”, b) saturation of the [CII] line luminosity (while the IR continuum rises unabated) predicted for high density PDRs or PDRs in which the local UV radiation field is high and the gas density is low, c) soft far-UV radiation fields (see Malhotra et al. 1997; Luhman et al. 1998 for a review). Significant submm dust optical depths for the bulk of the dust mass suggests a simple and common cause for the [CII] and the high-J CO lines luminosity deficiency in some ULIRGs since in an almost featureless black body dust continuum, no lines are expected from a concomitant isothermal gas reservoir. In particular the weakness of the CO J=6–5 line argues against the most prominent alternative explanation given for the [CII] line luminosity deficit: the dense and/or strongly far-UV illuminated PDRs where in fact such high-J CO lines ought to be very luminous. Finally even modest submm dust optical depths such as 0.2 (from Equation 8 and = , =40 pc) correspond to 1.3 (for =2) for the dust continuum at the rest frequency of the [CII] line, yielding a F()==0.56 reduction in line strength with respect to the optically thin case.
5 CO SLEDs in LIRGs: effects of dust and AGN
High dust optical depths at short submm wavelengths in some LIRGs (worryingly amongst those frequently used as local analogues of high-z starbursts) can significantly suppress high-J CO or indeed any other high-frequency line emission from their starburst-fueling dense molecular gas distributions. In Figure 9 we demonstrate the effects of dust optical depth on the CO SLED of Arp 220, the first case where these can be significant (Papadopoulos et al. 2010). The highly-excited “intrinsic” CO SLED derived for its massive dense and warm gas phase (Greve et al. 2009) is shown overlaid by two SLEDS in which the effects of different dust optical depth on the intrinsic CO line luminosities are inserted using = (valid for an isothermal mix of gas and dust). We adopted an emissivity law of =2 and =0.2, 1.0 at the rest frequency of CO J=3–2 (350 GHz). These values bracket the range of submm optical depths deduced from submm interferometry (1; Sakamoto et al. 2008), and global IR/submm/mm dust SED fits (0.16; Lisenfeld et al. 2000 for =2).
From Figure 9 is apparent that even the small submm dust optical depths found from global dust SED of ULIRGs can have a substantial impact on their CO SLEDs from J=5–4 and beyond. In such dust-affected CO SLEDs the J-level of the line luminosity peak will not reflect a true global gas excitation turnover and thus deeply dust-enshrouded compact starbursts can have misleadingly “cool” CO SLEDs. This can particularly affect molecular line observations of high-z galaxies where mostly high-J CO lines are currently accessible. In such systems, unlike local LIRGs whose molecular gas properties can be constrained by many low frequency molecular lines (where dust optical depths remain negligible), separating dust optical depth effects from genuinely low-excitation gas can be difficult.
5.1 Low CO line excitation: the case of Arp 193
The physical conditions of star-forming molecular gas used to deduce its “intrinsic” CO SLED in LIRGs (section 3.1) are typical, however significant deviations do exist. Arp 193 with a star formation-related IR luminosity of =2.21011 L⊙ is notable in having the lowest (4–3)/(1–0), (3–2)/(1–0) HCN line ratios: 0.08 (2), =0.22 (Papadopoulos 2007; Krips et al. 2008), as well as a faint CO J=6–5 line with 0.08. These are indicative of very low excitation conditions for the bulk of its molecular gas reservoir while by comparison NGC 6240, a galaxy with a similar 3.81011 L⊙, has =0.6 and =0.8 (Greve et al. 2009), indicative of a much denser and warmer gas phase. Radiative transfer LVG modeling of HCN and CO (6–5)/(3–2) line ratios in Arp 193 (constrained also by 1) are consistent only with low density 100 cm-3 and warm =(85–110) K gas. These are highly atypical conditions for either vigorously star-forming LIRGs (where the ISM is usually dominated by dense and warm molecular gas), or quiescent galaxies (where molecular gas has similarly low densities but is much colder, 15 K), and demonstrate that even vigorously star forming systems can have low high-J CO line excitation for the bulk of their gas. The corresponding CO SLED for the dense gas in Arp 193 already turns over at CO J=3–2, in contrast to the HCN-bright star-forming phase of NGC 6240 which is expected to emit copiously up to CO J=10–9 (Figure 10). It should be noted that besides similar , these LIRGs both have (0.5–1) (for the CO-H2 conversion factor of Downes & Solomon 1998), global SF efficiencies 50 L⊙/M⊙, and similar dense gas mass fractions as indicated by = (0.05 for Arp 193, and 0.08 for NGC 6240). This shows that observables commonly available for LIRGs such as IR luminosity, CO J=1–0, and HCN J=1–0 lines, may provide no indication of very different molecular gas excitation conditions and CO SLEDs, at least on an individual object basis.
The rapid evolution of starburst events can in principle have short periods during which a (U)LIRG stays IR-luminous while its dense gas phase is strongly dispersed and/or depleted, by the formation of stars and their concentrated and coherent mechanical feedback (Loenen 2009). This could place LIRGs such as NGC 6240 and Arp 193 at the two ends of such a short evolutionary track, but observations of similar objects are needed to decide such issues. Finally we note that a population of near-IR selected gas-rich galaxies with ULIRG-levels of star formation (100–150 ) but very low (comparable to the Milky-Way) levels of global molecular gas excitation, and star-formation efficiency similar to Arp 193, has been recently revealed at high redshifts (Daddi et al. 2008; Dannerbauer et al. 2009).
5.2 Suppressed high-J CO lines: dust absorption versus low gas excitation
Once both possibilities of large dust optical depths at short submm wavelengths and low gas excitation have been recognized as affecting emergent CO SLEDs, they can be hard to tell apart without additional information from other lines tracing the dense star-forming phase. These are low-J transitions (thus not affected by dust) of HCN or CS, but can be difficult to detect on a routine basis, even in bright nearby LIRGs, since the brightest such line: HCN J=1–0, typically has (1/5–1/30) (e.g. Gao & Solomon 2004). An incidious aspect of the aforementioned degeneracy is that some of the most extreme starbursts in the Universe can show “cold” CO SLEDs despite hosting intense star forming activity simply because their low CO (high-J)/(low-J) line ratios are attributed to low-excitation (i.e. non star-forming) molecular gas rather than dust absorption. As already discussed in sections 4.1 and 4.2, global dust emission cannot provide a definitive distinction either, even with well-sampled dust SEDs in the crucial IR/submm range.
In Figure 11 we show a possible statistical distinction between these two possibilities using CO J=1–0 (the main bulk molecular gas mass tracer), HCN J=1–0 (the most widely used dense gas tracer), along with CO J=6–5, 3–2. The = ratio (Table 2) is considered here as an approximate measure of the dense molecular gas mass fraction (since 410 cm-3 and 2105 cm-3), with little sensitivity to temperature since for both CO and HCN J=1–0: 4–5 K. The low frequencies of 115 GHz (CO J=1–0) and 87 GHz (HCN J=1–0), ensure that remains unaffected by dust extinction. From Figure 11 becomes apparent that several LIRGs have very high () and very low 0.2 ratios, quite unlike typical star-forming galaxies with much lower IR luminosities (and thus SFRs). Thus, unless one is willing to entertain the possibility of massive amounts of dense but otherwise SF-idle molecular gas in these (mostly) merger systems, such LIRGs are likely to be starbursts with dust-suppressed high-J CO lines.
Considering star formation as a process directly fueled by self-gravitating dense gas means that star formation switches on rapidly in the dense HCN-bright phase, with its typically short dynamical times 105 yrs (much shorter than Giant Molecular Cloud evolutionary timescales of 106–107 yrs). This likely yields the tight – correlation in galaxies (Gao & Solomon 2004), extending “down” to individual GMCs and spanning 7-8 orders of magnitude in (Wu et al. 2005). It also provides the basis for our aforementioned CO-HCN line ratio diagnostic and its ability to “weed-out” dust-affected CO SLEDs from genuinely low-excitation ones. In the few cases where multi-J dense gas tracers (e.g. HCN, CS) and dust SEDs are available to constrain the state of the dense gas in LIRGs, it is always found in the warm and self-gravitating “corner” of the available parameter space, typical of star-forming gas (Mao et al. 2000; Papadopoulos et al. 2007; Greve et al. 2009), and where 0.45. Moreover for the lowest possible temperature of 10 K in dense starless cores deep in GMCs (regulated by cosmic rays rather than photons), a minimum
| (11) |
is expected for the optically thick CO emission (shown also in Figure 4 as a dotted line). Thus even for the unlikely case of a high ratio due to a massive and dense but otherwise SF-idle cold gas phase, this is the lowest value possible. Values of 0.3 would then imply either a dominant gas phase that necessarily has 104 cm-3 (and thus also low ), or dust-suppression of the CO J=6–5 line luminosity. In the second case such dust-affected LIRGs would then populate the area marked by 0.3 and 0.15, shown in Figure 11 to be containing several objects.
5.3 AGN effects on the high-J CO lines
The brightest CO J=6–5 lines in our sample are measured in the hosts of two powerful AGNs, the optically luminous QSO PG 1119+120 and the FR II radio galaxy 3C 293 known for a particularly powerful jet (Floyd et al. 2006). These are also the only two objects where 1, possible only for CO line emission that is optically thin and remains well-excited up to J=6–5, which requires very warm and dense molecular gas. This becomes apparent from its maximum value, achieved in the LTE optically thin limit,
| (12) |
where (the CMB has been omitted for simplicity). For PG 1119+120 even =2 (i.e. (the measured value)–) yields , which is rather high for the bulk of its molecular gas. Submm interferometric imaging has recently uncovered such high brightness temperatures for the dust (and thus for the concomitant molecular gas since ) in Arp 220, but its molecular gas reservoir consists of very dense gas with CO line optical depths that are nowhere near the optically thin limit (Greve et al. 2009). Comprehensive LVG radiative transfer modeling of such a high CO (6–5)/(3–2) ratio, made over a larger gas temperature range of =(15–310) K (to allow the possibility of very warm gas) yields its best solutions for 105 cm-3 and 140 K (with solutions improving right up to 310 K). Such high gas temperatures could in principle be the result of bulk irradiation of the molecular gas by X-rays emanating from a central AGN creating giant X-ray Dominated Regions (XDRs), rather than starburst-induced far-UV irradiated Photon dominated Regions (PDRs) (see Meijerink & Spaans 2005). Very high CO line excitation in AGN hosts that could be attributed to X-ray luminous AGN has been recently observed (Papadopoulos et al. 2008), but unfortunately no X-ray data are available for PG 1119+120 in particular, and the cause of its large CO J=6–5 luminosity remains unknown.
5.4 CO lines in 3C 293: a shock-powered CO SLED?
Large amounts of molecular gas (–) have been discovered in IR-luminous powerful radio galaxies locally as well as at high redshifts (e.g. Evans et al. 1999, 2005; De Breuck et al. 2005). In 3C 293, shocks emanating from a very strong jet-ISM interaction (Emonts et al. 2005) may be responsible for a galaxy-wide shock-induced CO line excitation (Papadopoulos et al. 2008). A “trademark” of this excitation mechanism could be its capability of producing highly excited mid-J and high-J CO lines, even in the absence of high star formation rates, since the shock-induced turbulent heating would deposit most of its energy on the gas leaving the concomitant dust mass reservoir much less affected. The high luminosity CO J=4–3 and J=6–5 lines in 3C 293, with (4–3)/(3–2), (6–5)/(3–2) ratios of =2.30.91 and =1.30.54, seem to bear this out by representing some of the highest levels of global molecular gas excitation discovered in our sample but in a system whose low-level star formation (4 M⊙ yr-1) is insufficient to “power” them.
We extended our LVG modeling of the extraordinarily high and ratios in 3C 293 to cover a larger range of =(15–310) K and allow also 1 rather than 1. We do so because turbulent heating can drive molecular gas temperatures well above those in star forming regions (where typically ), while widens the LVG solution search to include non self-gravitating gas phases. These are now more probable given the large kinetic energy injection from the powerful jets driving very impressive gas outflows in 3C 293 (Morganti et el. 2003; Emonts et al. 2005), and the fact that no massive star-forming (and thus self-gravitating) gas phase “powering” the luminous high-J CO lines is present in 3C 293. The characteristics of the various LVG solution groups are summarized in Table 4, where two facts immediately stand out: a) the best solutions are provided by a very warm (130–310) K and dense (–) gas phase, and b) most solutions with 80 K are ruled out since they have 1 (marked with asterisk in Table 4). Such kinematic states are deemed unphysical since gas motions cannot be slower than those induced by gas self-gravity (only raising the abundance by factors of 10 could make 1). On the other hand, almost all of the good solutions found have 15–49, indicating highly unbound gas states. We must also note that in all solutions listed in Table 4 the fit continues improving well past the =310 K limit of the LVG parameter grid, while gas densities remain high ((–)). On the other hand the non-AGN cool dust SED in 3C 293 carries little luminosity ( L⊙) and is typical for quiescent ISM.
Thus in the powerful radio galaxy 3C 293 the molecular gas seems to be in a surprisingly hot, dense, and gravitationally unbound state, whilst the bulk of its concomitant dust reservoir maintains lower temperatures and has only a modest IR luminosity. Tellingly, similar ISM conditions have been reported for the turbulent molecular clouds in the Galactic Center (Rodriguez-Fernández et al. 2001) where very warm and dense H2 is concomitant with cold dust (Pierce-Price et al. 2000), as well as in 3C 326, another another FR II radio galaxy (Ogle et a. 2007). In the latter case jet-induced shocks are also suggested as the culprit for a LIRG-sized mass (109 M⊙) of very warm molecular gas (125–1000 K), despite star formation levels even lower (0.1) than those found in 3C 293.
In Figure 12 we show the range of CO SLEDs corresponding to the shocked-excited ISM environment of 3C 293. Clearly more observations of high-J CO lines, now possible with the spaceborne Herschel Space Observatory, are needed to better constrain them and verify shock-excited molecular gas over large scales in this powerful radio galaxy and other similar systems. The very large molecular gas reservoirs found around radio galaxies at high redshifts, and the potential feedback role of their energetic jets in inducing (Klamer et al. 2004) or hindering (Ogle et al. 2007) starbursts in galaxy-formation events at early cosmic epochs, makes a detailed study of shock-energized molecular gas even more important. Distinct and accessible “signatures” of shocked molecular gas states on SLEDs of various molecules would be particularly valuable in the upcoming era of ALMA.
5.5 The diagnostic power of IR/submm ISM lines revisited
Extremely dense and compact gaseous disks able to attain significant dust optical depths at short submm wavelengths in LIRG/AGN systems can have dramatic effects on their emergent ISM lines used as AGN-versus-starburst diagnostics. In the presence of such gas disks around AGN, ISM line diagnostic using IR and even molecular lines at short submm wavelengths (e.g. very high-J CO lines) to discriminate between dust-enshrouded AGN-excited XDRs versus starburst-excited PDRs can be become difficult to employ. Relative line strengths may then be more indicative of relative dust optical depths rather than intrinsic gas excitation properties and their causes. Interestingly all four LIRGs with (i.e. IRAS 02483+4302, VII Zw 31, PG 1119+120, and Mrk 231) have face-on or nearly face-on molecular gas disks, indicated either by high-resolution CO interferometry (Downes and Solomon 1998) and/or by their narrow CO line widths (3C 293 is the only exception). This would be expected for gas disks where the smaller dust optical depths in face-on than in highly inclined gas disks along the line of sight would enhance their (line)-(continuum) contrast. Nevertheless nearly face-on systems with low ratios do exist (e.g. IRAS 00057+4021), and systematic CO J=6–5 observations of optically-selected QSO samples (which will contain many more face-on gas disks) would be valuable in revealing such geometric effects.
6 Conclusions
We report on our new sensitive CO J=6–5 observations of LIRGs and two powerful AGN with the JCMT, part of a now completed multi-J CO and HCN molecular line survey. Our findings are as follows:
1. Large dust optical depths at short submm wavelengths can suppress the CO J=6–5 line in some extreme starbursts by immersing it in strong continuum dust emission. This can yield faint CO J+1J lines for J+16, even in ULIRGs whose large amounts of dense star-forming molecular are intrinsically luminous in such lines. Such high optical depths can easily account for the so-called [CII] line luminosity deficity known to exists in such systems.
2. Similar conditions may be present in high redshift galaxies, yielding deceptively “cool” CO SLEDs at high frequencies even in extreme starbursts such as the submillimeter galaxies.
3. Global dust emission SEDs cannot unambigiously distinguish between high dust optical depths at far-IR/submm wavelengths or large amounts of cold dust, as they can both contribute to the far-IR/submm part of the dust emission SED in a similar fashion.
4. The very low CO and HCN line excitation in Arp 193 demonstrates that low global gas excitation remains possible even in vigorously star-forming LIRGs.
5. The suppressing effects of high dust optical depths on the high frequency part of CO SLEDs are difficult to distinguish from genuine low gas excitation. Low-frequency (350 GHz) line observations of highly dipolar heavy rotor molecules (e.g. HCN, CS), with their high critical densities but unhindered by potentially large dust extinctions at submm wavelengths, can “break” this degeneracy. In the simplest such application we propose that LIRGs with large HCN/CO J=1–0 but very low CO (6–5)/(3–2) line ratios are likely to have dust-affected rather than low-excitation CO SLEDs.
6. Remarkably high CO line excitation, above that typical for star-forming gas, is found for the hosts of two prominent AGN, an optically bright QSO (PG 1119+120) and a radio galaxy (3C 293). The latter could be the first known case of a shock-excited CO SLED, likely powered by a strong jet-ISM interaction. As a result much of its large molecular gas reservoir is hot (100 K) and dense (104 cm-3) while most of its dust mass remains “cool” (15 K) typical of quiescent ISM with low star formation rates.
In summary, the emerging picture of CO SLEDs in LIRGs and AGN seems diverse, with high dust optical depths at short submm wavelengths capable of “quenching” high-J CO line emission in extreme starbursts while low global gas excitation remaining a possibility in such systems. Finally, shocks and possibly X-rays seem capable of surpassing far-UV photons as the main excitation contributors in AGN hosts. The now spaceborne Herschel Space Observatory is ideally suited for fully characterizing these environments via high-J molecular line observations of local IR-bright galaxies and AGN, paving the way for ALMA and the study of such phenomena across cosmic epoch.
References
- (1) Aalto S., Booth R. S., Black J. M.,& Johansson L. E. B. 1995 A&A, 300, 369
- (2) Baker A. J., Tacconi L. J., Genzel R., Lehnert M. D., & Lutz D. 2004, ApJ, 604, 125
- (3) Bayet, E., Gerin, M., Phillips, T.G., & Contursi, A. 2006, A&A, 460, 467
- (4) Bryant P. M., & Scoville N. Z. 1999, AJ, 117, 2632
- (5) Condon J. J., Huang Z.-P., Yin Q. F., & Huan T. X. 1991, ApJ, 378, 65
- (6) Condon J. J. 2001, in Single-dish Radio Astronomy: Techniques and Applications ASP Conf. Series, Vol. 278, pg. 160
- (7) Cox P., & Laureijs R. 1989, in The Center of the Galaxy: IAU Symposium No 136 Kluwer Academic Publishers, Dordrecht, p.121
- (8) Daddi E., Dannerbauer H., Elbaz D., et al. 2008, ApJ, 673, L21
- (9) Dannerbauer H., Daddi E., Riechers D. A. et al. 2009, ApJ, 698, L178
- (10) De Breuck C., Downes D., Neri R., van Breugel W., Reuland M., Omont A., & Ivison R. 2005, A&A, 430, L1
- (11) Devereux N. A., & Young J. S. 1990, ApJ, 359, 42
- (12) Downes D., & Solomon, P. M. 1998, ApJ, 507, 615
- (13) Downes D., & Eckart A. 2007, A&A, 468, L57
- (14) Elmegreen B. G., Klessen R. S., & Wilson C. D. 2008, ApJ, 681, 365
- (15) Evans A. A., Sanders D. B., Surace J. A., & Mazzarella J. M. 1999, ApJ, 511, 730
- (16) Evans A. S. Surace J. A., & Mazzarella J. M. 2000, ApJ, 529, L85
- (17) Evans A. S., Frayer D. T., Surace J. A., & Sanders D. B. 2001, AJ, 121, 3286
- (18) Evans A. A., Mazzarella J. M., Surace J. A., & Sanders D. B. 2002, ApJ, 580, 749
- (19) Evans A. A., Mazzarella J. M., Surace J. A., Frayer D. T. Iwasawa K., & Sanders D. B. 2005, ApJS, 159, 197
- (20) Emonts B. H. C., Morganti R., Tadhunter C. N., Oosterloo T. A., Holt J., & van der Hulst J. M. 2005, MNRAS, 362, 931
- (21) Floyd D. J. E., Perlman E., Leahy J. P. et al. 2006, ApJ, 639, 23
- (22) Gao Y. & Solomon P. M. 2004, ApJ, 606, 271
- (23) Goldsmith P. F. 2001, ApJ, 557, 736
- (24) Graciá-Carpio J., García-Burillo S., Planesas P., & Coline L. 2006, ApJ, 640, L135
- (25) Graciá-Carpio J., García-Burillo S., Planesas P., Fuente A., & Usero A. 2008, A&A, 479, 703
- (26) Greve T. R., Bertoldi F., Smail Ian, et al. 2005, MNRAS, 359, 1165
- (27) Greve T. R., Papadopoulos, P. P., Gao Y., & Radford S. J. E. 2009, ApJ, 692, 1432
- (28) Güsten R., Serabyn E., Kaseman C., et al. 1993, ApJ, 402, 537
- (29) Hughes D. H., Serjeant S., Dunlop J., et al. 1998, Nature, 394, 241
- (30) Iono D., Ho P. T., Yun M. S., Matsushita S., Peck A. B., Sakamoto K. 2004, ApJ, 616, L63
- (31) Iono D., Wilson C. D., Yun M. S., et al. 2009, ApJ (in press, arXiv:0902.0121)
- (32) Jansen D. J., 1995, PhD Thesis, Leiden Observatory
- (33) Klamer I. J., Ekers R. D., Sadler E. M., & Hunstead R. W. 2004, ApJ, 612, L97
- (34) LeFloc’h E., Aussel H., Ilbert O. et al. 2009, ApJ, 703, 222
- (35) Lisenfeld U., Isaak K. G., & Hills R. 2000, MNRAS, 312, 433
- (36) Loenen E. 2009, PhD Thesis, Univ. of Groeningen, pg. 113
- (37) Luhman M. L., Satyapal S., Fischer J. et al. 1998, ApJ, 504, L11
- (38) Luhman M. L., Satyapal S., Fischer J., et al. 2003, ApJ, 594, 758
- (39) Mao R. Q., Henkel C., Schulz A., et al. 2000, A&A, 358, 433
- (40) Marrone D. P., Battat J., Bensch F. et al., 2004, ApJ, 612, 940
- (41) Matsushita S., Iono D., Petitpas G., et al. 2009, ApJ, 693, 56
- (42) Meijerink R., & Spaans M. 2005, A&A, 436, 397
- (43) Morganti R., Oosterloo T. A., Emonts B. H. C., van der Hulst J. M., & Tadhunter C. N. 2003, ApJ, 593, L69
- (44) Omont A. 2007, Rep. Prog. Phys. 70, 1099
- (45) Ogle P., Antonucci R., Appleton P. N., & Whysong D. 2007, ApJ, 668, 699
- (46) Papadopoulos P. P., & Seaquist E. R. 1999, ApJ, 516, 114
- (47) Papadopoulos P. P., & Ivison, R. J. 2002, ApJ, 564, L9
- (48) Papadopoulos P. P., Kovacs A., Evans A. S. & Barthel P. 2008, A&A, 483, 487
- (49) Papadopoulos P. P., Isaak K. G., & van der Werf P. P. 2007, ApJ, 668 815
- (50) Papadopoulos P. P., Isaak K. G., & van der Werf P. P. 2010, ApJ, 771, 757
- (51) Papadopoulos P. P., Isaak K. G., van der Werf P. P., & Xilouris E. M. 2010, (in preparation)
- (52) Pierce-Price D., Richer J. S., Greaves J. S. 2000, ApJ, 545, L121
- (53) Planesas P., Mirabel I. F., & Sanders D. B. 1991, ApJ, 370, 172
- (54) Rodrígez-Fernández N. J. Martín-Pintado J., Fuente A., et al. 2001, A&A, 365, 174
- (55) Sakamoto K., Scoville N. Z., Yun M. S., Crosas M., Genzel R., & Tacconi L. J. 1999, ApJ, 514, 68
- (56) Sakamoto K., Wang J., Wiedner M. C., et al. 2008, ApJ, 684, 957
- (57) Sanders D. B., Scoville N. Z., Sargent A. I., & Soifer B. T. 1988, ApJ, 324, L55
- (58) Sanders D. B., & Mirabel I. F. 1989, ApJ, 1989, 340, L53
- (59) Sanders D. B., Scoville N. Z., & Soifer B. T. 1991, ApJ, 370, 15 8
- (60) Sanders D. B., & Mirabel I. F. 1996, ARA&A, 34, 749
- (61) Sanders D. B., Scoville N. Z., & Soifer B. T. 1991, ApJ, 370, 158
- (62) Sanders D. B., Mazzarella J. M., Kim D.-C., Surace J. A., & Soifer B. T. 2003, AJ, 126, 1607
- (63) Sanders D. B., & Ishida C. M., 2004, in The Neutral ISM in Starburst Galaxies ASP Conference Series, Vol. 320, pg. 230
- (64) Scoville N. Z., Yun M., Bryant P. M. 1997, ApJ, 484, 702
- (65) Scoville N. Z., 2004, in The Neutral ISM in Starburst Galaxies ASP Conference Series, Vol. 320, pg. 253
- (66) Schleicher D. R. G., Spaans M.,& Klessen R. S. 2010, A&A, (in press, arXiv:1001.2118)
- (67) Sodroski T. J., Bennett C., Boggess N. et al. 1994, ApJ, 428, 638
- (68) Solomon P. M., Radford S. J. E. & Downes D. 1990, ApJ, 348, L53
- (69) Solomon P. M., Downes D., & Radford S. J. E. 1992, ApJ, 387, L55
- (70) Solomon P. M., Downes D., Radford S. J. E., & Barrett J. W. 1997, ApJ, 478, 144
- (71) Solomon P. M., & Vanden Bout P. A., 2005, ARA&A, 43, 677
- (72) Soifer B. T., Neugebauer G., Helou G. et al. 1984, ApJ, 283, L1
- (73) Soifer B. T., Sanders D. B., Madore B. F., et al. 1987, ApJ, 320, 238
- (74) Soifer B. T., Boehmer L., Neugebauer G., & Sanders D. B. 1989, AJ, 98, 766
- (75) Smail I., Ivison R. J., & Blain A. 1997, ApJ, 490, L5
- (76) Tacconi L. J., Neri R., Chapman S. C., Genzel R., Smail I., Ivison R. J., Bertoldi F., Blain A., Cox P., Greve T. R., & Omont A. 2006, ApJ, 640, 228
- (77) Thomas H. C., Clemens M. S., Alexander P., Green D. A., Eales S., & Dunne L. 2001, in Gas and Galaxy Evolution, ASP Conference Proceedings, Vol. 240. p. 224
- (78) Tinney C. G., Scoville N. Z., Sanders D. B., & Soifer B. T. 1990, ApJ. 362, 473
- (79) Walter F., Carilli C., Bertoldi F. et al. 2004, ApJ, 615, L17
- (80) Walter F., & Carilli C. 2008, in Science with the Atacama Large Millimeter Array Ap&SS, 313, 313
- (81) Wang Z., Scoville N. Z., & Sanders D. B. 1991, ApJ, 368, 112
- (82) Weiss A., Downes D., Walter F., & Henkel C. 2007a, in From Z-machines to ALMA: (Sub)Millimeter Spectroscopy of Galaxies, ASP Conference Series, Vol 375, pg. 25
- (83) Weiss A., Downes D., Neri R., Walter F., Henkel C., Wilner D. J., Wagg J., Wiklind T. 2007b, A&A, 467, 955
- (84) Wilson C. D., Petitpas G. R., Iono D., et al. 2008, ApJS, 178, 189
- (85) Wright E. L. 2006, PASP, 118, 1711
- (86) Wu J., Evans N. J. II., Gao Yu, et al. 2005, ApJ, 635, L173
- (87) Yao L., Seaquist E. R., Kuno N., & Dunne L. 2003, ApJ, 588, 771


| GalaxyaaIRAS source name and the most common alternative | RA (J2000)bbThe source coordinates used for the observations. | Dec (J2000)bbThe source coordinates used for the observations. | ccThe luminosity distance in Mpc, and the corresponding redshift in the parenthesis. | dVddVelocity-integrated line flux density (in Jy km s-1) with
the (value,type) of any applied corrections
reported in the parenthesis (see 2.2). All upper limits are at the 2 level. |
|---|---|---|---|---|
| IRAS 00057+4021 | 00 08 20.58 | 40 37 55.5 | 194.5(0.0445) | (1.29,G) |
| IRAS 02483+4302 | 02 51 36.01 | 43 15 10.8 | 225.8(0.0514) | (1.27,G) |
| IRAS 04232+1436 | 04 26 04.94 | 14 43 37.9 | 356.4(0.0795) | (1.21,G) |
| IRAS 05083+7936 (VII Zw 031) | 05 16 46.51 | 79 40 12.5 | 239.0(0.0543) | (1.22,G) |
| IRAS 05189–2524 | 05 21 01.41 | 25 21 44.9 | 186.4(0.0427) | (1.20,G) |
| IRAS 08572+3915(NW nucleus) | 09 00 25.4 | 39 03 54.0 | 256.9(0.0582) | (1.21,G) |
| IRAS 09126+4432 (Arp 55 NE) | 09 15 55.63 | 44 19 58.0 | 173.3(0.0398) |
(1.9)eePossible detection for the NE nucleus only, highly uncertain because of a pointing
offset of
3.85′′ (thus a beam-shift point-source correction factor of 1.90 has been applied). |
| IRAS 09320+6134 (UGC 05101) | 09 35 51.53 | 61 21 11.6 | 171.1(0.0393) | (1.35,G) |
| IRAS 10173+0828 | 10 20 00.19 | 08 13 34.5 | 214.4(0.0489) | (1.27,G) |
| IRAS 10565+2448 | 10 59 18.15 | 24 32 34.4 | 188.2 (0.0428) | (1.35,G) |
| IRAS 11191+1200 (PG 1119+120) | 11 21 47.12 | 11 44 18.3 | 219.4(0.0500) | (1.14,Kc) |
| IRAS 12112+0305 (NE)ffTentative detection of the bright NE nucleus (75% of the CO emission
of this double nuclei
system (Evans et al. 2002). The SW nucleus was not detected, but this particular observation may have suffered from a telescope pointing offset. |
12 13 46.00 | 02 48 41.0 | 324.4(0.0727) | (1.22,G) |
| “ “ (SW)ffTentative detection of the bright NE nucleus (75% of the CO emission
of this double nuclei
system (Evans et al. 2002). The SW nucleus was not detected, but this particular observation may have suffered from a telescope pointing offset. |
12 13 45.90 | 02 48 39.0 | 324.4(0.0727) | (1.21,G) |
| IRAS 12540+5708 (Mrk 231)ggFrom Papadopoulos et al. 2007 but for , and a G correction applied (see 2.2.1) | 12 56 14.21 | 56 52 25.1 | 184.1(0.0422) | (1.29,G) |
| IRAS 13183+3423 (Arp 193) | 13 20 35.32 | 34 08 22.2 | 100.2(0.0233) | (1.28,G) |
| IRAS 13428+5608 (Mrk 273) | 13 44 42.12 | 55 53 13.5 | 163.9(0.0378) | (1.45,G) |
| IRAS F13500+3141 (3C 293) | 13 52 17.77 | 31 26 46.1 | 194.9(0.0446) | (1.29,Kc) |
| IRAS 15107+0724 (Zw 049.057) | 15 13 13.07 | 07 13 32.0 | 55.0(0.0129) | (1.14,Kc) |
| IRAS 15237+2340 (Arp 220) | 15 34 57.24 | 23 30 11.2 | 78.0(0.0182) | (1.21,G) |
| IRAS 16504+0228 (NGC 6240) | 16 52 59.05 | 02 24 05.8 | 104.6(0.0243) | (1.21,G) |
| IRAS 17208–0014 | 17 23 21.92 | 00 17 00.7 | 186.8(0.0428) | (1.17,G)hhVery tentative detections |
| IRAS 23007+0836 (NGC 7469) | 23 03 15.60 | 08 52 26.3 | 69.7(0.0163) | iiObtained with ZEUS at the CSO, van der Werf et al. 2010. |
| IRAS 23365+3604 | 23 39 01.25 | 36 21 08.4 | 285.6(0.0644) | (1.37,G)hhVery tentative detections |
| Galaxy | aaThe SF+cold cirrus (=LIR(total)-LIR(AGN)) and SF-related IR luminosities, obtained from their respective SED components (see section 4) integrated over =(8–1000) m. | aaThe SF+cold cirrus (=LIR(total)-LIR(AGN)) and SF-related IR luminosities, obtained from their respective SED components (see section 4) integrated over =(8–1000) m. | bbThe = ratio ( estimated from Equation 3), with CO J=3–2 data obtained from Papadopoulos et al. 2010b (all upper limits are at the 2 level). | ccThe = ratio (cf. Equation 3). The HCN J=1–0 line fluxes are from Gao & Solomon 2004 and Gracia-Carpio et al. 2006. In cases of disagreement (Arp 193, IRAS 23365+3604, and IRAS 17208–0014) we adopted the values from the latter as more reliable. The CO J=1–0 fluxes used are averages from literature data compiled in Papadopoulos et al. 2010b. For NGC 6240 and Arp 220 we used the values reported by Greve et al. 2009. |
|---|---|---|---|---|
| IRAS 00057+4021 | 11.46 | 11.46 | ||
| IRAS 02483+4302 | 11.70 | 11.54 | ||
| IRAS 04232+1436 | 11.88 | 11.87 | ||
| VII Zw 031 | 11.89 | 11.69 | ||
| IRAS 05189–2524 | 12.06 | 11.95 | ||
| IRAS 08572+3915 | 12.01 | 11.99 | ||
| Arp 55 (NE nucleus)ddThe ratio is highly uncertain. We assumed that of the total IR luminosity of this double-source system emanates from the NE nucleus (same fraction as its CO J=3–2 luminosity (Leech et al. 2010). | 11.27 | 10.95 | ||
| IRAS 09320+6134 | 11.88 | 11.59 | ||
| IRAS 10173+0828 | 11.74 | 11.62 | ||
| IRAS 10565+2448 | 11.89 | 11.81 | ||
| PG 1119+120 | 10.71 | 10.46 | ||
| IRAS 12112+0305(NE nucleus) | 12.22 | 12.08 | ||
| Mrk 231 | 12.25 | 12.14 | ||
| Arp 193 | 11.57 | 11.34 | ||
| Mrk 273 | 12.08 | 11.92 | ||
| 3C 293 | 10.49 | 10.06 | ||
| Zw 049.057 | 11.10 | 11.07 | ||
| Arp 220 | 12.12 | 12.00 | ||
| NGC 6240 | 11.76 | 11.58 | ||
| IRAS 17208–0014 | 12.32 | 12.19 | ||
| NGC 7469 | 11.40 | 11.21 | ||
| IRAS 23365+3604 | 12.15 | 11.79 |
| Galaxy | bbThe cold/warm dust mass ratio. | |||||||
|---|---|---|---|---|---|---|---|---|
| (K), (K) | ||||||||
| IRAS 00057+4021**Very sparsely sampled dust SED, highly uncertain fit. | 37, 6 | 134 | 25.7 | 4.1 | 1.5 | 8.7, 65 | 0.4 | 1057 |
| IRAS 02483+4302 | 36, 20 | 17 | 4.6 | 3.6 | 8 | 11, 49 | 2.0 | 176 |
| IRAS 04232+1436 | 35, 9 | 33 | 23.7 | 10 | 4 | 24, 69 | 0.80 | 1220 |
| VII Zw 031 | 51, 23 | 80 | 3.6 | 11.5 | 32 | 21, 55 | 11 | 107 |
| IR 05189–2524 | 60, 28 | 33 | 1.1 | 3.9 | 35 | 4.8, 72 | 0.7 | 557 |
| IRAS 08572+3915 | 52, 19 | 21 | 8.2 | 1.6 | 1.9 | 10, 85 | 6.5 | 24 |
| IRAS 09320+6134 | 40, 25 | 19 | 2.9 | 4.8 | 16 | 5, 47 | 3.7 | 131 |
| IRAS 10173+0828 | 48, 23 | 27 | 1.5 | 6.0 | 39 | 10, 64 | 0.60 | 993 |
| IRAS 10565+2448 | 41, 23 | 7 | 1.9 | 6.4 | 32 | 6.2, 61 | 1.3 | 516 |
| PG 1119+120 | 41, 22 | 29 | 0.3 | 0.5 | 16 | , | ||
| IRAS 12112+0305 (NE nucleus) | 43, 25 | 10 | 3.3 | 7.5 | 22 | 5.3, 60 | 2.8 | 272 |
| Mrk 231 | 44, 28 | 5 | 1.9 | 7.0 | 36 | 4, 66 | 2.1 | 336 |
| Arp 193 | 42, 27 | 10 | 0.7 | 4.7 | 59 | 0.5, 38 | 3.9 | 119 |
| Mrk 273 | 52, 29 | 18 | 1.3 | 5 | 38 | 4, 65 | 1.3 | 385 |
| 3C 293 | 57, 22 | 459 | 0.2 | 4.6 | 177 | 5, 38 | 0.3 | 1398 |
| Zw 049.057 | 33, 17 | 4 | 0.6 | 0.9 | 13 | 7, 52 | 0.4 | 214 |
| Arp 220 | 46, 22 | 30 | 5.7 | 6.0 | 11 | 10.5, 62 | 1.8 | 339 |
| NGC 6240 | 52, 26 | 37 | 8.0 | 8 | 10 | 5.6, 59 | 0.8 | 976 |
| IRAS 17208–0014 | 46, 24 | 19 | 5.3 | 13 | 24 | 7.4, 60 | 3.2 | 416 |
| NGC 7469 | 42, 27 | 9 | 0.4 | 3.5 | 72 | 4.5, 55 | 0.6 | 602 |
| IRAS 23365+3604 | 60, 30 | 84 | 8.2 | 7 | 8 | 3, 54 | 3.0 | 223 |
| (4–3)/(3–2), (6–5)/(3–2)aaCO line luminosity ratios (Eq. 3),
with (type) denoting the values used, for example:
(measured)=(, ),
(minimum)= [, ] etc |
bbThe minimum virial parameter of the LVG solutions (Eq. 6 for ). Values are forbidden (see 3.1) and are marked with an asterisk. | ccThe of the LVG fit of the observed line ratios , when a range of values is reported, the low values always correspond to the highest temperatures. | ||
|---|---|---|---|---|
| (K) | () | |||
| 2.3, 1.3 (measured) | 15–125 | (1–3) | 0.027–0.154∗ | 2.21–1.6 |
| 130–310 | 15.4 | 1.6–1.23 | ||
| 1.27, 0.7 (minimum) | 15–30 | (0.3–3) | 0.027–0.154∗ | 1.16–0.74 |
| 40–55 | 0.27∗ | 0.7 | ||
| 75–115 | 27.4 | 0.63 | ||
| 135–255 | 4.9–15.4 | 0.68–0.59 | ||
| 260–310 | 49 | 0.58-0.51 | ||
| 2.3 ddFor , the observed value is so high that is effectively identical to the LTE, optically thin limit: , thus we do not consider the case., 2.34 (maximum) | 15–125 | (1–3) | 0.027–0.154∗ | 2.42-1.94 |
| 130–310 | 15.4 | 1.93–1.54 | ||
| 1.27, 1.3 (medium) | 15–125 | (1–3) | 0.027–0.154∗ | 1.75–0.89 |
| 130–310 | 15.4 | 0.88-0.21 | ||
| 1.27, 2.3 (medium) | 15–125 | (1–3) | 0.027–0.154∗ | 2.11-1.56 |
| 130-310 | 15.4 | 1.56-1.15 | ||
| 2.3 ddFor , the observed value is so high that is effectively identical to the LTE, optically thin limit: , thus we do not consider the case., 0.7 (medium) | 15–30 | (0.3–3) | 0.027–0.154∗ | 1.66–1.4 |
| 40–55 | 0.27∗ | 1.36 | ||
| 80–130 | 27.4 | 1.31–1.33 | ||
| 145–245 | 4.9–15.4 | 1.35–1.30 | ||
| 250–310 | 49 | 1.30–1.25 |