Spectral Energy Distributions of Be and Other Massive Stars
Abstract
We present spectrophotometric data from 0.4 to 4.2 m for bright, northern sky, Be stars and several other types of massive stars. Our goal is to use these data with ongoing, high angular resolution, interferometric observations to model the density structure and sky orientation of the gas surrounding these stars. We also present a montage of the H and near-infrared emission lines that form in Be star disks. We find that a simplified measurement of the IR excess flux appears to be correlated with the strength of emission lines from high level transitions of hydrogen. This suggests that the near-IR continuum and upper level line fluxes both form in the inner part of the disk, close to the star.
1 Introduction
The observed absolute flux from an astronomical source (after correction for telluric and interstellar extinction) is directly related to its emitted flux and angular size in the sky. As we enter the era of optical long-baseline interferometry, it will become easier to measure the angular dimensions of many objects and, consequently, to explore the relationship between the observed and emitted flux distributions. This effort is especially important to determine effective temperatures of stars, but it also plays a key role in the interpretation of circumstellar environments, in particular the disks surrounding Be stars and the winds and outflows of massive stars.
Be stars are rapidly rotating B-type stars that manage to eject gas into a circumstellar disk (observed in H emission lines, an infrared flux excess, and linear polarization; Porter & Rivinius 2003). The IR flux excess from the disk results from bound-free and free-free emission from ionized gas, and this emission increases with wavelength, so that in the near and mid-IR the disk flux will dominate over the stellar flux. Models of the IR excess can relate the observations to the disk radial density function (Waters, 1986; Dougherty et al., 1994; Porter, 1999). Such models are also required to interpret recent near-IR interferometric observations of Be stars where the ratio of disk to stellar flux is a key parameter (Stee & Bittar, 2001; Gies et al., 2007; Meilland et al., 2007; Carciofi et al., 2009). However, Be star disks are intrinsically variable on timescales of months to years (Hubert & Floquet, 1998; Porter & Rivinius, 2003; McSwain et al., 2008), so it is necessary to obtain contemporaneous spectrophotometry in order to model both the total flux and its angular distribution in the sky. There are many emission lines of H and He in the near-IR spectra of Be stars (Clark & Steele, 2000; Steele & Clark, 2001; Lenorzer et al., 2002a; Mennickent et al., 2009), and they offer additional diagnostics of the disk density, temperature, and geometry (Hony et al., 2000; Lenorzer et al., 2002b; Jones et al., 2009).
We have embarked on a number of programs of interferometry with the Georgia State University Center for High Angular Resolution Astronomy (CHARA) Array, a six-telescope, optical/IR interferometer with baselines up to 330 m (ten Brummelaar et al., 2005). Here we describe a program of complementary optical and near-IR spectrophotometry of our targets that we will use in detailed modeling of the source angular flux distribution. The observations and their calibration are described in §2, and we present figures of the target spectral energy distributions and emission line strengths in §3 and §4, respectively. In §5 we discuss the relationship between the disk continuum and line emission of Be stars, and we present a summary of the work in §6.
2 Observations and Reductions
We obtained optical spectrophotometry in 2006 and 2008 with NOAO Kitt Peak National Observatory Coudé Feed telescope. These observations cover parts of the blue and red spectrum as outlined in Table 1 that lists (1) the UT dates and (2) heliocentric Julian dates of observation, (3) the wavelength range recorded, (4) the spectral resolving power (for a nominal projected slit equivalent to three pixels), (5) the number of spectra made, and (6) a summary of the telescope, spectrographic grating, and detector. The KPNO observations were made with a slit width of to record most to all of the starlight, so the actual spectral resolution depends on the stellar point spread function and image motion during the exposure. Each observation was immediately preceded or followed by an identical observation of a flux calibrator star (discussed further below). All the observations were accompanied by dark, flat field, and ThAr comparison lamp (for wavelength calibration) frames, and the spectra were reduced and extracted by standard means in IRAF999IRAF is distributed by the National Optical Astronomical Observatory, which is operated by the Association of Universities for Research in Astronomy, Inc. (AURA), under cooperative agreement with the National Science Foundation. to produce a spectrum of integrated counts per second as a function of heliocentric wavelength.
We also obtained near-IR spectroscopy of most of the targets in 2006 with the NASA Infrared Telescope Facility and SpeX cross-dispersed spectrograph (Rayner et al., 2003) and in 2008 with the Mimir camera/spectrograph and Lowell Observatory Perkins Telescope (Clemens et al., 2007). Both sets of observations were made with a wide slit to accommodate most of the stellar flux ( and for SpeX and Mimir, respectively), although we also obtained a set of narrow slit (), high resolution spectra with SpeX. The SpeX data cover the photometric and bands while the Mimir spectra record the and bands. These spectra were made with multiple short exposures at dithered positions along the slit. Additional details are listed in Table 1. As with the blue and red spectra, we obtained flux calibrator spectra at close to the same time and air mass of the target spectra. The SpeX results were reduced with the Spextool package (Cushing et al., 2004) and the Mimir spectra were extracted using software developed by D. Clemens101010http://people.bu.edu/clemens/mimir/software.html.
All the stars observed are targets of continuing programs of interferometry with the CHARA Array. The targets are listed in Table 2, which gives (1) the Henry Draper catalog number, (2) common name, (3) spectral classification, (4) stellar effective temperature , (5) logarithm of the stellar gravity , (6) interstellar reddening , and (7) the HD number of the flux calibrator star adopted. The classifications for the Be stars are from the compilation of Yudin (2001). In addition to the Be stars, the list includes three Orion supergiants (classifications from Walborn 1976), the luminous blue variable star P Cygni (classification from Lamers et al. 1983), the interacting binary Sgr (classification from Yudin 2001), and the yellow supergiant Cas (classification from Bidelman & McKellar 1957). The stellar parameters and for the Be stars are taken from the apparent values (the average over the visible hemisphere) derived by Frémat et al. (2005), and those for other stars are from the work of Searle et al. (2008) (HD 37128, HD 38771), Bouret et al. (2008) (HD 37742), Dudley & Jeffery (1993) and Leushin (2001) (HD 181615), Najarro et al. (1997) (HD 193237), Neiner et al. (2005) (HD 202904), and Gorlova et al. (2006) (HD 224014). The reddening estimates are from Dougherty et al. (1994) for the Be stars, from Shull & van Steenberg (1985) for the O-type stars, and from Dudley & Jeffery (1993), Najarro et al. (1997), and Zsoldos & Percy (1991) for HD 181615, HD 193237, and HD 224014, respectively.
All the near-IR spectra were transformed to an absolute flux scale (and excised of atmospheric telluric features) using the xtellcor software package described by Vacca et al. (2003). The method uses flux calibrator stars of spectral classification A0 V that are transformed to flux through reference to a model Vega spectrum calculated by R. Kurucz. In brief, the procedure involves convolving the model Vega spectrum with a kernel designed to match the net instrumental and rotational broadening of the calibrator spectrum, shifting the model to match the Doppler shifted calibrator spectrum, scaling and reddening the Vega model to match the calibrator’s observed magnitudes, dividing the observed calibrator by the model spectrum to arrive at a system response spectrum (that includes telluric features), and finally dividing the target spectrum by the response spectrum to obtain a calibrated flux spectrum. The transformation is parameterized in the software by setting the Johnson and magnitudes for the calibrator star (essentially setting the flux zero-point and allowing for a slope adjustment due to interstellar extinction and/or small temperature differences between the calibrator and Vega). These and magnitudes were selected by making a non-linear, least-squares fit of the calibrator magnitudes to a version of the Vega model that was renormalized and reddened for interstellar extinction in the same way as done by the xtellcor software. A small revision of the final and magnitudes was made to bring the results into consistency with the recent absolute calibration of IR fluxes by Rieke et al. (2008).
The blue and red optical spectra were transformed to absolute flux following the same basic approach given by Vacca et al. (2003), but the broadening kernel for the calibrator was calculated rather than fit using the known instrumental broadening and published values of the calibrators’ projected rotational velocities. In addition, we also applied a small flux correction dependent on the difference in air mass between the target and calibrator observations that was calculated based upon the mean atmospheric extinction coefficients in for KPNO derived by Landolt & Uomoto (2007).
3 Optical to Near-IR Spectral Energy Distributions
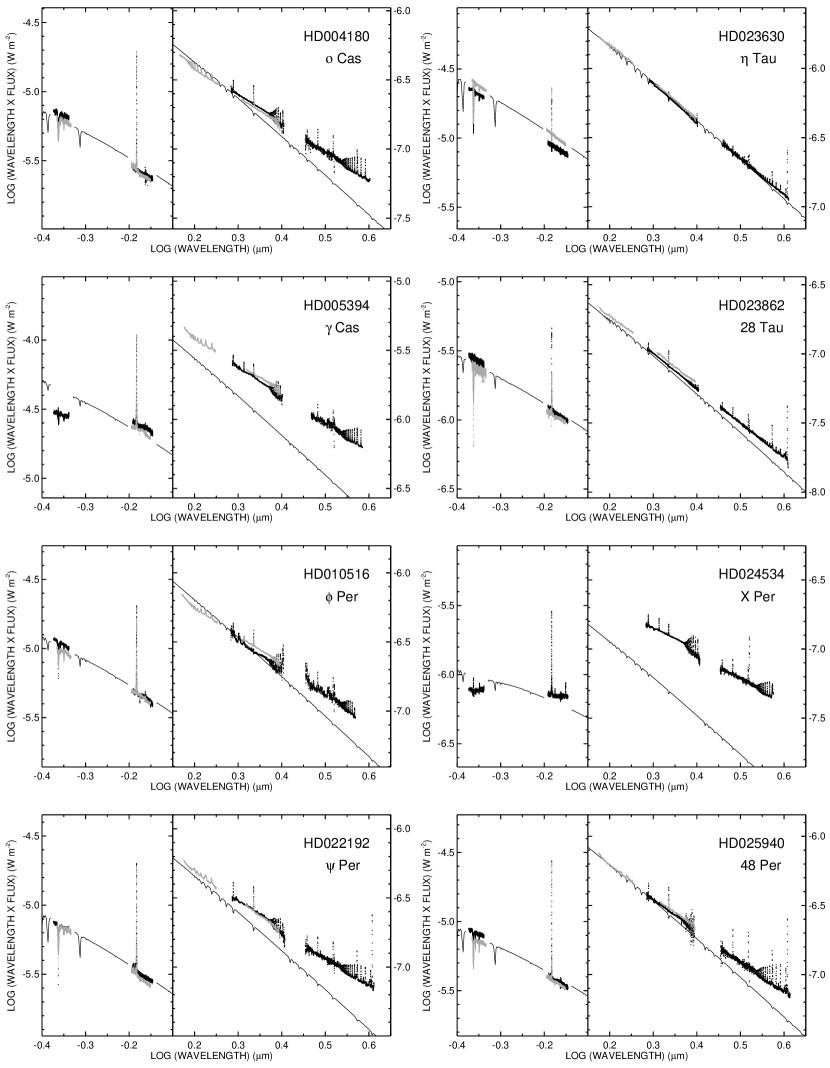
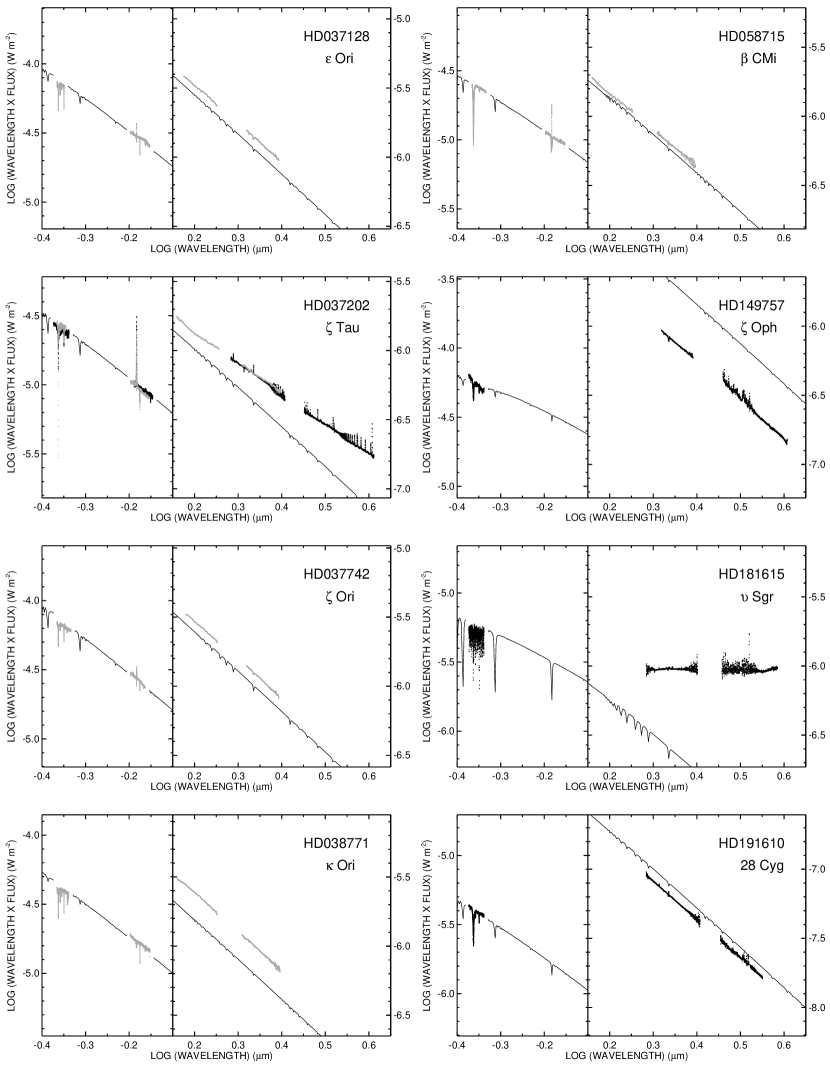
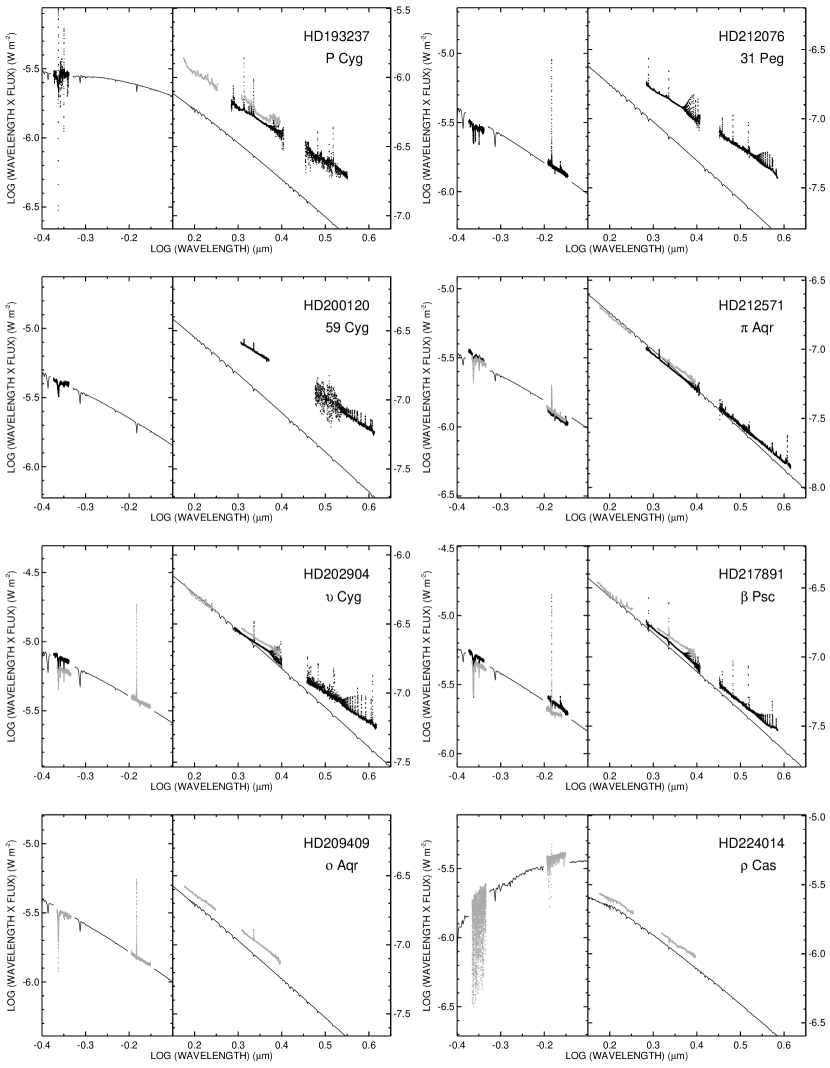
The spectral energy distributions (SEDs) derived for our 24 targets are illustrated in Figures 1 – 3 (in order of increasing HD number). Each panel shows the flux in a format, where is the wavelength (m) and is the physical flux received at Earth (in units of W m-2 m-1 = 0.1 erg cm-2 s-1 Å-1). The first set of measurements from 2006 are depicted as black dotted lines, while those for 2008 are shown over plotted as gray dotted lines. We calculated the average flux over a range of for five wavelengths that correspond to line-free regions near the centers of the Johnson filters, and these mean fluxes appear in Table 3. The errors quoted in Table 3 are the quadratic sum of several components: (1) instrumental error (primarily from Poisson noise detection for these well-exposed spectra), (2) repeatability errors (due to fast atmospheric changes between the target and calibrator exposures), and (3) errors in setting the flux calibration of the calibrator (based upon the scatter in the fit of the calibrator magnitudes). In addition, we included a term for the blue and red spectra equal to the amount of the extinction correction applied to account for air mass mismatch. We had many cases of multiple observations of targets and calibrators that we used to estimate the repeatability error ( for the blue and red spectra; wavelength dependent for the near-IR spectra, but generally just a few percent in wavelength regions with good atmospheric transmission).
We find that there is overall good agreement between the flux levels of the targets between 2006 and 2008, and in most cases there is excellent agreement between the -band fluxes from the SpeX and Mimir instruments. There are a few cases where variability may be present ( Tau, 28 Tau, 48 Per, P Cyg, Cyg, and Psc), and, indeed, the decrease in -band flux in 28 Tau = Pleione between 2006 and 2008 occurred during the development of a new shell phase in that star (Grundstrom, 2007) when additional disk gas projected against the star may have caused its optical flux to decline. We also note that the Be star HD 24534 = X Per, the star with the largest IR flux excess in our sample (see below), was in an historically very bright and strong emission state in 2006 (Grundstrom et al., 2007).
Any estimate of a flux excess in the SED requires some method to determine the stellar contribution across the spectrum. We chose to use model spectra based upon the stellar and reddening parameters in Table 1 that we normalized to the observed fluxes in the blue and red parts of the spectrum. We selected solar abundance models with an adopted microturbulence parameter of 2 km s-1 that are derived from the grid of line-blanketed, local thermodynamical equilibrium (LTE) atmospheres calculated by R. Kurucz111111http://kurucz.harvard.edu/grids.html. These models have limited applicability to our set of targets for a number of reasons. The Be stars, for example, are rapid rotators with non-spherical shape and with polar regions that are hotter than their equatorial zones, and their spectral energy distributions probably resemble that of cooler, less luminous stars (Collins & Sonneborn, 1977). Thus, by selecting a temperature and gravity that represents some average of the visible hemisphere, the resulting model spectral energy distribution should be similar (within a few percent) to the actual flux distribution. Likewise, the use of LTE versus non-LTE models probably introduces a flux error no larger than a few percent for the photospheric SEDs of B stars (Lanz & Hubeny, 2007). The greatest uncertainty for flux fitting of the Be stars results from the normalization of the model spectrum in the visible part where the disk contribution may be significant (see below). The supergiants in the sample are very luminous and low gravity objects with strong stellar winds that create an IR-excess (Bertout et al., 1985), and a non-LTE and extended atmosphere treatment is necessary. Finally, the interacting binary, Sgr has a He-enriched atmosphere (Dudley & Jeffery, 1993). Despite these various limitations, the LTE flux calculations from Kurucz offer an important starting point to search for the deviations in the SED that are related to mass outflows and these other effects.
The flux models were calculated by a bilinear interpolation in the Kurucz grid using and from Table 1. The spectrum was then attenuated for interstellar extinction using the reddening from Table 1, a ratio of total-to-selective extinction of , and the extinction law from Fitzpatrick (1999). The resulting spectrum was normalized by (1) smoothing all the available blue and red spectra to the spectral resolution of the Kurucz flux spectrum, (2) interpolating these to the wavelengths of the model spectrum, (3) forming an average ratio of observed-to-model flux for each spectrum, and (4) determining a global normalization factor from the average of all the available spectra. This process makes the tacit assumptions that the year-to-year flux variations are small (compared to the flux calibration errors) and that the stellar component dominates the optical flux in the blue and red. While these assumptions are reasonable in most cases, we caution that the optical flux of the Be stars may be significantly altered by the presence of a disk. For example, the optical flux may brighten by mag during emission line outbursts when the disk is dense (Hubert & Floquet, 1998; Porter & Rivinius, 2003) or may decrease by a comparable amount in Be-shell stars with dense disks that block stellar flux in the direction of the observer (Doazan, 1982; Hubert & Floquet, 1998). We plan to investigate the extent of the disk contribution to the optical spectrum in a subsequent paper that will use simple disk density models to fit the interferometric and SED observations.
The model stellar flux distributions are indicated by thin solid lines in the SED plots of Figures 1 – 3. These appear as continuous in the near-IR range in the right hand panels, but they appear only in the gaps between the observed spectral regions in the optical region in the left hand panels to avoid confusion with the observations. We find that the expected IR flux excess is observed in the SED of most of the Be stars (from disks), O-supergiants and P Cyg (from winds), and the interacting binary Sgr (from its circumbinary gas). We attach no special significance to the relative IR weakness observed in the SEDs of HD 149757 and HD 191610 that is probably due to somewhat larger errors in their flux calibration. We note that the relatively high, red-to-blue flux ratio observed in the Be star HD 24534 = X Per may indicate that a significant flux excess is present in the red, so our stellar flux normalization made in the optical range may be too high and, consequently, the already large IR excess may be underestimated in this case.
For the Be stars in our sample with good wavelength coverage, we calculated the flux excesses near the centers of the bands by determining the ratio of the observed and model average fluxes. These flux excesses are given in terms of a magnitude difference in Table 4. Since these are determined from a normalization of the spectrum in the visible region, we symbolically write these as , , and , where the asterisk is used to differentiate the reddening due to disk emission from interstellar reddening (which is accounted for in calculating the model photospheric spectra).
4 Emission Line Equivalent-Widths
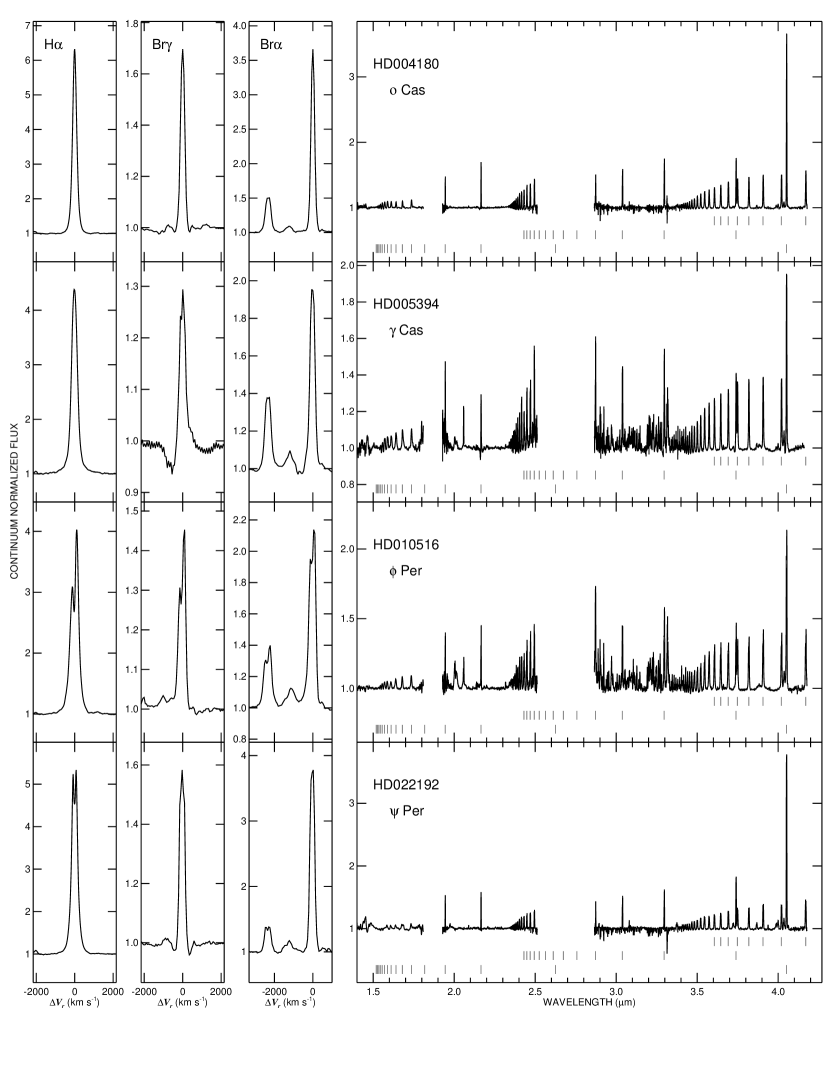
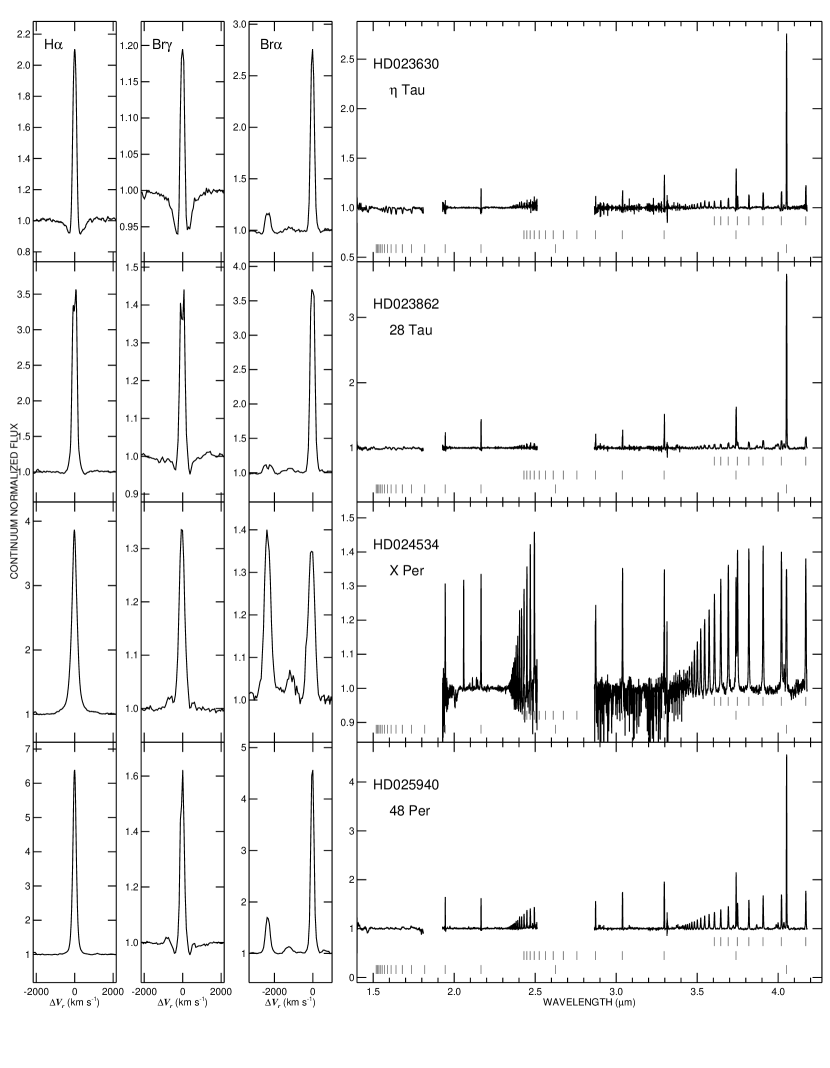
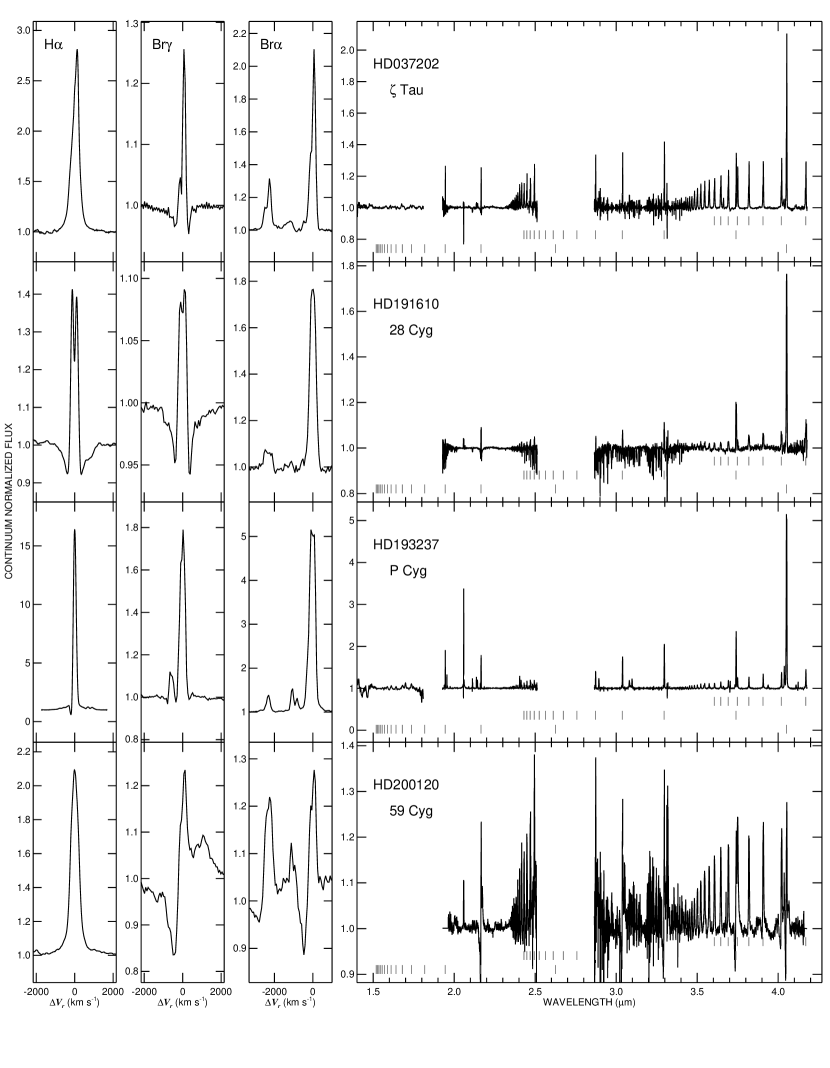
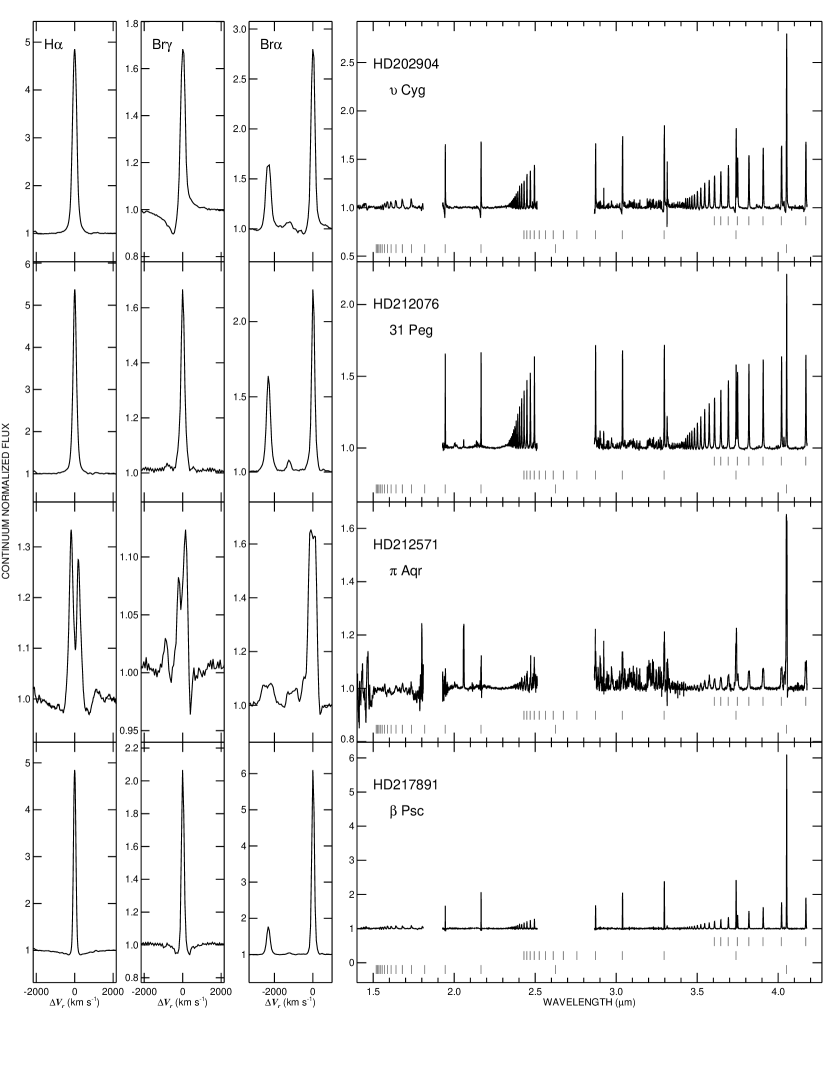
The near-IR spectra of the Be stars contain many emission lines formed in the disk, and our data set offers a good opportunity to compare the well studied, optical H emission with these near-IR lines in data obtained contemporaneously. Figures 4 – 7 show a montage of (from left to right) the H, Br, and Br Hu14 emission lines plus the entire near-IR range, all normalized to the local continuum flux (the combined stellar and disk flux). The -band portions are from Mimir data in 2008 and the -band sections are from the 2006 SpeX data (high resolution versions). Tick marks under each spectrum show the locations of the H Brackett, Pfund, and Humphreys series of lines. The H profiles are smoothed to the resolution of SpeX (). The H profiles are from 2006 (2008 for Cyg), and these include profiles of 28 Cyg and 59 Cyg from Grundstrom (2007) and of P Cyg from the University of Toledo Ritter Observatory (N. Richardson et al., in preparation). P Cygni (HD 193237) is not a Be star, but we include it here as an example of emission formed in a wind where the gas density is lower than typical for Be disks (Hony et al., 2000). Our results can be compared directly (in the 2.4 – 4.1 m range) to spectra from the Infrared Space Observatory presented by Lenorzer et al. (2002a) for HD 5394, 191610, 193237, and 212571.
We measured the equivalent-width (relative to the local continuum) by direct integration for the most prominent H emission lines of H, Br, Br, Pf, Pf, and Hu14 m, and these are listed in columns 2 – 7 of Table 5. We use the standard notation of expressing net emission as a negative equivalent-width. The profiles of Pf m are partially blended with those of Hu17 m in most of the spectra, and we set the upper boundary for the integration of Pf at the minimum position between the two features. The formal measurement errors are approximately ( for Pf), but these do not include any errors introduced in the telluric removal and flux calibration process (where uncertainties in the H line strengths of the calibrator spectrum may introduce errors in the final spectrum of the target). Furthermore, there were a number of cases where the measurement included both emission and absorption components. For example, the Br profile displayed broad photospheric absorption plus narrower disk emission for several of the Be stars, and it appeared like a wind feature with blue absorption plus red emission for P Cyg, 59 Cyg, and Cyg. In all these cases, the equivalent-width reported in Table 5 is the net integration of the absorption and emission components.
5 Discussion
Since both the H emission lines and IR-excess originate in the circumstellar disks of Be stars, we might expect that the two observables are correlated. Past work indicates that the H emission strength is related to the IR excess. Kastner & Mazzali (1989) used published data to show that the H luminosity is correlated with the IR excess luminosity and the spectral type of the underlying star. van Kerkwijk et al. (1995) obtained near simultaneous H spectroscopy and near-IR photometry (to avoid ambiguities introduced by time variability of the sources), and they found that the equivalent-width of H was loosely correlated with a disk color excess , but there was an intrinsic scatter in the relationship. These results were confirmed (although with somewhat less scatter) in a study of the relationship of the H equivalent-width and the disk color excess by Howells et al. (2001). Given the new spectra available from our study, we have also explored the relationship between the line and continuum emission.
We need to refer the line emission to the photospheric continuum (rather than the observed sum of the photospheric and disk flux), so we used the flux excess data from Table 4 to derive a line equivalent-width relative to the stellar continuum,
| (1) |
where is the observed equivalent-width (Table 5) and is the wavelength-interpolated, flux excess from the disk (Table 4). We show the derived relationship between (H) and in Figure 8. In this case since the photospheric flux was normalized in the optical, there is no net continuum excess near H by definition, and hence . We see that there is a correlation, but the scatter from a one-to-one relationship is significant (the Spearman’s rank correlation coefficient is ). We found a similar degree of scatter in plots of and for Br, Br, Pf, and Pf, and the least scatter is seen in the diagram for Hu14 m (Fig. 9) where the Spearman’s rank correlation is . The two most discrepant points in Figure 9 (found below the trend, near ) correspond to the stars Tau (HD 37202) and 59 Cyg (HD 200120). The spectra of both stars show interesting structure in the higher resolution SpeX spectra (asymmetric double peaks for Tau and blue absorption for 59 Cyg), which suggests that a simple equivalent-width measurement may be insufficient to explore the relationship between the line and continuum emission strengths for these two stars.
Note that the placement in Figures 8 and 9 may be need to be altered if the disk is in fact a significant contributor to the flux in the visible part of the spectrum (which we assumed to be negligible). Suppose that is the ratio of disk continuum flux to stellar flux in the visible region. By assuming , we will underestimate the flux excess in the IR by an amount that could be as large as 0.4 mag in cases with large disk visible flux contributions. Furthermore, the H strength in Figure 8 would also need to adjusted upwards by a factor of for a measure relative to the stellar continuum. These factors may partially explain why the large IR-excess cases shown in Figure 8 fall below the expected trend.
We expect that features of high optical depth will be formed over a large range of disk radii (appearing uniformly bright over the optically thick regions for an isothermal disk) while low optical depth features will only appear bright in the denser regions of the inner disk. For example, Gies et al. (2007) found that the angularly resolved disks appear smaller in the lower opacity -band continuum compared to that seen in the high opacity H line, which is consistent with the idea that the -band excess forms mainly in the inner, denser part of the disk. Similarly, the emission lines of the upper Humphreys series (like Hu14) are particularly interesting since they probably form mainly in the densest region of the disk near the star (Hony et al., 2000; Jones et al., 2009). Since Be disks are time variable and outflowing, we might expect that diagnostics that probe like parts of the disk will be better correlated than those that form over different ranges of radii. This expectation agrees with our result that the excess is better correlated with (Hu14) (both forming in the inner disk) than with (H) (which forms out to larger disk radii).
In fact, there is a hint of a better defined relation between (H) and in Figure 8 for mag, and the scatter in the relation occurs only for stars with the largest IR excesses (densest, largest disks). Stars with relatively low density and small disks may have similar radial density functions, so that the ratio of flux from H to that in the near-IR continuum is approximately constant. However, the radial density law for Be stars with large, extensive disks may be much more complex, reflecting past episodes of differing mass loss rates and possibly developing non-axisymmetric structure. In such a situation, the conditions probed by H in the outer regions may be very different from those in the inner disk where the near-IR excess forms. It is interesting to note that all the strong excess stars in Figure 8 (with the exception of 31 Peg = HD 212076) are known binaries with periods of order d. The outer boundaries of the disks in these systems are truncated by tidal forces (Okazaki & Negueruela, 2001), which may explain the relative weakness of the H feature compared to the near-IR excess.
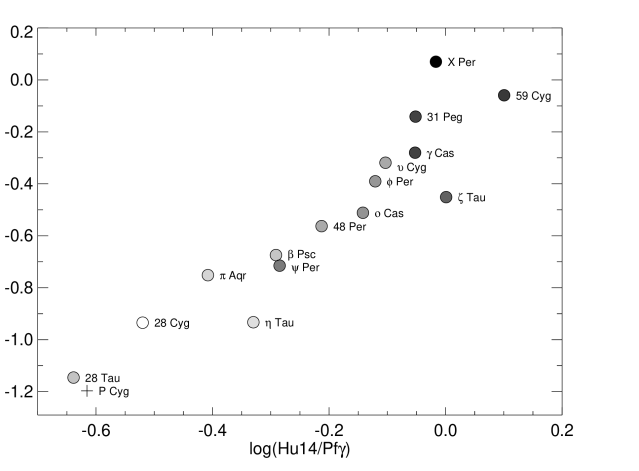
Lenorzer et al. (2002b) suggest that a diagram of the line flux ratios of (log(Hu14/Pf), log(Hu14/Br)) is a useful diagnostic tool to estimate the gas density in disks of Be stars (Jones et al., 2009; Mennickent et al., 2009). We measured these line fluxes by first transforming the continuum of the higher resolution SpeX spectra to that of the better flux calibrated lower resolution spectra and then subtracting a fit of local continuum. We measured the line fluxes by direct integration and then calculated these two line ratios (given in columns 8 and 9 of Table 5). The results are plotted in Figure 10, where each symbol is assigned a gray intensity proportional to the infrared excess (darkest at large ). We see a general trend that the Be stars in the upper right part of the diagram are those with the largest IR excess. As Lenorzer et al. (2002b) point out, in optically thick disks, the line flux ratio will be given by the product of the line source function ratio and the ratio of projected radiating surfaces. We expect that in very dense environments both these ratios will approach unity, so that the ratios for Be stars with dense disks will appear in the upper right part of the diagram near (log(Hu14/Pf), log(Hu14/Br)) = (0,0), the same region where stars with large IR excesses are plotted. On the other hand, stars with low density, circumstellar environments (like the extended wind of the star P Cygni, indicated by a plus sign in Fig. 10) will have line ratios that tend to populate the lower, left part of the diagram (Jones et al., 2009). However, we suspect that the position in the diagram also is modified by the gas temperature in the disk (Jones et al., 2009), since the lowest point in the diagram corresponds to the coolest Be star in our sample, 28 Tau (HD 23862; observed during a shell phase).
Curiously, we might expect that in the densest disk regions near the star that both the continuum and the Hu14 source functions would be similar because they form in regions of similar temperature. If so, then in the optically thick parts, the lines would disappear since both lines and continuum would radiate with the same source function. Consequently, unless the optically thick region of line emission is significantly larger than the continuum emitting region, we would expect high excitation transition lines to vanish in the observed spectrum. The fact that the Hu lines remain as emission features in Be stars with dense disks led Hony et al. (2000) to argue that the lines must form in a region of elevated temperature compared to the site of continuum formation, perhaps in locations above the disk plane. Their suggestion appears to be verified in recent models of Be disks that show that the mid-plane region is cooler than off-plane regions in the inner part of the disk (Sigut & Jones, 2007; Carciofi & Bjorkman, 2008).
6 Conclusions
Our spectrophotometric observations of nearby Be stars show that all the stars with strong H emission also display an IR excess relative to the expected photospheric flux distribution. The size of the IR excess is correlated with the H equivalent-width but the relation shows the largest scatter among those stars with the densest and largest circumstellar disks. On the other hand, the IR excess shows a better correlation with the equivalent-widths (corrected for disk continuum emission) of high excitation transitions like Hu14. Since only a trace number of H atoms populate these excited states, transitions like Hu14 have a low opacity except in the densest parts of the disk. We argue that these results can be understood in terms of the spatial range in radius over which any emission mechanism is optically thick. The good correlation between the IR continuum emission and the high excitation line emission suggests that both form in the inner, dense part of the disk, while the less marked correlation between the IR continuum and H emission results from changes in the density distribution in the outer part of the disk (perhaps due to the temporal evolution of the disk and/or the tidal influence of a binary companion).
We are currently making near-IR interferometric observations of some 20 northern Be stars with the CHARA Array. We will combine the SED data presented here with the interferometric visibility data to develop consistent models of the disk density structure and orientation in the sky (see our first examples in Gies et al. 2007).
References
- Bertout et al. (1985) Bertout, C., Leitherer, C., Stahl, O., & Wolf, B. 1985, A&A, 144, 87
- Bidelman & McKellar (1957) Bidelman, W. P., & McKellar, A. 1957, PASP, 69, 31
- Bouret et al. (2008) Bouret, J.-C., Donati, J.-F., Martins, F., Escolano, C., Marcolino, W., Lanz, T., & Howarth, I. D. 2008, MNRAS, 389, 75
- Carciofi & Bjorkman (2008) Carciofi, A. C., & Bjorkman, J. E. 2008, ApJ, 684, 1374
- Carciofi et al. (2009) Carciofi, A. C., Okazaki, A. T., le Bouquin, J.-B., Štefl, S., Rivinius, T., Baade, D., Bjorkman, J. E., & Hummel, C. A. 2009, A&A, in press (arXiv:0901.1098)
- Clark & Steele (2000) Clark, J. S., & Steele, I. A. 2000, A&AS, 141, 65
- Clemens et al. (2007) Clemens, D. P., Sarcia, D., Grabau, A., Tollestrup, E. V., Buie, M. W., Dunham, E., & Taylor, B. 2007, PASP, 119, 1385
- Collins & Sonneborn (1977) Collins, G. W., II, & Sonneborn, G. H. 1977, ApJS, 34, 41
- Cushing et al. (2004) Cushing, M. C., Vacca, W. D., & Rayner, J. T. 2004, PASP, 116, 362
- Doazan (1982) Doazan, V. 1982, in B Stars with and without Emission Lines, ed. A. Underhill & V. Doazan (Washington, DC: NASA SP-456), 279
- Dougherty et al. (1994) Dougherty, S. M., Waters, L. B. F. M., Burki, G., Coté, J., Cramer, N., van Kerkwijk, M. H., & Taylor, A. R. 1994, A&A, 290, 609
- Dudley & Jeffery (1993) Dudley, R. E., & Jeffery, C. S. 1993, MNRAS, 262, 945
- Fitzpatrick (1999) Fitzpatrick, E. L. 1999, PASP, 111, 63
- Frémat et al. (2005) Frémat Y., Zorec J., Hubert A.-M., & Floquet M. 2005, A&A, 440, 305
- Gies et al. (2007) Gies, D. R., et al. 2007, ApJ, 654, 527
- Gorlova et al. (2006) Gorlova, N., Lobel, A., Burgasser, A. J., Rieke, G. H., Ilyin, I., & Stauffer, J. R. 2006, ApJ, 651, 1130
- Grundstrom (2007) Grundstrom, E. D. 2007, Ph.D. dissertation (Georgia State Univ.)
- Grundstrom et al. (2007) Grundstrom, E. D., et al. 2007, ApJ, 660, 1398
- Hony et al. (2000) Hony, S., et al. 2000, A&A, 355, 187
- Howells et al. (2001) Howells, L., Steele, I. A., Porter, J. M., & Etherton, J. 2001, A&A, 369, 99
- Hubert & Floquet (1998) Hubert, A. M., & Floquet, M. 1998, A&A, 335, 565
- Jones et al. (2009) Jones, C. E., Molak, A., Sigut, T. A. A., de Koter, A., Lenorzer, A., & Popa, S. C. 2009, MNRAS, 392, 383
- Kastner & Mazzali (1989) Kastner, J. H., & Mazzali, P. A. 1989, A&A, 210, 295
- Lamers et al. (1983) Lamers, H. J. G. L. M., de Groot, M., & Cassatella, A. 1983, A&A, 128, 299
- Landolt & Uomoto (2007) Landolt, A. U., & Uomoto, A. K. 2007, AJ, 133, 768
- Lanz & Hubeny (2007) Lanz, T., & Hubeny, I. 2007, ApJS, 169, 83
- Lenorzer et al. (2002b) Lenorzer, A., de Koter, A., & Waters, L. B. F. M. 2002b, A&A, 386, L5
- Lenorzer et al. (2002a) Lenorzer, A., Vandenbussche, B., Morris, P., de Koter, A., Geballe, T. R., Waters, L. B. F. M., Hony, S., & Kaper, L. 2002a, A&A, 384, 473
- Leushin (2001) Leushin, V. V. 2001, Astron. Lett., 27, 634
- McSwain et al. (2008) McSwain, M. V., Huang, W., Gies, D. R., Grundstrom, E. D., & Townsend, R. H. D. 2008, ApJ, 672, 590
- Meilland et al. (2007) Meilland, A., et al. 2007, A&A, 464, 59
- Mennickent et al. (2009) Mennickent, R. E., Sabogal, B., Granada, A., & Cidale, L. 2009, PASP, 121, 125
- Najarro et al. (1997) Najarro, F., Hillier, D. J., & Stahl, O. 1997, A&A, 326, 1117
- Neiner et al. (2005) Neiner, C., et al. 2005, A&A, 437, 257
- Okazaki & Negueruela (2001) Okazaki, A. T., & Negueruela, I. 2001, A&A, 377, 161
- Porter (1999) Porter, J. M. 1999, A&A, 348, 512
- Porter & Rivinius (2003) Porter, J. M., & Rivinius, Th. 2003, PASP, 115, 1153
- Rayner et al. (2003) Rayner, J. T., Toomey, D. W., Onaka, P. M., Denault, A. J., Stahlberger, W. E., Vacca, W. D., Cushing, M. C., & Wang, S. 2003, PASP, 115, 362
- Rieke et al. (2008) Rieke, G. H., et al. 2008, AJ, 135, 2245
- Searle et al. (2008) Searle, S. C., Prinja, R. K., Massa, D., & Ryans, R. 2008, A&A, 481, 777
- Shull & van Steenberg (1985) Shull, J. M., & van Steenberg, M. E. 1985, ApJ, 294, 599
- Sigut & Jones (2007) Sigut, T. A. A., & Jones, C. E. 2007, ApJ, 668, 481
- Stee & Bittar (2001) Stee, P., & Bittar, J. 2001, A&A, 367, 532
- Steele & Clark (2001) Steele, I. A., & Clark, J. S. 2001, A&A, 371, 643
- ten Brummelaar et al. (2005) ten Brummelaar, T. A., et al. 2005, ApJ, 628, 453
- Vacca et al. (2003) Vacca, W. D., Cushing, M. C., & Rayner, J. T. 2003, PASP, 115, 389
- van Kerkwijk et al. (1995) van Kerkwijk, M. H., Waters, L. B. F. M., & Marlborough, J. M. 1995, A&A, 300, 259
- Walborn (1976) Walborn, N. R. 1976, ApJ, 205, 419
- Waters (1986) Waters, L. B. F. M. 1986, A&A, 162, 121
- Yudin (2001) Yudin, R. V. 2001, A&A, 368, 912
- Zsoldos & Percy (1991) Zsoldos, E., & Percy, J. R. 1991, A&A, 246, 441
| UT | Julian Date | Wavelength Range | Resolving Power | Number of | Observatory/Telescope/ |
|---|---|---|---|---|---|
| Date | (HJD-2,450,000) | (m) | () | Spectra | Spec., Grating/Detector |
| (1) | (2) | (3) | (4) | (5) | (6) |
| 2006 Sep 15 – 16 | 3993.8 – 3995.1 | 1.92 – 4.21 | 1700 | 22 | IRTF/3.0m/SpeX, Long XD1.9/Aladdin 3 InSb |
| 2006 Oct 12 | 4020.8 – 4020.9 | 0.64 – 0.71 | 6500 | 12 | KPNO/0.9m/Coudé, B (order 2)/T2KB |
| 2006 Oct 20 – 21 | 4028.6 – 4029.8 | 0.42 – 0.46 | 8500 | 18 | KPNO/0.9m/Coudé, A (order 2)/T2KB |
| 2008 Oct 18 – 20 | 4757.6 – 4760.0 | 1.40 – 2.50 | 930 | 18 | Lowell/1.8m/Mimir, grism/Aladdin 3 InSb |
| 2008 Oct 27 – 29 | 4766.6 – 4769.0 | 0.64 – 0.71 | 10300 | 17 | KPNO/0.9m/Coudé, B (order 2)/F3KB |
| 2008 Nov 30 | 4800.6 – 4801.0 | 0.43 – 0.46 | 13900 | 16 | KPNO/0.9m/Coudé, A (order 2)/F3KB |
| Target | Spectral | Calibrator | ||||
|---|---|---|---|---|---|---|
| HD No. | Name | Classification | (kK) | (cm s-2) | (mag) | HD No. |
| (1) | (2) | (3) | (4) | (5) | (6) | (7) |
| HD 004180 | Cas | B2 Ve | 14.4 | 3.3 | 0.11 | HD 001561 |
| HD 005394 | Cas | B0 IVe + sh | 26.4 | 3.8 | 0.22 | HD 011946 |
| HD 010516 | Per | B0.5 IVe + sh | 25.6 | 3.9 | 0.21 | HD 011946 |
| HD 022192 | Per | B4.5 Ve + sh | 15.8 | 3.5 | 0.11 | HD 025152 |
| HD 023630 | Tau | B7 IIIe | 12.3 | 3.0 | 0.06 | HD 023258 |
| HD 023862 | 28 Tau | B8 Vpe + sh | 12.1 | 3.9 | 0.09 | HD 023258 |
| HD 024534 | X Per | O9.5 Vep | 25.2 | 3.6 | 0.40 | HD 019600 |
| HD 025940 | 48 Per | B4 Ve | 16.2 | 3.6 | 0.19 | HD 029526 |
| HD 037128 | Ori | B0 Ia | 27.5 | 3.1 | 0.05 | HD 034203 |
| HD 037202 | Tau | B1 IVe + sh | 19.3 | 3.7 | 0.00 | HD 034203 |
| HD 037742 | Ori | O9.7 Ib | 29.5 | 3.3 | 0.04 | HD 034203 |
| HD 038771 | Ori | B0.5 Ia | 26.0 | 3.0 | 0.04 | HD 045380 |
| HD 058715 | CMi | B8 Ve | 11.8 | 3.8 | 0.01 | HD 060357 |
| HD 149757 | Oph | O9 Ve | 26.4 | 3.8 | 0.33 | HD 143459 |
| HD 181615 | Sgr | B2 Vpe | 11.8 | 2.0 | 0.20 | HD 182678 |
| HD 191610 | 28 Cyg | B3 IVe | 18.4 | 3.7 | 0.06 | HD 192538 |
| HD 193237 | P Cyg | B1 Ia+ | 18.2 | 1.2 | 0.51 | HD 192538 |
| HD 200120 | 59 Cyg | B1.5 Ve + sh | 21.8 | 3.8 | 0.21 | HD 205314 |
| HD 202904 | Cyg | B2.5 Vne | 19.1 | 3.9 | 0.19 | HD 206774 |
| HD 209409 | Aqr | B7 IVe + sh | 12.9 | 3.7 | 0.05 | HD 212061 |
| HD 212076 | 31 Peg | B1.5 Vne | 19.3 | 3.7 | 0.10 | HD 212061 |
| HD 212571 | Aqr | B1 Ve + sh | 26.1 | 3.9 | 0.22 | HD 212061 |
| HD 217891 | Psc | B5 Ve | 14.4 | 3.7 | 0.05 | HD 212061 |
| HD 224014 | Cas | F8 Ia var | 6.0 | 0.7 | 0.42 | HD 223386 |
| Star | Year | |||||
|---|---|---|---|---|---|---|
| (1) | (2) | (3) | (4) | (5) | (6) | (7) |
| HD004180 | 2006 | 8.808 (26) | 9.435 (25) | 11.019 (11) | 11.611 (12) | |
| HD004180 | 2008 | 8.843 (27) | 9.445 (24) | 10.681 (13) | 11.039 (13) | |
| HD005394 | 2006 | 8.168 (26) | 8.460 (25) | 10.036 (11) | 10.616 (12) | |
| HD005394 | 2008 | 8.490 (24) | 9.681 (13) | 10.015 (13) | ||
| HD010516 | 2006 | 8.595 (29) | 9.179 (25) | 10.917 (11) | 11.468 (12) | |
| HD010516 | 2008 | 8.646 (28) | 9.187 (24) | 10.512 (13) | 10.870 (13) | |
| HD022192 | 2006 | 8.794 (25) | 9.345 (23) | 10.935 (9) | 11.524 (11) | |
| HD022192 | 2008 | 8.799 (25) | 9.380 (23) | 10.569 (12) | 10.942 (12) | |
| HD023630 | 2006 | 8.313 (24) | 8.913 (23) | 10.553 (9) | 11.271 (10) | |
| HD023630 | 2008 | 8.249 (25) | 8.841 (22) | 10.089 (11) | 10.530 (11) | |
| HD023862 | 2006 | 9.207 (24) | 9.794 (23) | 11.434 (9) | 12.113 (10) | |
| HD023862 | 2008 | 9.261 (24) | 9.819 (22) | 10.986 (11) | 11.405 (12) | |
| HD024534 | 2006 | 9.756 (22) | 9.992 (21) | 11.246 (7) | 11.803 (9) | |
| HD025940 | 2006 | 8.720 (19) | 9.267 (21) | 10.884 (5) | 11.501 (7) | |
| HD025940 | 2008 | 8.778 (19) | 9.281 (19) | 10.474 (8) | 10.865 (8) | |
| HD037128 | 2008 | 7.788 (27) | 8.379 (22) | 9.742 (11) | 10.197 (11) | |
| HD037202 | 2006 | 8.235 (23) | 8.877 (23) | 10.513 (9) | 11.133 (10) | |
| HD037202 | 2008 | 8.202 (24) | 8.896 (22) | 10.135 (11) | 10.510 (11) | |
| HD037742 | 2008 | 7.813 (25) | 8.447 (22) | 9.796 (11) | 10.247 (11) | |
| HD038771 | 2008 | 8.032 (30) | 8.631 (19) | 9.882 (8) | 10.340 (8) | |
| HD058715 | 2008 | 8.251 (24) | 8.840 (22) | 10.096 (11) | 10.536 (11) | |
| HD149757 | 2006 | 7.893 (99) | 10.424 (7) | 11.150 (9) | ||
| HD181615 | 2006 | 8.920 (20) | 10.355 (5) | 10.568 (8) | ||
| HD191610 | 2006 | 9.046 (26) | 11.531 (11) | 12.264 (13) | ||
| HD193237 | 2006 | 9.184 (26) | 10.624 (11) | 11.204 (12) | ||
| HD193237 | 2008 | 10.220 (13) | 10.567 (13) | |||
| HD200120 | 2006 | 9.034 (26) | 10.990 (10) | 11.566 (12) | ||
| HD202904 | 2006 | 8.758 (21) | 10.974 (6) | 11.582 (9) | ||
| HD202904 | 2008 | 8.838 (23) | 9.280 (21) | 10.562 (9) | 10.936 (9) | |
| HD209409 | 2008 | 9.135 (24) | 9.680 (23) | 10.895 (12) | 11.307 (12) | |
| HD212076 | 2006 | 9.172 (33) | 9.676 (35) | 11.201 (9) | 11.805 (10) | |
| HD212571 | 2006 | 9.127 (25) | 9.765 (26) | 11.473 (9) | 12.169 (10) | |
| HD212571 | 2008 | 9.145 (24) | 9.751 (22) | 11.026 (12) | 11.437 (12) | |
| HD217891 | 2006 | 8.935 (31) | 9.486 (41) | 11.230 (9) | 11.941 (10) | |
| HD217891 | 2008 | 8.991 (27) | 9.548 (22) | 10.819 (12) | 11.193 (12) | |
| HD224014 | 2008 | 9.559 (19) | 9.242 (20) | 9.843 (8) | 10.233 (8) |
| Star | Year | (mag) | (mag) | (mag) |
|---|---|---|---|---|
| (1) | (2) | (3) | (4) | (5) |
| HD004180 | 2006 | 0.15 (9) | 0.51 (9) | |
| HD004180 | 2008 | 0.12 (9) | 0.10 (9) | |
| HD005394 | 2006 | 0.61 (31) | 1.04 (31) | |
| HD005394 | 2008 | 0.36 (31) | 0.66 (31) | |
| HD010516 | 2006 | 0.01 (6) | 0.49 (6) | |
| HD010516 | 2008 | 0.13 (6) | 0.11 (6) | |
| HD022192 | 2006 | 0.30 (4) | 0.67 (5) | |
| HD022192 | 2008 | 0.09 (5) | 0.28 (5) | |
| HD023630 | 2006 | 0.00 (12) | 0.03 (12) | |
| HD023630 | 2008 | 0.03 (12) | 0.05 (12) | |
| HD023862 | 2006 | 0.07 (9) | 0.21 (9) | |
| HD023862 | 2008 | 0.07 (9) | 0.14 (9) | |
| HD024534 | 2006 | 1.01 (29) | 1.46 (29) | |
| HD025940 | 2006 | 0.07 (7) | 0.36 (7) | |
| HD025940 | 2008 | 0.01 (7) | 0.12 (7) | |
| HD037202 | 2006 | 0.51 (4) | 0.84 (4) | |
| HD037202 | 2008 | 0.30 (4) | 0.52 (4) | |
| HD058715 | 2008 | 0.08 (4) | 0.10 (4) | |
| HD191610 | 2006 | 0.21 (11) | 0.18 (11) | |
| HD200120 | 2006 | 0.68 (11) | 1.09 (11) | |
| HD202904 | 2006 | 0.05 (12) | 0.37 (12) | |
| HD202904 | 2008 | 0.04 (12) | 0.14 (12) | |
| HD209409 | 2008 | 0.18 (7) | 0.27 (7) | |
| HD212076 | 2006 | 0.68 (16) | 1.03 (16) | |
| HD212571 | 2006 | 0.05 (13) | 0.09 (13) | |
| HD212571 | 2008 | 0.06 (13) | 0.04 (13) | |
| HD217891 | 2006 | 0.11 (10) | 0.18 (10) | |
| HD217891 | 2008 | 0.01 (10) | 0.20 (11) |
| (H) | (Br) | (Br) | (Pf) | (Pf) | (Hu14) | |||
|---|---|---|---|---|---|---|---|---|
| Star | ( m) | ( m) | ( m) | ( m) | ( m) | ( m) | (Hu14/Pf) | (Hu14/Br) |
| (1) | (2) | (3) | (4) | (5) | (6) | (7) | (8) | (9) |
| HD004180 | 3.35 | 8.77 | 1.33 | 2.96 | 2.27 | 2.58 | 0.14 | 0.51 |
| HD005394 | 3.12 | 4.35 | 0.55 | 1.94 | 2.15 | 2.10 | 0.05 | 0.28 |
| HD010516 | 3.01 | 6.35 | 1.18 | 2.43 | 2.75 | 2.44 | 0.12 | 0.39 |
| HD022192 | 3.77 | 11.34 | 1.23 | 3.45 | 1.80 | 2.05 | 0.28 | 0.71 |
| HD023630 | 0.42 | 5.70 | 0.02 | 1.20 | 0.76 | 0.49 | 0.33 | 0.93 |
| HD023862 | 1.71 | 11.21 | 0.76 | 2.68 | 1.31 | 0.65 | 0.64 | 1.15 |
| HD024534 | 2.41 | 2.05 | 0.95 | 1.87 | 1.20 | 2.35 | 0.02 | 0.07 |
| HD025940 | 2.81 | 10.83 | 0.98 | 3.73 | 3.04 | 2.89 | 0.21 | 0.56 |
| HD037202 | 1.81 | 4.00 | 0.20 | 1.08 | 0.89 | 1.34 | 0.00 | 0.45 |
| HD191610 | 0.18 | 4.17 | 0.03 | 1.09 | 0.36 | 0.39 | 0.52 | 0.93 |
| HD193237aaP Cygni is a Luminous Blue Variable and not a Be star, but it is included here for comparison. | 6.66 | 22.85 | 1.89 | 5.05 | 3.47 | 1.36 | 0.62 | 1.20 |
| HD200120 | 1.35 | 1.15 | 0.08 | 0.66 | 0.75 | 1.05 | 0.10 | 0.06 |
| HD202904 | 2.58 | 6.48 | 1.06 | 2.94 | 2.73 | 3.10 | 0.10 | 0.32 |
| HD212076 | 2.43 | 3.72 | 1.35 | 2.28 | 2.56 | 2.60 | 0.05 | 0.14 |
| HD212571 | 0.30 | 4.75 | 0.41 | 1.51 | 1.13 | 0.78 | 0.41 | 0.75 |
| HD217891 | 1.11 | 12.12 | 1.07 | 3.84 | 3.57 | 2.46 | 0.29 | 0.67 |