Chemistry in Disks.
III. – Photochemistry and X-ray driven chemistry probed by the ethynyl radical
(CCH) in DM Tau, LkCa 15,
and
MWC 480.
Abstract
We studied several representative circumstellar disks surrounding the Herbig Ae star MWC 480 and the T Tauri stars LkCa 15 and DM Tau at (sub-)millimeter wavelengths in lines of CCH111Based on observations carried out with the IRAM Plateau de Bure Interferometer. IRAM is supported by INSU/CNRS (France), MPG (Germany) and IGN (Spain).. Our aim is to characterize photochemistry in the heavily UV-irradiated MWC 480 disk and compare the results to the disks around cooler T Tauri stars. We detected and mapped CCH in these disks with the IRAM Plateau de Bure Interferometer in the C- and D-configurations in the (1-0) and (2-1) transitions. Using an iterative minimization technique, the CCH column densities and excitation conditions are constrained. Very low excitation temperatures are derived for the T Tauri stars. These values are compared with the results of advanced chemical modeling, which is based on a steady-state flared disk structure with a vertical temperature gradient, and a gas-grain chemical network with surface reactions. Both model and observations suggest that CCH is a sensitive tracer of the X-ray and UV irradiation. The predicted radial dependency and source to source variations of CCH column densities qualitatively agree with the observed values, but the predicted column densities are too low by a factor of several. The chemical model fails to reproduce high concentrations of CCH in very cold disk midplane as derived from the observed low excitation condition for both the (1-0) and (2-1) transitions.
1 Introduction
Our present understanding of the chemical composition and evolution of protoplanetary disks is far from being complete. Recent years have revealed increased interest in such studies as a necessary prerequisite to characterize the physical and chemical conditions for planet formation. Apart from CO and its isotopologues, and occasionally HCO+, CN, HCN, and CS, the molecular content of protoplanetary disks characterized by millimeter line observations remains poorly known (see reviews by Dutrey et al., 2007a; Bergin et al., 2007). Recently, infrared spectroscopy provided evidence for the presence of C2H2, HCN, H2O, OH, and CO2 in the inner regions of protoplanetary disks and indicated the importance of photochemistry (e.g., Lahuis et al., 2006; Carr & Najita, 2008; Salyk et al., 2008; Pascucci et al., 2009). Molecular line data are limited in their sensitivity and spatial resolution, which implies that the spatial distribution of molecular abundances in disks remains poorly determined (e.g., Piétu et al., 2005; Semenov et al., 2005; Qi et al., 2006, 2008; Panić et al., 2009). Thus a detailed comparison with existing chemical models is difficult and often based on global data (e.g. integrated line profiles), while for testing the validity of sophisticated models one has to include the thermal disk structure and the time-dependent chemical evolution together with line data and channel maps.
As part of the Heidelberg-Bordeaux “Chemistry In Disks” (CID) project we are investigating the molecular content and physical properties of a sample of well-studied T Tauri and Herbig Ae disks of various age, followed by comprehensive physico-chemical modeling. In the first CID paper, we have presented the results of a deep search for N2H+ and HCO+ toward two T Tauri stars (DM Tau, LkCa 15) and one Herbig Ae star (MWC 480), see Dutrey et al. (2007b, CID1 paper hereafter). The N2H+ emission has been detected in LkCa 15 and DM Tau, with the N2H+ to HCO+ ratio of a few percent, similar to that of cold dense cores, and the disk ionization degree of , as predicted by chemical models.
In the second CID paper by Schreyer et al. (2008), we have found that the modeled and observed column densities of several key species relative to 13CO are lower for the Herbig AB Aur disk than the values measured in DM Tau, while the absolute amount of CO gas is similar in both disks. This has been interpreted as an indication of a poor molecular content of the Herbig A0e system compared to the disk around the M1e star DM Tau due to intense UV irradiation of the disk by the A0 star.
In this third CID paper, we report on the observations of CCH in three objects: DM Tau, LkCa 15 and MWC 480. The CCH molecule has been selected because it should be sensitive to the UV radiation field and because its chemistry is relatively well-studied, with many accurately determined relevant reaction rates (e.g., Woodall et al., 2007). Using the -minimization technique in the -plane as described in Guilloteau & Dutrey (1998), we derive the column density of CCH in the upper layers of the outer disks. We compare these values with the CCH column densities computed with realistic two-dimensional steady-state disk models and a gas-grain chemistry with surface reactions.
2 Observations
2.1 Sample of Stars
The source properties and their coordinates are summarized in Table 1. All these systems are isolated and located in regions devoid of CO contamination. The disk sizes, masses, and ages are presented in Table 2 (see also Tables 1 and 2 in CID1).
| Source | Right Ascension | Declination | Spect.Type | Effective Temp. | Stellar Lum. | Stellar Mass | Age | UV flux | X-ray lum. |
|---|---|---|---|---|---|---|---|---|---|
| (o,,), J2000.0 | (h,m,s), J2000.0 | (K) | () | () | (Myr) | () | erg s-1 | ||
| DM Tau | 04:33:48.73 | 18:10:09.89 | M1 | 3720 | 0.25 | 5 | 300 | ||
| LkCa 15 | 04:39:17.78 | 22:21:03.34 | K5 | 4350 | 0.74 | 3-5 | 1850 | ||
| MWC 480 | 04:58:46.26 | 29:50:36.87 | A4 | 8460 | 11.5 | 7 | 5000 |
Note. — Coordinates J 2000.0 deduced from the fit of the 1.3mm PdBI continuum map (Piétu et al., 2006). Col.3, 4, 5, 6 and 7 are the spectral type, effective temperature, the stellar luminosity, the stellar mass, and age as given in Simon et al. (2000). The stellar FUV luminosities at AU are given in Col. 8 in units of the Draine (1978) interstellar UV field. These values are rescaled from Bergin et al. (2003) (LkCa 15 and DM Tau) for the region, assuming that of the FUV flux is the Lyα radiation. For MWC 480 the UV flux is computed from the Kurucz (1993) ATLAS9 of stellar spectra. The stellar X-ray luminosities are taken from Glassgold et al. (2005).
| Source | Rout | Acc. Rate | Disk Mass | |||
|---|---|---|---|---|---|---|
| (o) | (AU) | (K) | ( yr-1) | () | ||
| DM Tau | -32 | 800 | 15 | 2.10-9 | 0.05 | |
| LkCa 15 | 52 | 680 | 15 | 10-8 | 0.03 | |
| MWC 480 | 38 | 695 | 30 | 10-8 | 0.03 |
Note. — Col.2 Inclinations are taken from Simon et al. (2000). Col.3 & 4 Apparent disk radii and temperature distribution are taken from the CO and HCO+ interferometric analysis of Piétu et al. (2007). Here denotes gas kinetic temperature at 100 AU, - the power-law exponent in the temperature distribution. Col.5 Accretion rates are taken as a generic value from D’Alessio et al. (1999) for MWC 480 and LkCa 15. The accretion rate for DM Tau is taken from Calvet et al. (2005). Col.6 Disk masses are from Dutrey et al. (1997) for DM Tau, Thi et al. (2004) for LkCa 15 and Mannings & Sargent (1997) for MWC 480.
2.2 PdBI observations and data reduction
The Plateau de Bure observations of the C2H(1-0) line in DM Tau were carried out in September & October 1997, and between October 2002 and March 2003, mostly in compact configurations. The total observing time on source (equivalent to 6 antennas) is about 30 hours and the angular resolution (with natural weighting) is . The (1-0) line in LkCa 15 and MWC 480 was observed in track-sharing mode in December 2004 and April 2005, with a total observing time on source of hours and an angular resolution of . The C2H(2-1) line was observed in track-sharing mode for the three sources in D configuration in August & September 2008. The total observing time on source with dual polarization receivers is 5 hours. The angular resolution is (with natural weighting).
Data were reduced with the GILDAS package. Flux calibration was performed using MWC 349. The continuum was subtracted for the analysis. The channel width is 0.25 km s-1 for the J=1-0 line and 0.26 km s-1 for the J=2-1 line. Integrated spectra over a region (for DM Tau) and region (for MWC 480 and LkCa 15) are presented in Fig. 1. We detected C2H 1-0 emission from DM Tau and LkCa 15, but not from MWC 480. The weak J=2-1 transition is detected in the T Tauri sources (see Fig. 1). The apparent disagreement between the observed and modeled line profiles for the DM Tau and LkCa 15 spectra are due to the relatively low signal-to-noise (SNR) level of our PdBI data.
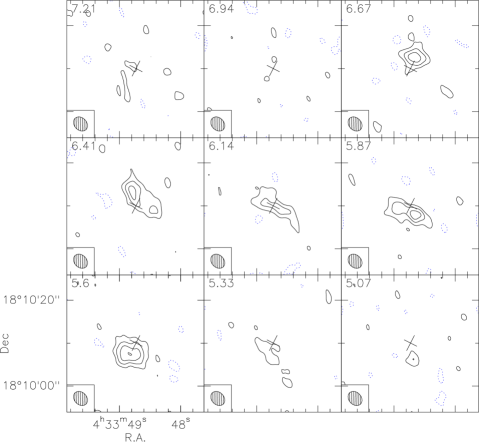
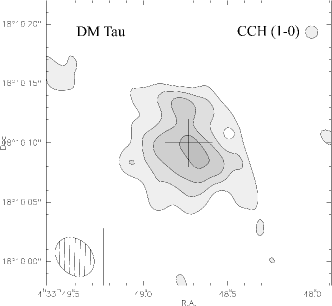
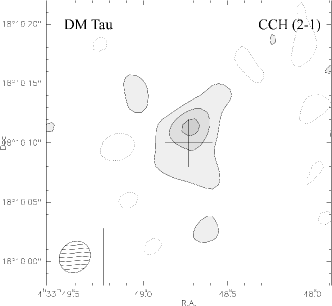
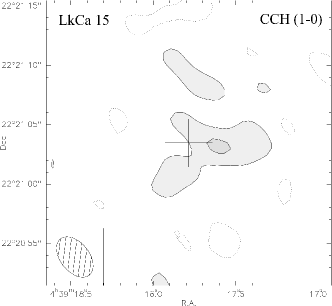
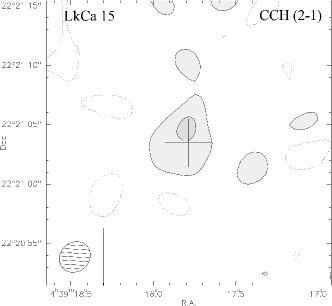
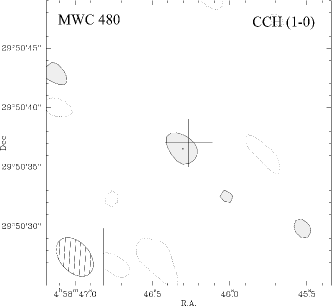
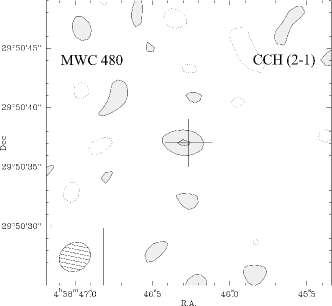
Channel maps of the C2H (1-0) emission in DM Tau are presented in Fig. 2. Since the signal-to-noise ratio of the C2H (1-0) spectra from MWC 480 and LkCa 15 is low, we analyzed these data as in our study of N2H+ J=1-0 in the same sources (Dutrey et al., 2007b). A filter to the spectra is applied, in which each velocity channel is weighted by the expected line intensity (obtained from the best fit modeling), and the sum over the channels is normalized by the sum of the weights (a classical optimal filtering). The resulting SNR maps are presented in Fig. 3, which illustrate marginal detection of C2H (1-0) in LkCa 15 and MWC 480 (Dutrey et al., 2007b).


2.3 Derived column densities
The distribution of C2H in DM Tau, LkCa 15 and MWC 480 was analyzed using a parametric disk model, in which the column density and excitation temperatures are power laws of the radius (see Piétu et al., 2007, for a more detailed description of the model). We used the geometric parameters (position, inclination, Keplerian velocity law) derived from the CO isotopologues and HCO+ (see Table 2). The -minimization technique of Guilloteau & Dutrey (1998) was applied to constrain the CCH column densities and other disk parameters. The observation of two C2H lines allows us to recover the excitation conditions (within the limitations due to low signal to noise data). As the lines are relatively weak, the exponent of the excitation temperature is not well constrained. We find for DM Tau, and assumed for the other sources. Such a value is in agreement with results obtained from stronger lines, in particular HCO+ (Table 2). Consequently, the excitation temperature of the DM Tau disk is well constrained, and poorly derived for LkCa 15. For MWC 480 we had to assume K in the data analysis. The obtained column densities are insensitive to the choice of the temperature in a range between 10 and K at 100 AU, and scale linearly with T for higher temperatures. The slope of the surface density distribution is constrained for DM Tau and Lk Ca 15. For MWC 480 we used a similar value. The derived temperature and column densities are summarized in Table 3.
| Source | DM Tau | LkCa 15 | MWC 480 |
|---|---|---|---|
| at 300 AU ( cm-2) | |||
| [0.5] | |||
| (AU) | [400] | ||
| at 300 AU (K) | [9] | ||
| [0.4] | [0.4] |
Note. — Values between square brackets indicate fixed parameters as constrained by the previous CO, HCO+ and new CCH data fitting. (Piétu et al., 2007). The derived CCH column density for MWC 480 is an upper limit.
3 Disk physical and chemical model
We refrain from comparing deconvolved observed and simulated spectral maps and base our analysis on the observed quantities derived with the -minimization method in the uv-plane (Guilloteau & Dutrey, 1998). This allows us to exclude computationally expensive iterative fitting of the data using 2D line radiative transfer modeling.
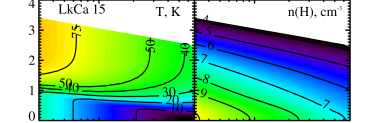
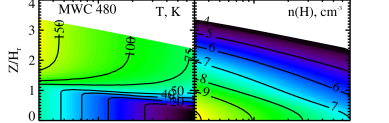
For all sources, we adopted a flared 1+1D-disk model with a vertical temperature gradient similar to that of D’Alessio et al. (1999), see Fig. 4. The -parameter for all three disks is chosen such that the modeled disk masses are in accordance with the observed values. Input disk and stellar parameters are either determined by the -fitting or taken from previous works (Dutrey et al., 1997; Mannings & Sargent, 1997; D’Alessio et al., 1999; Simon et al., 2000; Thi et al., 2004; Calvet et al., 2005; Piétu et al., 2007), see Table 2. The adopted viscosity parameter is 0.01 for DM Tau, 0.03 for LkCa 15, and 0.02 for MWC 480. It is chosen such that the resulting disk masses are the same as derived from millimeter dust continuum measurements. The dust grains are modeled as compact spheres of uniform 0.12 m radius made of amorphous silicates with olivine composition and the optical data taken from Draine & Lee (1984). The standard dust-to-gas mass ratio is assumed. In addition, we consider a model of the DM Tau disk with bigger m grains.
The disks are illuminated by the UV radiation from the central star and by the interstellar UV radiation. The intensity of the interstellar UV radiation field is as derived by Draine (1978). The UV intensity at a given disk location is calculated as a sum of the stellar and interstellar components that are scaled down by the visual extinction in vertical direction and in direction to the central star (1D plane-parallel approximation). The non-thermal FUV radiation field from DM Tau and LkCa 15 is represented by the scaled ISRF, while that of MWC 480 is represented by the scaled radiation field of the Herbig A0 star (according to van Dishoeck (1988) and van Dishoeck et al. (2006)). We model the attenuation of cosmic rays (CRP) by Eq. (3) from Semenov et al. (2004). In the disk interior, ionization due to the decay of short-living radionuclides is taken into account, assuming an ionization rate of s-1 (Finocchi & Gail, 1997). The intensity and radial penetration of the stellar X-ray radiation are modeled using observational results of Glassgold et al. (2005) and the 2D Monte Carlo simulations of Glassgold et al. (1997a, b).
We did not find any relevant data regarding observed X-ray luminosities for our stars and used the following estimates: erg s-1 for MWC 480, and erg s-1 for DM Tau and for LkCa 15. The low value of the adopted X-ray luminosity of MWC 480 reflects the fact that Herbig Ae stars have weak surface magnetic fields due to their non-convective interiors and thus lack an dynamo generation mechanism. Consequently, their coronal activity is lower and X-ray luminosities are 10-1000 times lower than that of T Tauri stars (Güdel & Nazé, 2009). Indeed, a few measurements of the strength of the longitudinal magnetic field in MWC 480 resulted in marginal detection of Gauss (Hubrig et al., 2004, 2006). For the T Tauri sources we adopted a median value as recently measured with Chandra and XMM in the Orion Nebula Cluster and the Cepheus B star-forming region (Preibisch et al., 2005; Getman et al., 2009): erg s-1 (with uncertainty of an order of magnitude). To investigate the role of the stellar X-ray radiation for the CCH chemical evolution, we consider three additional models of the DM Tau disk with and erg s-1.
We added a new class of the X-ray driven reactions to our chemical code leading to the formation of doubly-charged atoms (O++, C++, N++, S++, Fe++, Si++) due to the Auger effect. Secondary electron impact ionization cross sections were taken from Meijerink & Spaans (2005). Neutralization reactions of these doubly-charged ionized atoms by e- and charge transfer reactions with molecules are adopted from Stäuber et al. (2005). The photoionization cross sections are taken from Verner et al. (1993), as described in Maloney et al. (1996). In addition, we duplicated a few tens reactions of CRP with molecules to get the same reaction set for the X-ray photons. The rate of CO was modified in order to take self-shielding properly into account according to the Eq. 9 from Maloney et al. (1996).
The gas-grain time-dependent chemical model adopted in this study is mostly the same as in the CID2 paper. First, the osu.2007 network of gas-phase reactions222See: https://www.physics.ohio-state.edu/eric/research.html is used. Second, we utilize a standard rate approach to the surface chemistry modeling but without H and H2 tunneling (Katz et al., 1999). The surface reactions together with desorption energies were adopted from the model of Garrod & Herbst (2006), which is mostly based on previous studies of Hasegawa et al. (1992) and Hasegawa & Herbst (1993). Finally, rates of several tens of photodissociation and photoionization reactions are updated according to van Dishoeck et al. (2006), using the UV spectral shape typical of a Herbig Ae star and ISM-like dust grain optical properties. Overall, the disk chemical network consists of more than 650 species made of 13 elements and 7500 reactions.
Using this time-dependent model and the “low metals” initial abundances of Lee et al. (1998), distributions of the molecular abundances and column densities for the considered species are simulated over 5 Myr of evolution. The choice of initial abundances does not affect the resulting molecular abundances and column densities due to relatively high densities in and long evolutionary timescales of protoplanetary disks (see also Willacy et al., 2006).

4 Results of chemical modeling
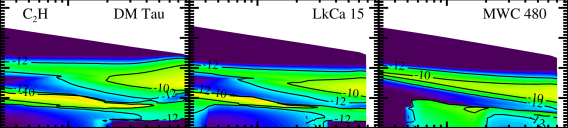
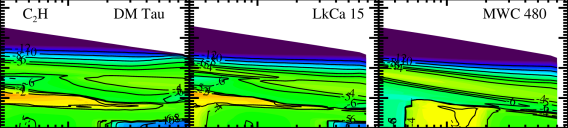
In Figure 5, the radial and vertical distribution of the absolute and relative C2H abundances (to the total amount of hydrogen) at 5 Myr are shown. The highest relative C2H abundance is only about (in DM Tau and LkCa 15) and several times lower in MWC 480. In DM Tau and LkCa 15 the warm layer of ethynyl is located at pressure scale height, with a local peak towards AU. Note that there is a second peak, better visible in relative concentration, which is located in the outer disk region and at higher disk heights ( AU, ), where the IS UV photons can penetrate. CCH is partly frozen out in all T Tau disk midplanes as its evaporation temperature is K. In the warmer disk of MWC 480 ethynyl reaches the highest relative abundance only in the outer disk region, at , while a peak in absolute CCH concentration is reached in the midplane around 100 AU. What is the reason for this chemical diversity of CCH in all 3 disks?
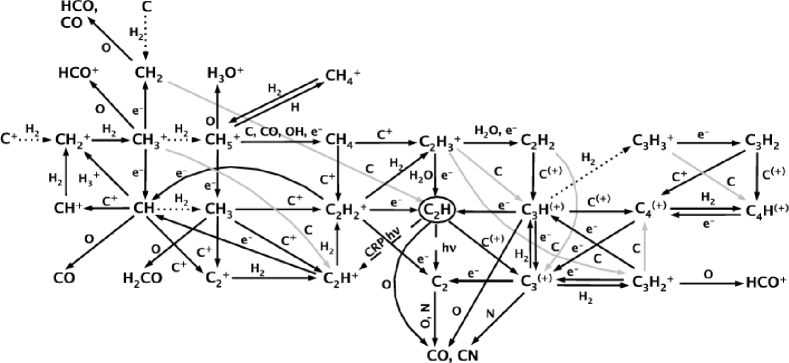
In essence, the chemical evolution of the ethynyl radical is determined by removal rates of carbon and oxygen into more complex molecules, e.g. CO, OH, H2O, as well as by photoprocesses and freeze-out/evaporation, see Fig. 7. Our chemical simulations begin with atomic initial abundances. Thus, light ionized hydrocarbons CH (n=2..5) are the first molecular species produced by radiative association with H2, following hydrogen addition reactions: C+ CH CH CH. The protonated methane reacts with electrons, CO, C, OH, and more complex species at later stage and forms methane. The CH4 molecules undergo reactive collisions with C+, producing C2H and C2H. An alternative way to produce C2H is the dissociative recombination of CH into CH3 followed by reactions with C+. The C2H ion is also formed by hydrogen addition to C2H. Finally, C2H and C2H dissociatively recombine into CH, C2H, and C2H2. Another important formation channel for ethynyl is by surface hydrogenation of precursor species, C2.
The major removal pathway for C2H is either the direct neutral-neutral reaction with O that forms CO, or the same reaction but with heavier carbon chain ions that are formed from ethynyl by subsequent insertion of carbon. In upper disk regions photodissociation of CCH into C2 and H (with the rate constant s-1 and AV exponent ) and photoionization ( s-1, ) are efficient (van Dishoeck, 1988). At later times, in colder disk regions depletion and gas-phase reactions with more complex species may enter into this cycle. One can restore high concentrations of CCH obtained at early times, years by destroying CO and enriching the gas with elemental carbon. In disk it happens in the inner region either by reactions of CO with ionized helium atoms produced by the stellar X-ray radiation, or directly upon irradiation of CO by UV photons. This second rise in the CCH concentration is typically reached only at very late times in our models, Myr.
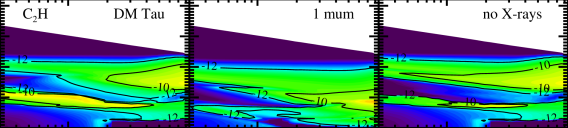
The relative importance of X-ray and UV radiation is shown in Fig. 6, using the disk around DM Tau as an example. The prominent intermediate layer of CCH almost disappears in the model without X-ray irradiation, and when grains grow beyond m. The lower opacities in the model with “big” grains shifts the upper outer layer of CCH towards midplane, following the enhanced penetration of the dissociating interstellar UV radiation. Thus CCH is indeed a sensitive tracer of the UV radiation field. The lack of X-ray irradiation results in a less “sharp” inner shape of the upper CCH layer (compare left and right panels in Fig. 6), and low CCH abundances in the intermediate layer. In the absence of X-ray radiation, ionized helium is only produced by interactions with cosmic ray particles, and thus replenishment of C+ and O into the gas upon destruction of CO by He+ is lower. Still, there is an “island” of high CCH concentration in the intermediate layer at AU in the model of DM Tau without X-rays.
MWC 480, as a Herbig Ae star, emits and times more UV photons than LkCa 15 and DM Tau, respectively, but has a weak X-ray luminosity (see Table 1). Consequently, the upper CCH layer is more noticeable in the MWC 480 disk, where a larger fraction of elemental carbon can be kept from being locked in CO and other species by photodissociation. Note that the molecular-poor atmosphere is slightly more extended in the MWC 480 disk compared to those of LkCa 15 and DM Tau (upper panel in Fig. 5). The low X-ray luminosity of MWC 480 assumed in our modeling also leads to lower concentration of CCH in the inner warm molecular layer ( AU, pressure scale height). However, there is a region around the midplane ( AU, up to ) where absolute abundances of CCH are high in the MWC 480 disk. Since the Herbig Ae disk is warm, surface processes involving heavy radicals are more active there, while volatile ices are nearly absent. Using our chemical analyzing software, we found that the oasis of CCH in MWC 480 is due to efficient surface hydrogenation of C2 ice, and other surface reactions (e.g., photodissociation of C2H2 ice, and surface formation of C2 from two C atoms). Temperature there ranges from 23–50 K, while densities are high, cm-1, resulting in fast accretion rates of precursor molecules to grain surfaces and sufficiently high desorption rate of CCH. Note that this oasis of ethynyl appears only after Myr of evolution, due to slow surface chemistry. In both T Tau disks photodissociation of CO is effective in the outer upper disk region. Both DM Tau and LkCa 15 have non-negligible X-ray luminosity of erg s-1 (Glassgold et al., 2005), and thus CCH can be re-formed toward inner disk regions, see Fig. 5.
The observed and modeled CCH column densities are compared in Fig. 8 (left panel). The CCH column densities in the DM Tau disk computed with the model without X-ray radiation and the model with bigger m grains are depicted in Fig. 8 (middle panel). The influence of the adopted stellar X-ray luminosity on the CCH column densities in the DM Tau disk is shown in the right panel. As we mentioned above, the X-ray photons enhance CCH abundances, leading to higher CCH column densities (by a factor of 3-10). In the model with micron-sized grains CCH has high column density only in the very outer disk region, at radii larger than AU, while it drops quickly in the inner disk zone. Given the uncertainty of the modeled column densities (a factor of , see Wakelam et al., 2005; Vasyunin et al., 2008) and observational uncertainties (see error-bars in Fig. 8), our relatively simple steady-state disk model is in a moderate agreement with the observed quantities. In particular, the flat radial slope of the CCH column densities is reproduced by the simulations. Note that the column density of CCH in MWC 480 is lower compared to that of the DM Tau and LkCa 15 disks, and a similar trend exists in the observational data.
The effect of the stellar X-ray radiation field on the computed CCH column densities is such that the lower the adopted X-ray luminosity, the lower the resulting , see Fig. 8, right panel. Apparently, a transition from erg s-1 to erg s-1 is less prominent in the CCH column densities than a transition from erg s-1 to erg s-1. Thus, indeed the ethynyl radical can serve as a sensitive probe of the impinging X-ray radiation field. In general, it is the stellar UV luminosity that affects the evolution of CCH globally, with X-ray radiation being only important in inner disk regions ( AU).
5 Discussion
As we have shown in Schreyer et al. (2008), the stellar UV luminosity can be a crucial factor that makes the AB Aur system chemically poorer with respect to the disk of DM Tau. The same trend is found here for C2H and the disks around MWC 480 and DM Tau. However, we also show that X-ray radiation plays an important role for high CCH concentration in the inner regions of T Tau disks. Furthermore, the results of the steady-state disk chemical model is in qualitative agreement with the CCH column densities obtained by -fitting of the spectral maps. In contrast to our CID1 paper (Dutrey et al., 2007b), where such a model could not fit well the radial slope of the N2H+ column densities, in the case of CCH the flat distribution is obtained both from the analysis of the interferometric data and chemical modeling.
Our chemical modeling predicts that two CCH molecular layers are located at elevated disk heights, or in warm disk regions ( K). This is inconsistent with the very low excitation temperature of the CCH emission derived for DM Tau. The critical densities for the CCH (1-0) and CCH(2-1) lines to be thermalized are cm-3 and cm-3, respectively. The two layers of CCH have higher densities of cm-3 in all studied sources (compare Fig. 4 and Fig. 5). Note that CCH layers are at higher densities in the MWC 480 disk compared to those around LkCa 15 and DM Tau. Hence, according to our model CCH(1-0) and (2-1) should be thermalized in all considered sources, and sub-thermal excitation of these lines is unlikely.
Which factors that are not taken into account in our simplified chemical modeling could lead to a substantial concentration of CCH in the cold disk midplane of DM Tau and LkCa 15? As we have found in Semenov et al. (2006) (and later confirmed by Aikawa, 2007), turbulent transport can enhance the CO concentration in the DM Tau disk midplane such that 13CO (1-0) and (2-1) lines are indeed “cold” ( K). Later, Hersant et al. (2009) have shown that the scattering of the stellar UV radiation by PAHs and dust grains in upper disk atmosphere can redirect a portion of these UV photons into the disk, allowing CO to efficiently desorb from dust grains in the cold disk zone. Despite the fact that this assumption is not considered in our model, where desorption of surface molecules in the disk midplane is only due to the CRP-driven UV radiation and CRP heating, a non-negligible amount of CCH exists in the outer disk midplane at K, see Fig. 9 (left panel). The CCH column density in DM Tau at K has a maximum value of cm-2 at AU, which rapidly decreases with radius. In warmer regions of the DM Tau disk the CCH column density is about 5 times higher, cm-2, and has an almost flat profile. Thus, we expect that only of the CCH (1-0) and (2-1) line fluxes arise from the cold disk zone.
The amount of cold gases in disk midplanes can also be increased if gas-grain interactions are ineffective such that freeze-out is delayed toward late evolutionary times (e.g., Aikawa, 2007). We did several test calculations with bigger grains of m and found that indeed neutral species become more abundant in cold disk region. The results for molecular chemistry in disks using a realistic grain evolutionary model will be reported in a separate publication. In essence, in evolving disks substantial amount of gas-phase molecules in very cold region can be produced and sustained by moderate grain growth and sedimentation of micron-sized and bigger grains toward the midplane, while a fraction of smaller grains and PAHs remains in the disk atmosphere and provides enough opacities to keep the disk interior cool (see e.g., Aikawa & Nomura, 2006; Jonkheid et al., 2007; Brauer et al., 2008; Birnstiel et al., 2009).
Finally, in our disk model dust thermal balance is used to compute the temperature distribution, which is assumed to be the same for the gas. In the disk atmosphere gas will be hotter due to e.g. photoelectric heating of small dust grains/PAHs by stellar/IS UV & X-rays photons. We do not take this effect into account. For CCH lines it is of no concern as derived low excitation temperatures for the 1-0 and 2-1 transitions are indicative of a substantial amount of ethynyl being located in the cold disk zone around the midplane. In addition, our modeling results show that the majority of CCH is located at scale heights of for DM Tau and LkCa 15 and is even closer to the disk midplane for MWC 480 (Fig. 5, bottom row). When compared to the corresponding disk density structures (Fig. 4), it becomes apparent that the CCH molecular layers are within the disk regions having particle densities of several - cm-3. These regions are dense enough to allow effective coupling of gas and dust kinetic temperatures.


6 Summary & Conclusions
We observed protoplanetary disks around the Herbig Ae star MWC 480 and the T Tauri stars LkCa 15 and DM Tau in the (1-0) and (2-1) lines of CCH. We detected and mapped these disks in the CCH lines, using the IRAM Plateau de Bure Interferometer in the C- and D-configurations. Using the iterative minimization technique, the column densities of ethynyl are derived, which are lower in MWC 480 ( cm-2) than in DM Tau and LkCa 15 ( cm-2). The derived excitation temperature of CCH in DM Tau is very low, K, which is along with previous detections of cold gas in this object (CO, HCO+, CH, and HCN). The observed CCH column densities are compared with the results of advanced chemical modeling, which is based on a steady-state flared disk structure with a vertical temperature gradient, and a gas-grain chemical network with surface reactions. The CCH abundances in all disk models show two layers of high concentration. Overall, the disk around the Herbig Ae star MWC 480 has less CCH, which we explain by the strong UV radiation field of this object, and the lack of X-ray irradiation from the star. The modeled CCH column densities are in qualitative agreement with the observed values at an evolutionary time of a few million years. Altogether, our measurements and modeling support the observational trend that disks around Herbig Ae stars tend to be more molecule deficient compared to those surrounding T Tauri stars due to stronger UV irradiation and lower X-ray luminosities (affecting inner disk chemistry). Our model reproduces the radial slope of the CCH column densities. Yet it fails to explain the low excitation temperature of the observed CCH lines as the modeled CCH molecular layers are located in disk regions dense enough to thermalize both transitions. The chemical simulations show that only of the CCH column densities are in the region of the DM Tau disk that is colder than 20 K. Other mechanisms (stronger photodesorption, dynamic processes, grain growth) are required to enhance the abundance of CCH in the cold disk midplanes.
References
- Aikawa (2007) Aikawa, Y. 2007, ApJ, 656, L93
- Aikawa & Nomura (2006) Aikawa, Y. & Nomura, H. 2006, ApJ, 642, 1152
- Bergin et al. (2003) Bergin, E., Calvet, N., D’Alessio, P., & Herczeg, G. J. 2003, ApJ, 591, L159
- Bergin et al. (2007) Bergin, E. A., Aikawa, Y., Blake, G. A., & van Dishoeck, E. F. 2007, in Protostars and Planets V, ed. B. Reipurth, D. Jewitt, & K. Keil, 751–766
- Birnstiel et al. (2009) Birnstiel, T., Dullemond, C. P., & Brauer, F. 2009, A&A, 503, L5
- Brauer et al. (2008) Brauer, F., Dullemond, C. P., & Henning, T. 2008, A&A, 480, 859
- Calvet et al. (2005) Calvet, N., D’Alessio, P., Watson, D. M., Franco-Hernández, R., Furlan, E., Green, J., Sutter, P. M., Forrest, W. J., Hartmann, L., Uchida, K. I., Keller, L. D., Sargent, B., Najita, J., Herter, T. L., Barry, D. J., & Hall, P. 2005, ApJ, 630, L185
- Carr & Najita (2008) Carr, J. S. & Najita, J. R. 2008, Science, 319, 1504
- D’Alessio et al. (1999) D’Alessio, P., Calvet, N., Hartmann, L., Lizano, S., & Cantó, J. 1999, ApJ, 527, 893
- Draine (1978) Draine, B. T. 1978, ApJS, 36, 595
- Draine & Lee (1984) Draine, B. T. & Lee, H. M. 1984, ApJ, 285, 89
- Dutrey et al. (1997) Dutrey, A., Guilloteau, S., & Guelin, M. 1997, A&A, 317, L55
- Dutrey et al. (2007a) Dutrey, A., Guilloteau, S., & Ho, P. 2007a, in Protostars and Planets V, ed. B. Reipurth, D. Jewitt, & K. Keil, 495–506
- Dutrey et al. (2007b) Dutrey, A., Henning, T., Guilloteau, S., Semenov, D., Piétu, V., Schreyer, K., Bacmann, A., Launhardt, R., Pety, J., & Gueth, F. 2007b, A&A, 464, 615
- Finocchi & Gail (1997) Finocchi, F. & Gail, H.-P. 1997, A&A, 327, 825
- Garrod & Herbst (2006) Garrod, R. T. & Herbst, E. 2006, A&A, 457, 927
- Getman et al. (2009) Getman, K. V., Feigelson, E. D., Luhman, K. L., Sicilia-Aguilar, A., Wang, J., & Garmire, G. P. 2009, ApJ, 699, 1454
- Glassgold et al. (2005) Glassgold, A. E., Feigelson, E. D., Montmerle, T., & Wolk, S. 2005, in Astronomical Society of the Pacific Conference Series, Vol. 341, Chondrites and the Protoplanetary Disk, ed. A. N. Krot, E. R. D. Scott, & B. Reipurth, 165–+
- Glassgold et al. (1997a) Glassgold, A. E., Najita, J., & Igea, J. 1997a, ApJ, 480, 344
- Glassgold et al. (1997b) —. 1997b, ApJ, 485, 920
- Güdel & Nazé (2009) Güdel, M. & Nazé, Y. 2009, A&A Rev., 17, 309
- Guilloteau & Dutrey (1998) Guilloteau, S. & Dutrey, A. 1998, A&A, 339, 467
- Hasegawa & Herbst (1993) Hasegawa, T. I. & Herbst, E. 1993, MNRAS, 263, 589
- Hasegawa et al. (1992) Hasegawa, T. I., Herbst, E., & Leung, C. M. 1992, ApJS, 82, 167
- Hersant et al. (2009) Hersant, F., Wakelam, V., Dutrey, A., Guilloteau, S., & Herbst, E. 2009, A&A, 493, L49
- Hubrig et al. (2004) Hubrig, S., Schöller, M., & Yudin, R. V. 2004, A&A, 428, L1
- Hubrig et al. (2006) Hubrig, S., Yudin, R. V., Schöller, M., & Pogodin, M. A. 2006, A&A, 446, 1089
- Jonkheid et al. (2007) Jonkheid, B., Dullemond, C. P., Hogerheijde, M. R., & van Dishoeck, E. F. 2007, A&A, 463, 203
- Katz et al. (1999) Katz, N., Furman, I., Biham, O., Pirronello, V., & Vidali, G. 1999, ApJ, 522, 305
- Kurucz (1993) Kurucz, R. 1993, ATLAS9 Stellar Atmosphere Programs and 2 km/s grid. Kurucz CD-ROM No. 13. Cambridge, Mass.: Smithsonian Astrophysical Observatory, 1993., 13
- Lahuis et al. (2006) Lahuis, F., van Dishoeck, E. F., Boogert, A. C. A., Pontoppidan, K. M., Blake, G. A., Dullemond, C. P., Evans, II, N. J., Hogerheijde, M. R., Jørgensen, J. K., Kessler-Silacci, J. E., & Knez, C. 2006, ApJ, 636, L145
- Lee et al. (1998) Lee, H.-H., Roueff, E., Pineau des Forets, G., Shalabiea, O. M., Terzieva, R., & Herbst, E. 1998, A&A, 334, 1047
- Maloney et al. (1996) Maloney, P. R., Hollenbach, D. J., & Tielens, A. G. G. M. 1996, ApJ, 466, 561
- Mannings & Sargent (1997) Mannings, V. & Sargent, A. I. 1997, ApJ, 490, 792
- Meijerink & Spaans (2005) Meijerink, R. & Spaans, M. 2005, A&A, 436, 397
- Panić et al. (2009) Panić, O., Hogerheijde, M. R., Wilner, D., & Qi, C. 2009, A&A, 501, 269
- Pascucci et al. (2009) Pascucci, I., Apai, D., Luhman, K., Henning, T., Bouwman, J., Meyer, M. R., Lahuis, F., & Natta, A. 2009, ApJ, 696, 143
- Piétu et al. (2007) Piétu, V., Dutrey, A., & Guilloteau, S. 2007, A&A, 467, 163
- Piétu et al. (2006) Piétu, V., Dutrey, A., Guilloteau, S., Chapillon, E., & Pety, J. 2006, A&A, 460, L43
- Piétu et al. (2005) Piétu, V., Guilloteau, S., & Dutrey, A. 2005, A&A, 443, 945
- Preibisch et al. (2005) Preibisch, T., Kim, Y., Favata, F., Feigelson, E. D., Flaccomio, E., Getman, K., Micela, G., Sciortino, S., Stassun, K., Stelzer, B., & Zinnecker, H. 2005, ApJS, 160, 401
- Qi et al. (2008) Qi, C., Wilner, D. J., Aikawa, Y., Blake, G. A., & Hogerheijde, M. R. 2008, ApJ, 681, 1396
- Qi et al. (2006) Qi, C., Wilner, D. J., Calvet, N., Bourke, T. L., Blake, G. A., Hogerheijde, M. R., Ho, P. T. P., & Bergin, E. 2006, ApJ, 636, L157
- Salyk et al. (2008) Salyk, C., Pontoppidan, K. M., Blake, G. A., Lahuis, F., van Dishoeck, E. F., & Evans, II, N. J. 2008, ApJ, 676, L49
- Schreyer et al. (2008) Schreyer, K., Guilloteau, S., Semenov, D., Bacmann, A., Chapillon, E., Dutrey, A., Gueth, F., Henning, T., Hersant, F., Launhardt, R., Pety, J., & Piétu, V. 2008, A&A, 491, 821
- Semenov et al. (2005) Semenov, D., Pavlyuchenkov, Y., Schreyer, K., Henning, T., Dullemond, C., & Bacmann, A. 2005, ApJ, 621, 853
- Semenov et al. (2004) Semenov, D., Wiebe, D., & Henning, T. 2004, A&A, 417, 93
- Semenov et al. (2006) —. 2006, ApJ, 647, L57
- Simon et al. (2000) Simon, M., Dutrey, A., & Guilloteau, S. 2000, ApJ, 545, 1034
- Stäuber et al. (2005) Stäuber, P., Doty, S. D., van Dishoeck, E. F., & Benz, A. O. 2005, A&A, 440, 949
- Thi et al. (2004) Thi, W.-F., van Zadelhoff, G.-J., & van Dishoeck, E. F. 2004, A&A, 425, 955
- van Dishoeck (1988) van Dishoeck, E. F. 1988, in ASSL Vol. 146: Rate Coefficients in Astrochemistry, ed. T. Millar & D. Williams (Kluwer Academic Publishers, Dordrecht), 49–72
- van Dishoeck et al. (2006) van Dishoeck, E. F., Jonkheid, B., & van Hemert, M. C. 2006, in Faraday discussion, Vol. 133, Chemical evolution of the Universe, ed. I. R. Sims & D. A. Williams, 231–244
- Vasyunin et al. (2008) Vasyunin, A. I., Semenov, D., Henning, T., Wakelam, V., Herbst, E., & Sobolev, A. M. 2008, ApJ, 672, 629
- Verner et al. (1993) Verner, D. A., Yakovlev, D. G., Band, I. M., & Trzhaskovskaya, M. B. 1993, Atomic Data and Nuclear Data Tables, 55, 233
- Wakelam et al. (2005) Wakelam, V., Selsis, F., Herbst, E., & Caselli, P. 2005, A&A, 444, 883
- Willacy et al. (2006) Willacy, K., Langer, W., Allen, M., & Bryden, G. 2006, ApJ, 644, 1202
- Woodall et al. (2007) Woodall, J., Agúndez, M., Markwick-Kemper, A. J., & Millar, T. J. 2007, A&A, 466, 1197