Elemental energy spectra of cosmic rays measured by CREAM-II
Abstract
We present new measurements of the energy spectra of cosmic-ray (CR) nuclei from the second flight of the balloon-borne experiment CREAM (Cosmic Ray Energetics And Mass). The instrument (CREAM-II) was comprised of detectors based on different techniques (Cherenkov light, specific ionization in scintillators and silicon sensors) to provide a redundant charge identification and a thin ionization calorimeter capable of measuring the energy of cosmic rays up to several hundreds of TeV. The data analysis is described and the individual energy spectra of C, O, Ne, Mg, Si and Fe are reported up to eV. The spectral shape looks nearly the same for all the primary elements and can be expressed as a power law in energy . The nitrogen absolute intensity in the energy range 100-800 GeV/n is also measured.
Cosmic-ray nuclei, energy spectrum, composition, balloon experiments
1 Introduction
CREAM is a balloon-borne experiment designed to directly measure
the elemental composition and the energy spectra of
cosmic rays from H to Fe in the energy range 1011-1015 eV.
CREAM aims to experimentally test astrophysical models proposed to
explain the acceleration mechanism
of cosmic rays and their propagation in the Galaxy [1].
Since 2004, four instruments were successfully flown on long-duration balloons
in Antarctica.
The instrument configurations varied slightly in each mission,
due to various detector upgrades.
In this paper, we describe the procedure used to analyze the data
collected during the second flight and reconstruct the energy spectra
of the major primary CR nuclei and nitrogen. Results are compared with other
direct observations and discussed.
2 The CREAM-II instrument
The instrument for the second flight included: a
redundant system for particle identification, consisting
(from top to bottom)
of a timing-charge detector (TCD), a
Cherenkov detector (CD), a pixelated silicon charge detector (SCD), and
a sampling imaging calorimeter (CAL) designed to provide a
measurement of the energy of primary nuclei in the multi-TeV region.
The TCD is comprised of two planes
of four 5 mm-thick plastic scintillator paddles,
read out by fast photomultiplier tubes (PMTs) and covering an area of 120120 cm2.
It was designed to determine each element charge
with a resolution 0.35 (units of the electron charge) and
discriminate against albedo particles [2].
The CD is a 1 cm-thick plastic radiator, with 1 m2 surface area, read out by eight PMTs via wavelength shifting bars.
It is mainly used to flag relativistic particles.
The SCD is a dual layer of 312 silicon sensors, each segmented as an array of 44
pixels which covers an effective area of 0.52 m2 with no dead regions.
It is capable of resolving individual elements
from H to Ni with a fine charge resolution [3].
The CAL is a stack of 20 tungsten plates (5050 cm2 and 1 radiation-length thick)
interleaved with active layers of
1 cm-wide scintillating fiber ribbons, read out by 40 hybrid photodiodes [4]. A 0.47 -thick graphite target precedes the CAL, and serves
to induce hadronic interactions of the CR nuclei.
The electromagnetic (e.m.) core of the resulting hadronic cascade is imaged by the CAL which is sufficiently thick
to contain the shower maximum and grained finely enough to reconstruct the direction of the incident particle.
CREAM-II was launched on Dec. 16th 2005 from McMurdo and floated
over Antarctica for 28 days, at a balloon altitude of 35 to 40 km.
All the detectors performed well in flight.
The data acquisition was enabled by the trigger system
whenever a shower developing in at least 6 planes was detected in the CAL or
a relativistic cosmic ray with Z 2 was identified by the TCD and CD.
A total of 57 GB of data were collected.
A detailed description of the instrument and its performance in flight is given in [5].
3 Data analysis
The present analysis uses a subset of data collected in the period Dec. 19th- Jan. 12th, having stable instrument conditions. In order to measure the elemental energy spectra, each detected CR particle has been assigned a charge and an energy. An accurate reconstruction of the particle trajectory through the instrument is needed for the charge determination.
3.1 Trajectory reconstruction
The axis of the shower imaged by the calorimeter can be measured to determine the arrival direction of a CR nucleus. Candidate track points are sampled along the longitudinal development of the shower. They are defined as the center of gravity of the cluster formed in each CAL plane by the cell with the maximum signal and its two neighbours. A track is built by matching the candidate points and the shower axis parameters are calculated with a linear fit of the track. Track quality is assessed by requiring a value of 10. The reconstructed shower axis is back-projected through the graphite target to its intersections with the two SCD layers. These define the impact points of the primary particle, with a spatial resolution better than 1 cm rms.
3.2 Charge assignment
In each SCD layer, the pixel with the highest signal is sought inside a fiducial circle with a 3 cm radius centered on the impact point. In order to achieve high purity samples of CR elements, the signals of the two selected pixels are required to be consistent within 30%. In such a case, the two independent samples of the specific ionization are then corrected for the pathlength (estimated from the track parameters) traversed by the particle in the silicon sensors. The accuracy of the pathlength correction is improved by adding the matched SCD pixels to the track points and refitting them again. By combining the two corrected measures of , the primary particle charge is estimated.

The charge distribution reconstructed by the SCD is shown in Fig. 1; by fitting each peak to a gaussian, a charge resolution is estimated as: 0.2 for C, N, O; 0.23 for Ne, Mg, Si; 0.5 for Fe. Samples of each element up to Si are selected with a 2 cut around the mean charge value, while for iron a 1 cut is used. In this way, 1288 O are retained, as well as 456 Si and 409 Fe candidates.
3.3 Energy measurement and deconvolution
The CREAM thin ionization calorimeter
samples the e.m.
core of the hadronic cascade
initiated by a cosmic ray interacting in the target.
According to the results of tests with particle beams [6]
and Monte Carlo (MC) simulations based on the FLUKA 2006.3b package
[7], though
a significant part of the cascade energy leaks out of the calorimeter,
the primary particle energy still scales linearly with the energy
deposited in the CAL by the shower core
up to several hundreds of TeV.
The total energy deposit
is measured by summing up the calibrated signals of all the CAL cells.
Once each cosmic ray is assigned an energy, the reconstructed particles of each nuclear
species are sorted into energy intervals
with width commensurate with the rms resolution of the calorimeter.
Due to the finite energy resolution of the detector, of the order of 30% for
heavy nuclei with energy 1 TeV,
an unfolding procedure has to be applied to correct
the measured counts
in each energy interval for overlap with the neighbouring bins.
This requires solving a set of linear equations
relating the “true” counts of incident energy bins to the measured counts of deposited energy bins. A generic element of the mixing matrix represents the probability that a CR particle, carrying an energy corresponding to a given energy bin j, produces an energy deposit in the calorimeter falling in the bin i. The unfolding matrix elements are estimated by analyzing MC simulated CR events with the same procedure as that used for the flight data.
4 Energy spectrum
The absolute differential intensity at the top of the atmosphere is calculated by dividing the unfolded number of events by the bin width , according to the formula
where T is the exposure time, the efficiency of the selection cuts, the geometric factor
of the instrument, and TOI and TOA are, respectively, the corrections to the top of instrument
and to the top of the atmosphere. Each bin is
centered at a median energy calculated as described in [8].
The geometric factor is estimated to be 0.46 m2sr
from MC simulations.
The selected set of data amounts to a live time T of
16 days and 19 hours, close to 75% of the real time of data taking, as measured by the
housekeeping system onboard.
The MC estimated overall reconstruction efficiency has a constant value of around 70% at energies
3 TeV for all nuclei.
The probability that a nucleus undergoes a spallation reaction in the
material ( 4.8 g/cm2) above
the upper SCD plane is also estimated from MC simulations.
The fraction of surviving nuclei, i.e., the TOI correction,
spans from 81.3% for C to 61.9% for Fe.
The TOA correction is calculated by simulating with FLUKA the atmospheric
overburden
during the flight (3.9 g/cm2 on average).
Survival probabilities
ranging from 84.2% for C to 71.6% for Fe are found.
The TOI and TOA corrections take into account only the loss of primary particles
interacting in the atmosphere and in the instrument materials.
Furthermore,
the counts for each species are corrected for the gain
of secondary particles produced by spallation reactions
of heavier CR nuclei. These corrections are of the order of few percent for all the considered elements
but nitrogen. In fact,
30% of the observed N nuclei originate from the spallation of much more abundant oxygen.
5 Results
The differential intensity at the top of the atmosphere as measured by CREAM-II
for the major primary CR nuclei from carbon to iron
is plotted as a function of the
kinetic energy per nucleon in Fig. 2.
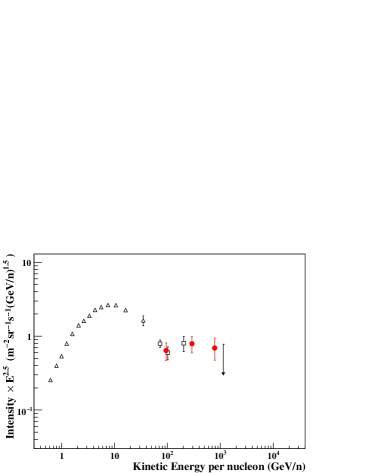
The nitrogen energy spectrum (multiplied by ) is shown
in Fig. 3.
The error bars in the intensity are calculated as the sum in quadrature
of the error due to the counting statistics and the systematic uncertainties.
The main systematic uncertainties
stem from the reconstruction algorithm and from the TOI and TOA corrections. In the first case,
the fractional systematic error is estimated to be of order 10% in the energy bins below 3 TeV and 5% above.
The systematic error for the uncertainty in correcting
the differential intensity to the top of instrument is 2%
for the primary elements. For nitrogen, a 15% error is assigned because of the large contamination
of O nuclei which spallate into N.
Similar values are estimated for the systematic error deriving from the uncertainties in the atmospheric
secondary corrections.
In summary, the particle energy range measured by CREAM-II
extends from around 800 GeV up to 100 TeV.
The absolute intensities are presented without any arbitrary normalization to previous data
and cover a range of six decades.
6 Discussion
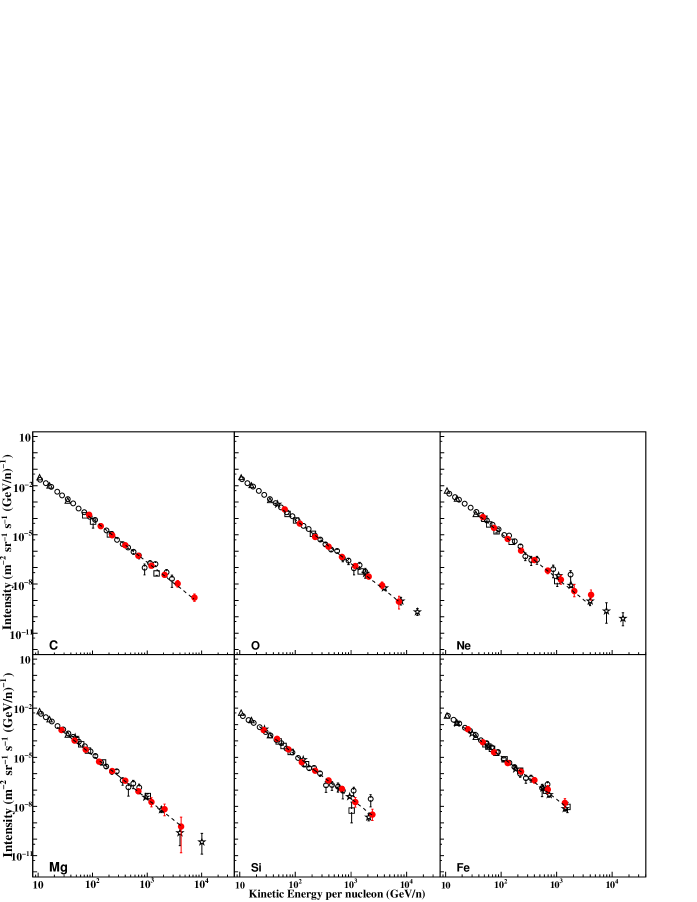
The CREAM-II results for primary nuclei
are found in general to be in good agreement with previous measurements of
space-based (HEAO-3-C2 [9], CRN [10]) and
balloon-borne (ATIC-2 [11], TRACER [12])
experiments.
A power-law fit to our data indicates
that the intensities of the more abundant evenly charged heavy elements
have a very similar energy dependence. That is, their spectra
are characterized, within errors, by nearly
the same spectral index .
Our observations, based on a calorimetric measurement of the CR energy,
confirm the results recently reported by the TRACER collaboration,
using completely different techniques to determine the particle energy.
The weighted average of the fitted spectral indices (Fig. 2)
is
, consistent, within the error,
with the value of
obtained from a fit to the combined CRN and TRACER data [12].
The great similarity of the spectral indices
suggests that
the same mechanism is responsible for the source acceleration of the primary heavy nuclei,
assuming, as common, that the escape pathlength of primary elements from the galaxy does not
depend on the particle charge for primary elements.
The nitrogen data collected by CREAM-II are statistically
more significant at high energy than any previous observation.
Unlike the primary heavy nuclei, nitrogen is
mostly produced by spallation in the interstellar medium
but also has a primary contribution of order 10%, as recently measured by CREAM-I [14].
We notice that, at energies above 100 GeV/n, the nitrogen spectrum
flattens out from the steep decline which characterizes the energy range 10-100 GeV/n.
This supports the hypothesis of the presence of two components in the cosmic nitrogen.
In fact, since the escape pathlength decreases rapidly with energy,
the secondary nitrogen is expected to become negligible
at high energy, where only the primary component should remain. This might result in a change of the
spectral slope, as observed.
To provide a check to our measurements, we calculate the
relative abundance ratio of N/O
and compare it with the CREAM-I result. A N/O ratio
(at the top of the atmosphere) equal to
is measured
at an energy of 800 GeV/n, in good agreement with
the CREAM-I result [14].
7 Conclusion
The CREAM-II instrument carried out measurements of high Z cosmic ray nuclei
with an excellent charge resolution and a reliable energy determination.
The energy spectra of the major primary heavy nuclei from C to Fe
were measured up to 1014 eV and found to agree well with earlier direct measurements.
A new measurement of the nitrogen intensity in an energy region thus far experimentally unexplored
indicates a less steep power-law trend in the spectrum with respect to lower energies.
Acknowledgments
This work is supported by NASA, NSF and CSBF in USA, INFN and PNRA in Italy, KICOS and MOST in Korea.
References
- [1] E.S. Seo et al., Adv. Sp. Res. 33(10) (2004) 1777
- [2] H.S. Ahn et al., Nucl. Instr. Meth. A 602 (2009) 525
- [3] S. Nam et al., IEEE Trans. Nucl. Sci. 54(5) (2007) 1743
- [4] P.S. Marrocchesi et al., Nucl. Instr. Meth. A 535 (2004) 143
- [5] P.S. Marrocchesi et al., Adv. Sp. Res. 41 (2008) 2002
- [6] H.S. Ahn et al., Nucl. Phys. B (Proc. Suppl.) 150 (2006) 272
- [7] A. Fassò, A. Ferrari, J. Ranft, P.R. Sala, CERN-2005-10 (2005), INFN/TC_05/11, SLAC-R-773
- [8] G.D. Lafferty, T.T. Wyatt, Nucl. Instr. Meth. A 355 (1995) 541
- [9] J.J. Engelmann et al., A&A 233 (1990) 96
- [10] D. Müller et al., ApJ 374 (1991) 356
- [11] A.D. Panov et al., Adv. Sp. Res. 37 (2006) 1944
- [12] M. Ave et al., ApJ 678(1) (2008) 262
- [13] S.P. Swordy et al., ApJ 349 (1990) 625
- [14] H.S. Ahn et al., Astropart. Phys. 30 (2008) 133