Measurements of cosmic-ray energy spectra with the 2nd CREAM flight
Abstract
During its second Antarctic flight,
the CREAM (Cosmic Ray Energetics And Mass) balloon experiment
collected
data for 28 days, measuring the charge and the energy of cosmic rays (CR)
with a redundant system of particle identification
and an imaging thin ionization calorimeter.
Preliminary direct measurements of the absolute intensities
of individual CR nuclei
are reported in the elemental range from carbon to iron at very high energy.
1 Introduction
The CREAM experiment was designed to measure
the composition and energy spectra of
cosmic rays
approaching energies up to 1015 eV.
Since December 2004, four instruments were successfully flown on balloons
over Antarctica
where they collected
several million CR events in the elemental range from hydrogen to iron,
and with total particle energies
reaching the 100 TeV scale and above. The final goal of the experiment
is to provide a deeper understanding of the acceleration mechanism of cosmic rays
and to test the validity of the astrophysical models describing their propagation in the Galaxy [1].
In this paper, we present preliminary energy spectra of the
even-charged, abundant nuclei from carbon to iron as measured by the instrument during its second flight (CREAM-II).
2 The CREAM-II instrument
The instrument for the second flight included: a
redundant system for particle identification, consisting
(from top to bottom)
of a timing-charge detector (TCD), a
Cherenkov detector (CD), a pixelated silicon charge detector (SCD), and
a sampling imaging calorimeter (CAL) designed to provide a
measurement of the energy of primary nuclei in the multi-TeV region.
The TCD is comprised of two planes (120 120 cm2) of four 5 mm-thick plastic scintillator paddles,
read out by fast timing photomultiplier tubes (PMT). The CD is a 1 cm-thick plastic radiator, with 1 m2 surface area, read out by eight PMTs via wavelength shifting bars.
The SCD is a dual layer made of 312 silicon sensors, each segmented as an array of 44
pixels, which
covers an effective area of 0.52 m2 with no dead regions.
The CAL is a stack of 20 tungsten plates (5050 cm2,
each 1 X0 thick) with interleaved active layers
of
1 cm-wide scintillating fiber ribbons, read out by 40 hybrid photodiodes (HPD).
It is preceded by
a 0.47 -thick graphite target
to induce hadronic interactions of CR nuclei.
The second CREAM payload was launched on December 16th 2005 from McMurdo and
flew over Antarctica until January 13th 2006, at a
balloon float altitude between 35 and 40 km.
A detailed description of the instrument and its flight performance can be found in [2].
3 Data analysis
A data set collected in the period Dec. 19th- Jan. 12th, under stable instrument conditions,
was used in this analysis.
The first step of the procedure consists of selecting events with an accurate
trajectory reconstruction of the primary particle, and measuring its charge and energy.
The direction of the particle is given by the axis of the shower
reconstructed in the imaging calorimeter. This is obtained by a fit of the candidate
track points sampled along the longitudinal development of the shower.
On each CAL plane, they are
defined as the center of gravity of the cluster
formed by the cell with maximum signal and its two neighbours.
The fitted shower axis is back-projected to the target and its intersections
with the two SCD layers define the impact points
of the primary particle, with a spatial resolution better than 1 cm rms.
In each SCD plane, the pixel with the highest signal is located
inside a circle of confusion with a 3 cm radius
centered on the impact point.
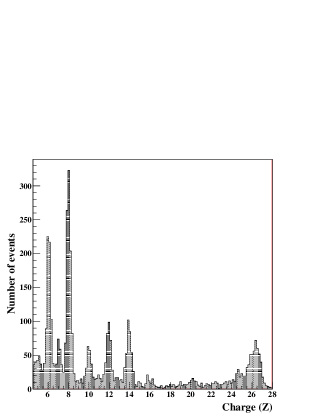
If the signals of the matched hits in the upper and lower SCD planes are consistent within 30%, they are selected as two independent samples of the specific ionization and corrected for the pathlength traversed by the particle in the silicon sensors. A charge is assigned to the particle by averaging the two measured values of the specific ionization and taking into account its dependence. The charge distribution reconstructed by the SCD is shown in figure 1; by fitting each peak to a gaussian, a charge resolution is estimated (in units of the electron charge ) as: 0.2 for C, N, O; 0.23 for Ne, Mg, Si; 0.5 for Fe. A 2 cut around the mean charge value is applied to select samples of each element, while for iron a 1 cut is used. In this way, 1288 O are retained, as well as 456 Si and 409 Fe candidates.
The total energy (), deposited in the calorimeter by an interacting nucleus, is measured by summing up the calibrated signals of its cells. In order to infer the primary particle energy from , an unfolding procedure is applied. In fact, due to the finite energy resolution of the detector, the measured counts in a given energy interval must be corrected for overlap with the neighbouring bins.

This can be done by inverting the matrix equation: where and are the “true” and measured counts in each energy bin, respectively. A generic element of the mixing matrix represents the probability that a CR particle, carrying an energy corresponding to a given energy bin j, produces an energy deposit in the calorimeter falling in the bin i. A detailed MonteCarlo (MC) simulation of the instrument, based on the FLUKA 2006.3b package [3], was developed to estimate the unfolding matrix. Sets of nuclei, generated isotropically and with energies chosen according to a power-law spectrum, are analyzed with the same procedure as that used for the flight data. Each matrix element is calculated by correlating the generated spectrum with the distribution of the deposited energy in the calorimeter [4]. In order to get a reliable set of values of the unfolding matrix for each nucleus, the MC simulation is finely tuned to reproduce both flight data and the calibration data collected with accelerated particle beams [5]. The agreement of the MC description with the real instrument behaviour was carefully checked. As an example, in figure 2 the response of the calorimeter to carbon nuclei from the flight data is compared with an equivalent set of simulated events.
4 Energy spectrum
The interval of energy spanned by the measured CR events is divided into bins of width , larger than the energy resolution of the calorimeter and centered at values (calculated according to the definition of [6]). For each element, the “true” number of counts in each bin is obtained as a result of the unfolding algorithm. The absolute differential intensity at an energy is calculated according to the formula
where T is the exposure time, the efficiency of the selection cuts, the geometric factor
of the instrument, and TOI and TOA are, respectively, the corrections to the top of instrument
and to the top of the atmosphere.
The geometric factor is estimated from MC simulations
by counting the fraction of generated particles
entering the upper SCD plane and crossing the upper CAL plane. A value of 0.46 m2sr is found.
During the flight, the live time T
was measured by
the housekeeping system onboard. The selected set of data amounts to a live time of
16 days and 19 hours, close to 75% of the real time of data taking.
The overall efficiency is estimated from MC simulations;
it has a constant value of around 70% at energies
3 TeV for all nuclei.
The probability that a nucleus undergoes a spallation reaction in the
amount of material ( 4.8 g/cm2) above
the upper SCD plane is also estimated from MC simulations.
The fraction of surviving nuclei, i.e., the TOI correction,
spans from 81.3% for C to 61.9% for Fe.
The TOA correction is calculated by simulating with FLUKA the atmospheric
overburden
during the flight (3.9 g/cm2 on average).
Survival probabilities
ranging from 84.2% for C to 71.6% for Fe are found.
5 Results
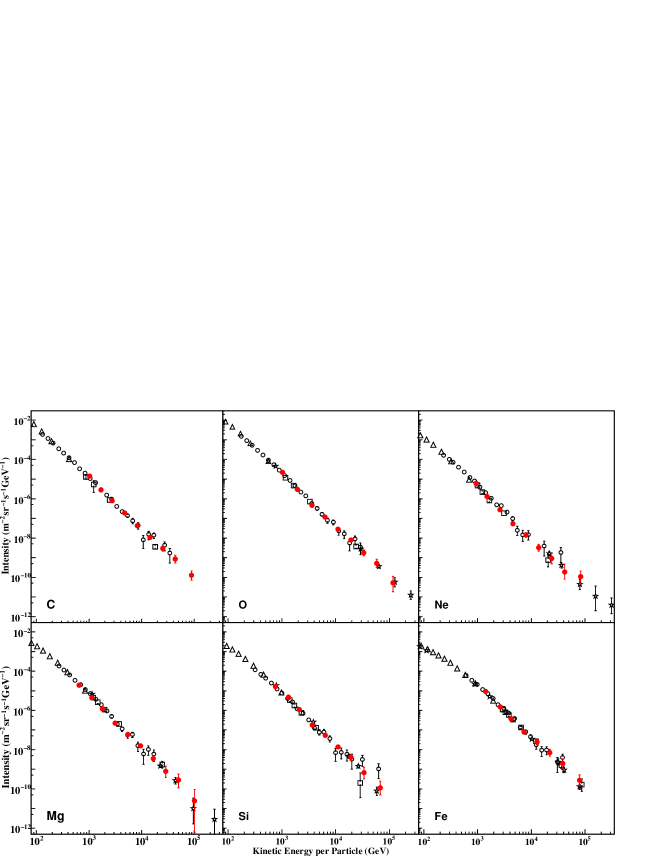
The preliminary energy spectra of C, O, Ne, Mg, Si and Fe measured by CREAM-II are shown in figure 3. Only statistical errors are reported, a detailed study of the systematic uncertainties being underway. Absolute particle intensities are presented without any arbitrary normalization to previous data. The particle energy range extends from around 800 GeV up to 100 TeV. CREAM-II data are found in general to be in good agreement with measurements of previous balloon-borne and satellite experiments [7, 8, 9, 10]. Though still preliminary, they seem to suggest that the intensities of the more abundant heavy elements have a very similar energy dependence. A more refined analysis, including an assessment of the systematics, is still in progress.
6 Conclusion
The CREAM-II instrument carried out measurements of high-Z cosmic-ray nuclei with an excellent charge resolution and a reliable determination of their energy. Energy spectra of the more abundant heavy nuclei are measured and found to agree well with other direct measurements.
References
- [1] E.S. Seo et al., Adv. Sp. Res. 33(10) (2004) 1777
- [2] P.S. Marrocchesi et al., Adv. Sp. Res. 41 (2008) 2002
- [3] A. Fassò et al., CERN-2005-10 (2005), INFN/TC_05/11, SLAC-R-773
- [4] R. Zei et al., Proc. of 30th ICRC 2 (2008) 23
- [5] H.S. Ahn et al., Nucl. Phys. B (Proc. Suppl.) 150 (2006) 272
- [6] G.D. Lafferty and T.T. Wyatt, Nucl. Instr. and Meth. A355 (1995) 541
- [7] J.J. Engelmann et al., A&A 233 (1990) 96
- [8] D. Müller et al., ApJ 374 (1991) 356
- [9] A.D. Panov et al., Adv. Sp. Res. 37 (2006) 1944
- [10] M. Ave et al., ApJ 678(1) (2008) 262