The low-density/high-density liquid phase transition for model globular proteins
Abstract
The effect of molecule size (excluded volume) and the range of interaction on the surface tension, phase diagram and nucleation properties of a model globular protein is investigated using a combinations of Monte Carlo simulations and finite temperature classical Density Functional Theory calculations. We use a parametrized potential that can vary smoothly from the standard Lennard-Jones interaction characteristic of simple fluids, to the ten Wolde-Frenkel model for the effective interaction of globular proteins in solution. We find that the large excluded volume characteristic of large macromolecules such as proteins is the dominant effect in determining the liquid-vapor surface tension and nucleation properties. The variation of the range of the potential only appears important in the case of small excluded volumes such as for simple fluids. The DFT calculations are then used to study homogeneous nucleation of the high-density phase from the low-density phase including the nucleation barriers, nucleation pathways and the rate. It is found that the nucleation barriers are typically only a few and that the nucleation rates substantially higher than would be predicted by Classical Nucleation Theory.
Microgravity, Université Libre de Bruxelles] Microgravity Research Center, Chimie Physique E.P. CP 165/62, Université Libre de Bruxelles, Av.F.D.Roosevelt 50, 1050 Brussels, Belgium. \alsoaffiliation[CENOLI, Université Libre de Bruxelles] Center for Nonlinear Phenomena and Complex Systems CP 231, Université Libre de Bruxelles, Blvd. du Triomphe, 1050 Brussels, Belgium Université Libre de Bruxelles] Center for Nonlinear Phenomena and Complex Systems CP 231, Université Libre de Bruxelles, Blvd. du Triomphe, 1050 Brussels, Belgium
1 Introduction
One of the most important problems in biophysics is the characterization of the structure of proteins. It is well-known that the main impediment to the determination of protein structure is the difficulty with which good quality protein crystals can be produced. This has led to a large body of work focused on the understanding the details of protein nucleation. In recent years, it has become apparent as a result of simulation, theoretical and experimental studies that nucleation in general, and protein nucleation in particular, is strongly affected by the presence of intermediate, metastable states1, 2, 3, 4, 5. This raises the possibility that by understanding the mechanism by which intermediate states affect nucleation, the quality of the final result can be better controlled.
The practical importance of investigating the role of intermediate metastable states lies in the fact that the effective interactions of proteins in solution depend on their environment. Protein molecules interact via Coulombic forces mediated by the ionic solution in which they are dissolved. The effective interaction between two protein molecules therefore depends on the properties of the solution, particularly the salt used to create the solution and its pH. This is the reason for the well-known fact that some salts are more effective than others in precipitating protein crystallization (the Hofmeister effect)6. Detailed confirmation of the connection between the properties of the solution and the effective intra-protein interactions has come from both computer simulation7, 8 and from theoretical studies of the phase diagram of proteins in solution9. One goal of the present work is to investigate what aspect of the effective interactions is most relevant in controlling the nucleation of the metastable phase.
Assuming that the effects of the solvent can, at first approximation, be entirely accounted for by an effective interaction potential between protein molecules, the problem of protein nucleation can be viewed as analogous to the nucleation of a solid from a dilute gas. In this way, Wilson observed that favorable conditions for protein nucleation are correlated with the behavior of the osmotic virial coefficient10. Rosenbaum, et al. showed that the phase diagram of a large class of globular proteins can be mapped onto that of simple liquids with an interaction potential that depends on the ionic strength of the solvent 11, 12. One particular characteristic of proteins is that these models involve a hard-core repulsion and an attractive tail with the range of the attraction being quite small compared to the size of the hard core. It is known that as the range of the attraction becomes smaller, the critical point of the liquid-vapor transition is suppressed relative to the triple point until for sufficiently short-ranged potentials, the liquid-vapor transition becomes metastable with respect to the vapor-solid transition 5. It is in this circumstance that the meta-stable liquid phase is thought to play an important role in protein nucleation.
Despite the abundance of evidence for the role of the intermediate state from both simulation and experiment, there is still no really convincing theoretical description based on first-principles. Lutsko and Nicolis showed that transitions from vapor to metastable liquid to solid appeared advantageous relative to the direct vapor-solid transition based on the bulk free energy surface13, but that work neglected the effect of interfaces and, in particular, surface tension. The goal of the present work is to take a step towards filling in this gap by characterizing the liquid-vapor interfacial surface tension and the liquid-vapor transition in a model globular protein consisting of molecules interacting with the ten Wolde-Frenkel potential2. However, because of the metastable nature of the transition, such a characterization based on simulation is difficult. We found it impossible to stabilize the liquid-vapor interface for the model protein due to the strong tendency towards crystallization. We have therefore had to use an indirect approach consisting of a combination of theory and simulation. First, the ten Wolde-Frenkel model potential for globular proteins is generalized so that it depends on three independent parameters that allow it to be deformed continuously from a Lennard-Jones potential, i.e. a simple fluid, to the hard-core+tail ten Wolde-Frenkel (tWF) potential. We have performed simulations covering part of the range from simple fluid to protein and compare this to Density Functional Theory calculations to show that the DFT remains quantitatively accurate as the hard-core radius is increased from zero, in the LJ potential, to a typical value in the tWF potential and as the range of attraction decreases. Whereas simulation becomes infeasible when the range becomes too short, the calculations are easily performed and the preceding agreement gives some confidence in the result. The DFT is then used to calculate the nucleation barrier using recently developed energy surface techniques. We find, somewhat surprisingly, that the increase in the hard-core radius is much more important than the decrease in the range of the potential and is mostly responsible for a dramatic drop in surface tension. This observation is particularly relevant in the case of proteins since the properties of the effective interaction can be varied by changing controllable parameters, such as the PH of the solution, so that a primary goal is to determine those conditions most favorable to homogeneous nucleation. Our results indicate that, so far as the low-density/high-density part of the transition is concerned, varying the range of the potential has little effect.
In the next Section, our model potential is defined and the Monte Carlo simulations described and the DFT calculations are also sketched. In Section III, we describe the comparison between theory and simulation as the potential is varied from Lennard-Jones towards the model protein interaction and show quantitative agreement between theory and simulation. We then present the DFT results for the surface tension and nucleation barrier and nucleation rate as calculated from DFT and compare to classical nucleation theory. The paper concludes with a discussion of our results.
2 Theoretical Methods
2.1 Simulation
Because of the complexity of the constituent particles and of the solvent-induced interaction globular proteins are often modeled, in a first approximation, by an effective interaction potential. In their study of the phase behavior of globular proteins in solution ten Wolde and Frenkel proposed the following effective potential 2
| (1) |
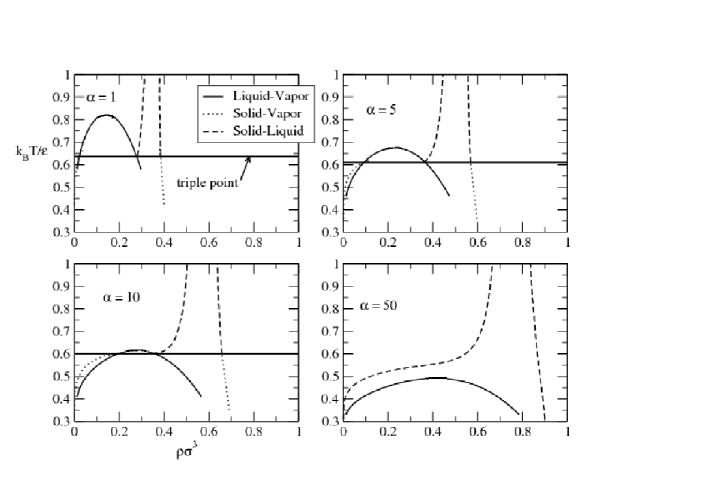
This is a Lennard-Jones potential modified to capture the essential features that characterize the interaction of proteins in solution. The potential includes a hard-sphere repulsion at that accounts for the excluded volume, i.e. the size, of the protein molecule. The parameter controls the range of solvent induced effective attraction in that the minimum of the potential well occurs at while the minimum of the potential is , independent of the value of the range. The range of the potential decreases when increases and for this model potential reproduces the phase behavior of globular protein solutions and with in particular the well known fact that for sufficiently short range attractions the liquid phase becomes thermodynamically unstable2, 5, as illustrated in 1. For the potential (1) this behavior is expected to be found when in accordance with the generally accepted criteria according to which the range of the attraction should be of the range of the repulsive part to have a metastable liquid-gas coexistence5.
Metastable systems are notoriously difficult to study numerically because the liquid state spontaneously decays to the more stable crystal phase. In the present situation, the value puts the liquid-gas coexistence curve deep inside the unstable region which makes the liquid phase difficult to maintain. A possible solution to this problem is to use constraints that restrict the configurational space of the system thereby preventing the transition to the solid phase. There are different ways to constrain the system 14. In the restricted Monte Carlo method 15 the density is constrained to be below a limited value which thus suppresses the dense phase. While this approach is well suited to the study of the supersaturated vapor phase it is not appropriate for studying supercooled liquids because the densities of the liquid and solid phases are too close. Another possibility would be to limit the number of neighbors per particle. This approach has been applied with success to a Lennard-Jones potential. However there is a body of evidence that besides its effect on the stability of liquids, the range of the attractive potential impacts also on the structure of the liquid 16. This fact could be of special importance in the present case because the structure of the liquid is atypical due to the large excluded volume which limits the number of interactions per particle. More generally the shortcomings of restricted ensemble methods is the elimination of many configurations.
In this work no constraints were imposed on the system. Stable liquid-gas equilibrium were obtained starting from a stable two-phase state and modifying step by step the temperature and the parameter until the desired conditions are met. Unfortunately for the desired case of this was not possible because there is no stable configuration to start from. We therefore generalized the potential as
| (2) |
with a hard core at , so that, by varying the dimensionless parameters and , it is possible to smoothly go from a simple fluid, described by the Lennard-Jones interaction with and to the model protein interaction with and . This allows to reach a metastable liquid-gas coexistence from a stable Lennard-Jones system by varying in small steps the temperature and the parameters and .
We simulated an ensemble of particles interacting via the potential (2) with a standard Metropolis Monte-Carlo algorithm (MC-NVT)17. The potential is truncated at but not shifted. The particles are contained in a volume with dimensions , and and periodic boundary conditions are imposed in all directions. To avoid the problem of stability of the liquid phase, the system is equilibrated during Monte-Carlo cycles (one cycle updates) at given (, , ) starting from a stable initial configuration at (, , ). The configuration of the system consists in a liquid slab of thickness surrounded along the z-direction by two gas slabs. In this way the stability of the liquid phase was maintained during the cycles used to measure the density profile and the surface tension.
Surface tension can be measured by different methods. In a recent paper we adopted the Bennett method as this method appears to be precise 18. However we found it difficult to implement here for the following reason. In the Bennett’s method the calculation of the surface tension follows from the definition
| (3) |
where is the free energy and is the area of each liquid-vapor interface. In its implementation the method requires that one compares the energies () of two configurations with different liquid-vapor interface areas and . The configuration with interface area is obtained from the previous one by rescaling the positions of the particles 1917:
| (4) |
Because this perturbation is done at constant volume, the system is expanded along one direction and compressed along the transverse direction. Due to the isotropy of the fluid phase this transformation has only a negligible effect on the energy of homogeneous systems because the energy change created by the displacement along the compression direction is compensated by an energy change along the expansion direction. In the presence of an interface the symmetry is lost and there is a net energy difference between the two configurations which is localized at the liquid-vapor interface. While the perturbation (2.1) is usually an efficient way to probe the interfacial free-energy we found it to be unsuitable here as the surface tension of the protein model is particularly small so that large perturbations are necessary to have a measurable free energy difference. Unfortunately large perturbations are inefficient when applied to systems whose potential contains an excluded volume because the compression step creates configurations with overlaps between particles. This not only gives infinite energy variation but these variations are often located inside the liquid phase and not at the interface. To solve this problem we implemented the interface wandering approach which allows a precise evaluation free-energy difference with small area perturbations20. In this method the system is perturbed at each Monte Carlo cycle according to (2.1). Contrary to the Bennett’s method where the new configuration is only tested, in the interface wandering method the new area, chosen at random in an interval , is effectively accepted with probability
| (5) |
As a result of this acceptance ratio, the area of the interface evolves and is distributed between and according to a distribution , which is related to the free energy
| (6) |
Because in this method many areas are sampled, instead of one in the Bennett’s method, a curve fitting can be performed on the interface area distribution function which allows a precise determination of the surface tension.
2.2 DFT calculations
The properties of inhomogeneous systems were calculated using Density Functional Theory. According to DFT, the free energy in the grand canonical ensemble, the grand potential , is a functional of the local density, , and the applied external field, , of the form
| (7) |
where is the chemical potential, and both depend on temperature and the functional does not depend on the field21, 22. The equilibrium density distribution is determined by minimizing . In a uniform system, the local density is a constant, and is the Helmholtz free energy.
In our calculations, is approximated using the Modified-Core van der Waals DFT model23. This is a generalization of the simplest hard-sphere plus mean-field tail model which gives quantitatively accurate descriptions of fluid structure23, surface tension23, 18 and nucleation properties24. Here, we require quantitative accuracy in the DFT calculations as we wish to make direct comparison to simulation. In this model, the free energy is expressed as a sum of three contributions:
| (8) |
The first term on the right is the hard-sphere contribution which is treated using the Fundamental Measure Theory functional. The second term is the ”core correction” which is similar in form to the hard-sphere term, but which modifies the hard-sphere contribution so that the free energy in the bulk phase reproduces a given equation of state23. The last term is the tail contribution and has the simple mean field form
| (9) |
The reference hard-sphere diameter, , is calculated using the Barker-Henderson25, 22 expression,
| (10) |
where is the distance at which the potential vanishes, .
3 Results
3.1 Surface Tension
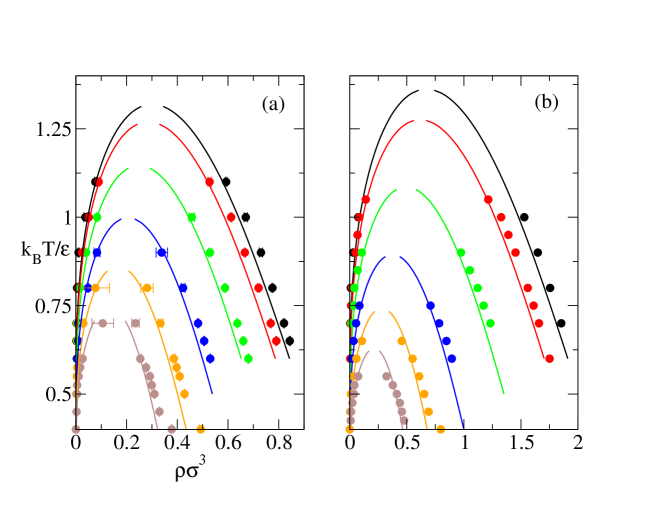
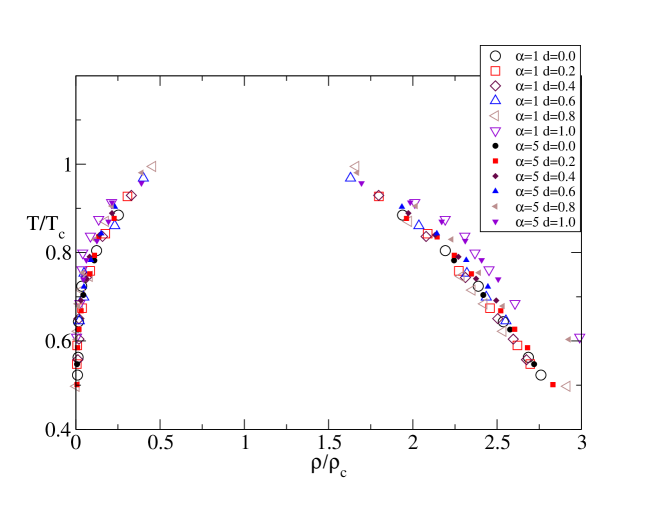
2 shows the phase diagrams obtained from the simulations as described above and as predicted using the thermodynamic perturbation theory for the cases of and . Away from the critical point, the agreement between theory and simulation is satisfactory over a wide range of hard-core radii. As is usual for a mean-field theory, the agreement near the critical point is not expected to be very good and this region has therefore not been studied. The critical density and temperature for each system was estimated following the procedure in Ref.18 and are given in 1 and 2. The coexistence curves are shown in 3 with the density and temperature scaled to the critical density and critical temperature respectively. Although the generalized potential involves two length scales, controlling the position of the minimum and the hard-sphere radius , the coexistence curves show typical corresponding-states as has been seen for other multi-length scale potentials18.
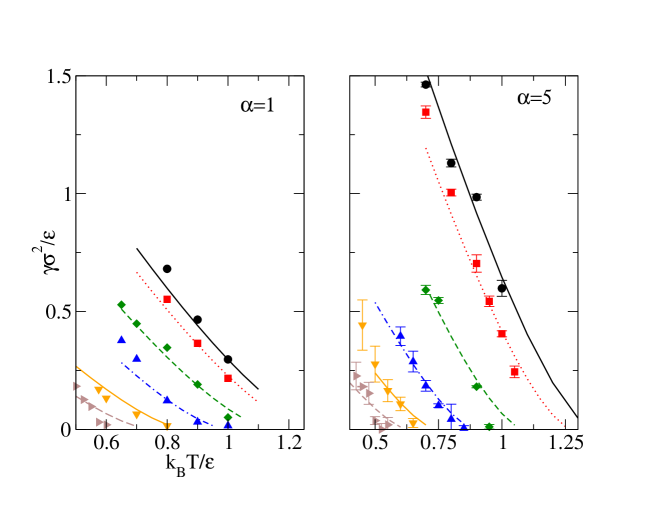
A comparison between the surface tension as determined by simulation and from DFT calculations is shown in 4. Increasing the size of the molecule, i.e. the excluded volume parameter , at fixed leads to lower surface tension: since the surface tension scales, roughly, with the critical temperature, see 1, this trend is attributable to the decrease of the critical temperature with increasing which, in turn, is due to the increase with of the range of repulsion (which extends from to ) compared to the range of the attractive part of the potential (and taking into account that the depth of the potential is fixed). On the other hand, for fixed , increasing has little effect for but leads to a significant increase in the surface tension for . In the latter case, the potential can be written as a function of the single parameter so that one expects the surface tension in this case to vary as . (Note that in fact this scaling is somewhat spoiled by the fact that the cutoff used in the simulations was not scaled in the same way, so this should only be taken as an explanation for the general trends.) In the former case of , the effect of changing is mitigated by the relatively large (and fixed) effect of the excluded volume and, of course, the fixed depth of the potential minimum.
Since the surface tension goes to zero at the critical point and, as discussed above, the perturbative equation of state is least accurate near the critical point, it is not surprising that the relative accuracy of the theoretical calculations decreases as one approaches the critical point. Away from this region, however, the theoretical calculations are in good, nearly quantitative agreement with the simulations. Based on this comparison, the extension of the calculations to higher values of seems justified.
1 and 2 also show the result of a fit to the expected form . Fitting both and and comparing to the critical temperature extracted from the coexistence data gives a consistency check on the analysis. In general, the temperatures derived by both methods are in reasonable agreement. The errors in the critical density are too large to permit us to make a definitive statement concerning whether or not the surface tensions obey a law of corresponding states.
| d | (coex) | (coex) | ||
|---|---|---|---|---|
| 0.0 | 1.21 | 2.15 | 1.24 | 0.31 |
| 0.2 | 1.15 | 2.30 | 1.19 | 0.29 |
| 0.2 | 1.18 | 1.95 | 1.19 | 0.29 |
| 0.4 | 1.09 | 1.55 | 1.08 | 0.25 |
| 0.4 | 1.06 | 1.95 | 1.08 | 0.25 |
| 0.6 | 0.92 | 1.87 | 0.93 | 0.21 |
| 0.8 | 0.80 | 1.68 | 0.80 | 0.17 |
| 1.0 | 0.61 | 2.52 | 0.66 | 0.15 |
| d | (coex) | (coex) | ||
|---|---|---|---|---|
| 0.0 | 1.33 | 2.83 | 1.28 | 0.68 |
| 0.2 | 1.18 | 3.53 | 1.20 | 0.62 |
| 0.4 | 0.99 | 2.96 | 1.01 | 0.49 |
| 0.6 | 0.85 | 2.09 | 0.83 | 0.37 |
| 0.8 | 0.66 | 2.63 | 0.66 | 0.27 |
| 1.0 | 0.54 | 3.06 | 0.57 | 0.19 |
3.2 Nucleation of globular proteins
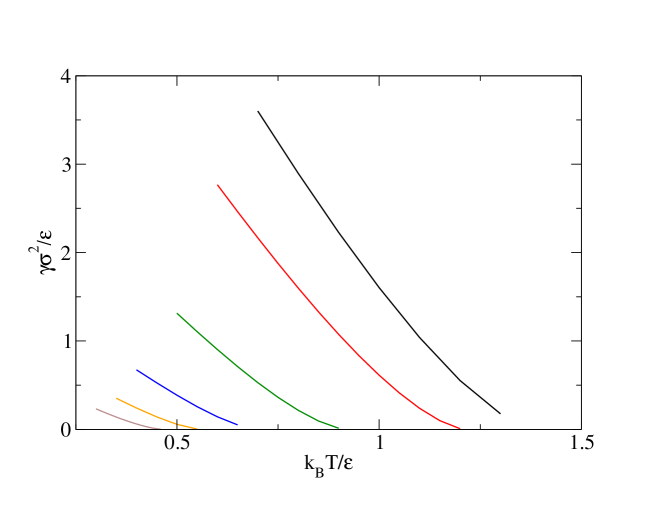
Globular proteins are modeled using and so that the liquid is metastable as shown in 1. As discussed above, this makes simulation extremely difficult so that we only present the results of calculations using DFT. Indeed, the fact that the metastable phase immediately tends to nucleate the solid phase in simulation is one of the main reasons for focusing on the nucleation of the metastable phase as this appears to be the rate-limiting step. The agreement found above between DFT and simulation for lower values of suggests that these results should be reasonable quantitative estimates. 5 shows the surface tension as a function of temperature for different values of the hard core radius. The trends noted earlier are repeated with the surface tension for being approximately times than for while the values of are comparable to those for lower values of .
The liquid-vapor transition is of particular interest as the metastable liquid phase is thought to play a key role in the process of precipitation of solid protein crystals from solution1, 2, 5. In classical nucleation theory (CNT) a liquid droplet is treated in the capillary approximation so that a droplet of radius has excess free energy
| (12) |
where , ) is the bulk Helmholtz free energy per unit volume of the fluid at density , is the chemical potential, is the liquid-vapor surface tension at coexistence and and are the densities of the coexisting liquid and vapor respectively. In this model, the excess number of molecules in the droplet is
| (13) |
The free energy has a maximum at the critical radius, , with , and a maximum, defining the barrier for nucleation, of . Thus, from these simple considerations and the previously noted trends in the surface tension, we conclude that if all of the energy scales are proportional to , then the nucleation barrier will decrease with increasing molecular size () and will vary weakly with the range of the potential, .
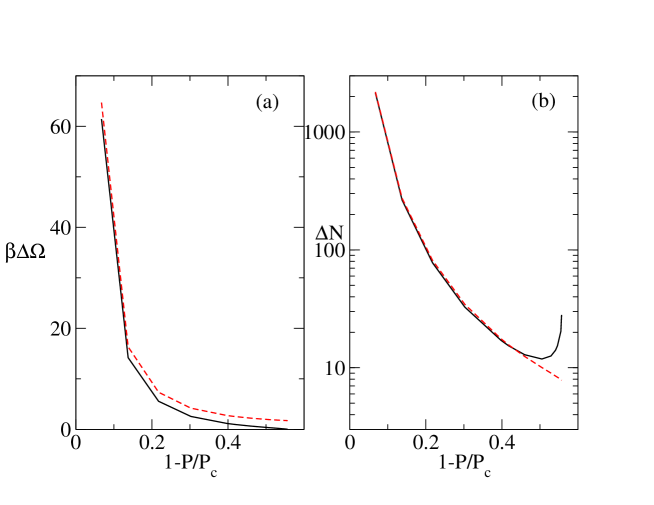
To investigate the liquid-vapor transition in more detail, we have determined the nucleation pathway (specifically, the minimum free energy path or MFEP) for nucleation of liquid droplets from the DFT to compare to the predictions of CNT for or . The method of calculation is the same as described in detail in Refs.26, 24. The goal is to identify a path between the initial state (pure vapor) and the final state (pure liquid) which is minimal with respect to variations perpendicular to the path (for a detailed explanation, see e.g. 27). 6 shows the free energy barrier and the size of the critical cluster as a function of supersaturation, where the chemical potential at coexistence is and the densities of the coexisting phases are and . (Note that although the actual control variable in our calculations in the grand canonical ensemble is chemical potential, we use the more familiar definition of supersaturation in terms of the pressure.) 6 shows that classical nucleation theory is in agreement with DFT for small supersaturations but for large supersaturation, the nucleation barrier calculated with DFT becomes very small, approaching zero as the vapor density approaches the spinodal, whereas CNT predicts a finite nucleation barrier at all densities. The figure also shows that the excess number of molecules in the critical cluster is also well described by CNT except at large supersaturations.
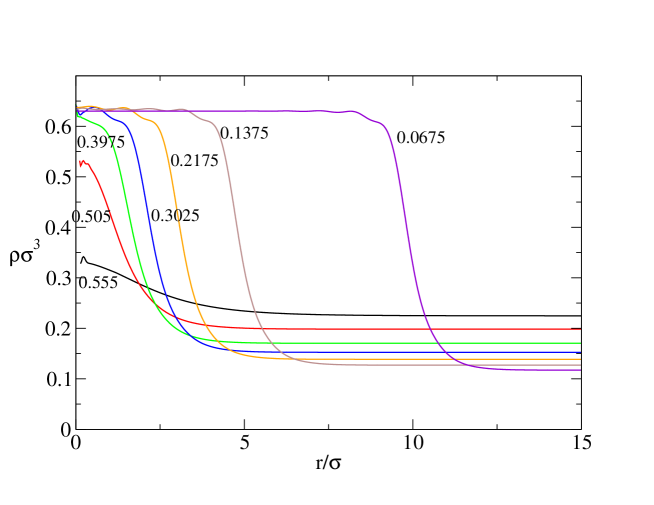
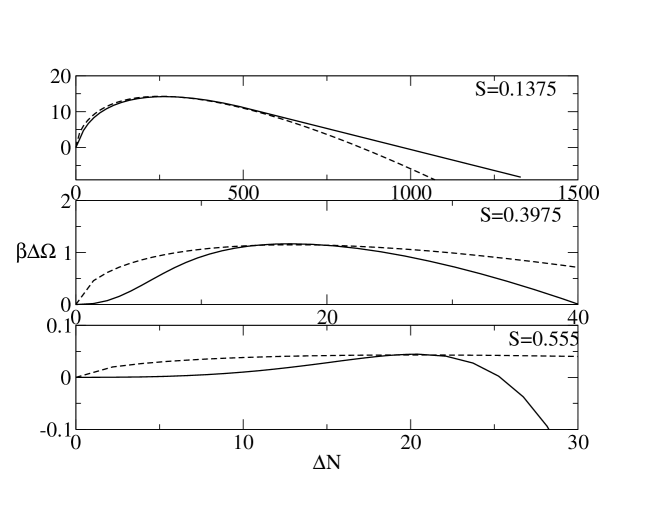
7, showing the critical clusters at different supersaturations, illustrates the reason for the failure of CNT at large supersaturation. It shows that large clusters are indeed well described with the capillary model, having very narrow interfaces. However, at large supersaturation, the critical clusters are very small with most molecules affected by the interface and with central densities far below that of the bulk liquid. As a consequence, CNT fails to capture the very small barriers for nucleation. This final point is illustrated in 8 which shows the nucleation pathway, i.e. the excess free energy as a function of cluster size, for three different supersaturations. At the smallest supersaturation, the barrier is well described by CNT. However, at large supersaturation, the shape of the nucleation barrier varies markedly from that assumed in CNT. In particular, there is virtually no free energy penalty for the formation of small clusters.
Given that we have access to the nucleation pathway, and not just the critical cluster, it is possible to directly evaluate the nucleation rate. Under the assumption of stationary nucleation and of treating the number of molecules as a continuous variable, the nucleation rate is given by the otherwise exact expression
| (14) |
where is the monomer attachment rate for a cluster of size and is the equilibrium distribution of cluster sizes.28, 29, 30. The monomer attachment rate is assumed to be proportional to the surface area of a cluster and to the gas pressure, with where is the sticking probability for a monomer that collides with a cluster of size (assumed here to be independent of ), is a geometric factor and and are the mass and volume of a molecule so that the area of the cluster is 30. 9 shows the calculated nucleation rate as a function of the supersaturation. The nucleation rate estimated from DFT is significantly higher than that estimated from CNT, partly due to the exponential amplification of the differences in barrier height seen in 6 and partly due to the differences in shape of the barrier.
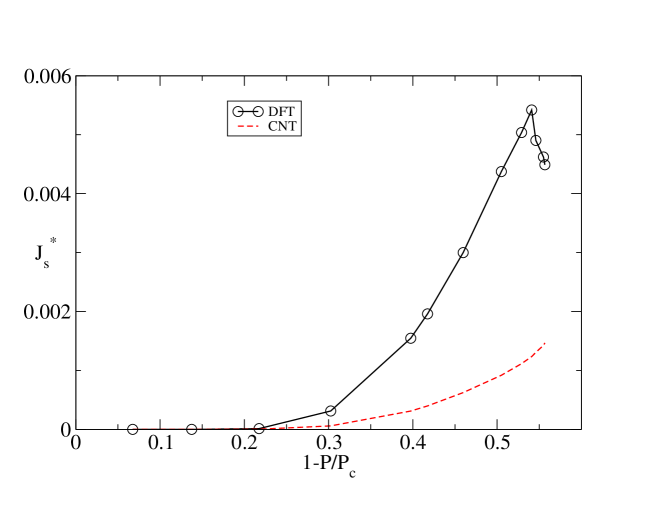
6 and 9 both show non-monotonic behavior near the spinodal. In the later case, the implication is that there is an optimal supersaturation that gives the maximal nucleation rate. However, this is likely to be an artifact of the calculations. As discussed in detail by Wilemski and Li31, mean field models such as that used here, and simpler models such as the square gradient model, predict a divergent critical nucleus size at the spinodal due to the the unrealistic mean-field equation of state. In any case, since the nucleation barrier is on the order of for , it is likely that the process of nucleation at higher supersaturations shares features of both nucleation and spinodal decomposition sometimes termed “spinodal nucleation”32, 31 in which case the nucleation characteristics (rate and critical nucleus) would not be described by the simple theory given here. There are, therefore, two issues affecting the interpretation of these results. The first is the validity of mean field theory, which definitely breaks down near the spinodal32, 31 and the second is that even if the maximum occurred in the region of validity of the theory, it would be masked by density fluctuations that would cause small volumes to become unstable with respect to spinodal decomposition.
4 Conclusions
In this paper, we have constructed a pair potential that allows us to move smoothly from a simple fluid (i.e. Lennard-Jones interaction) to the short-ranged, “hard Lennard-Jones” used as a model for globular protein interactions. The potential depends on two parameters: the size of the molecule, characterized by the excluded volume parameter , and the range of the potential, controlled by the dimensionless parameter . We compared the liquid-vapor surface tension as determined from Monte Carlo simulations to DFT calculations for the case and molecular radius ranging from zero to one (in Lennard-Jones units). Our results indicate that the combination of thermodynamic perturbation theory and the MC-VDW DFT model give a good quantitative description of the liquid-vapor equation of state and surface tension over a wide range of temperatures. Significant differences do appear as expected near the critical point since the mean-field equation of state is not accurate in this region. Our primary conclusion from these calculations is that it is the increase in excluded volume rather than the decrease in range of the potential that causes a dramatic decrease in the surface tension. In fact, from 4 and 5, one sees that while the surface tension for zero hard-core radius is strongly affected by the range of the potential, the surface tension at the largest excluded volume is relatively insensitive to the range.
For fixed , changing changes the range of the potential. However, the model potential can in fact be rewritten in terms of a single dimensioness parameter, so that in absence of a cutoff, changing and changing are in some sense equivalent. The actual physical relevance of the two parameters is that controls the size of the exluded volume while controls the strength of the attractive interaction. Hence, one way to phrase our results is that changing the excluded volume has much more effect on physical properties, such as surface tension, than does changing the strength of the attraction. These results suggest that increasing the excluded volume of a molecule leads to a decrease in surface tension and hence of the barrier to nucleation of the dense phase. Conformational changes can in fact be affected in some cases by changes in pH33, 34, 35 and by light36 thus suggesting a means for taking advantage of this phenomena to control crystallization rates in such systems.
For the case , we were not able to simulate the liquid-vapor interface due to the strong instability of the system to crystallization. Our theoretical calculations indicate similar behavior in the surface tension as found for smaller values of . We have also calculated the nucleation pathway and thereby determined the barrier and rate of nucleation of liquid droplets from the vapor. We found quite low barriers, less than even at relatively low supersaturation. Away from the spinodal, Classical Nucleation Theory gives a good description of the barrier height and the size of the critical nucleus. At higher supersaturations, as the spinodal is approached, the nucleation pathway calculated from DFT differs significantly from that predicted by CNT. DFT also predicts a vanishing nucleation barrier at the spinodal and non-monotonic behavior of the size of the critical nucleus and the nucleation rate near the spinodal. The shape of the barriers suggests that the excess free energy of small, sub-critical clusters is very small indicating that they might have relatively long lifetimes. However, the details of this picture become increasingly uncertain near the spinodal due to the limitations of mean field theory and in any case may not be observable as they occur in the region of “spinodal nucleation”.
Our work has benefited from several discussions with Dominique Maes at the Flanders Interuniversity Institute for Biotechnology (VIB),Vrije Universiteit Brussel. This work was supported by the European Space Agency under contract number ESA AO-2004-070 and by the projet ARCHIMEDES of the Communauté Française de Belgique (ARC 2004-09).
References
- Vekilov 2004 Vekilov, P. G. Crys. Growth and Design 2004, 4, 671
- ten Wolde and Frenkel 1997 ten Wolde, P. R.; Frenkel, D. Science 1997, 77, 1975
- Nicolis and Nicolis 2005 Nicolis, G.; Nicolis, C. Physica A 2005, 351, 22
- Shiryayev and Gunton 2004 Shiryayev, A.; Gunton, J. D. J. Chem. Phys. 2004, 120, 8318
- Lutsko and Nicolis 2005 Lutsko, J. F.; Nicolis, G. J. Chem. Phys. 2005, 122, 244907
- Zhang and Cremer 2006 Zhang, Y.; Cremer, P. S. Curr Opin Chem Biol. 2006, 10, 658–663
- Lund et al. 2008 Lund, M.; Jungwirth, P.; Woodward, C. E. Phys. Rev. Lett. 2008, 100, 258105
- Boroudjerdi et al. 2005 Boroudjerdi, H.; Kim, Y.-W.; Naji, A.; Netz, R. R.; Schlagberger, X.; Serr, A. Physics Reports 2005, 416, 129–199
- Shiryayev et al. 2005 Shiryayev, A.; Pagan, D. L.; Gunton, J. D.; Rhen, D. S.; Saxena, A.; Lookman, T. J. Chem. Phys. 2005, 122, 234911
- George and Wilson 1994 George, A.; Wilson, W. W. Acta Cryst. D 1994, 50, 361
- Rosenbaum and Zukoski 1996 Rosenbaum, D. F.; Zukoski, C. F. J. Cryst. Growth 1996, 169, 752
- Rosenbaum et al. 1996 Rosenbaum, D. F.; Zamora, P. C.; Zukoski, C. F. Phys. Rev. Lett. 1996, 76, 150
- Lutsko and Nicolis 2006 Lutsko, J. F.; Nicolis, G. Phys. Rev. Lett. 2006, 96, 046102
- Nie et al. 2007 Nie, C.; Geng, J.; Marlow, W. H. J.Chem.Phys. 2007, 127, 154505
- Corti and Debenedetti 1994 Corti, D. S.; Debenedetti, P. G. Chem. Eng. Sci. 1994, 49, 2717 – 2734
- Doye and Wales 1996 Doye, J. P. K.; Wales, D. J. J.Phys.B 1996, 29, 4859–4894
- Frenkel and Smit 2001 Frenkel, D.; Smit, B. Understanding Molecular Simulation; Academic Press, Inc.: Orlando, FL, USA, 2001
- Grosfils and Lutsko 2009 Grosfils, P.; Lutsko, J. F. J. Chem. Phys. 2009, 130, 054703
- Salomons and Mareschal 1991 Salomons, E.; Mareschal, M. J.Phys.: Condens. Matter 1991, 3, 3645–3661
- MacDowell and Bryk 2007 MacDowell, L. G.; Bryk, P. Phys. Rev. E 2007, 75, 061609
- Evans 1979 Evans, R. Adv. Phys. 1979, 28, 143
- Hansen and McDonald 1986 Hansen, J.-P.; McDonald, I. Theory of Simple Liquids; Academic Press: San Diego, Ca, 1986
- Lutsko 2008 Lutsko, J. F. J. Chem. Phys. 2008, 128, 184711
- Lutsko 2008 Lutsko, J. F. J. Chem. Phys. 2008, 129, 244501
- Barker and Henderson 1967 Barker, J. A.; Henderson, D. J. Chem. Phys. 1967, 47, 4714
- Lutsko 2008 Lutsko, J. F. Europhys.. Lett. 2008, 83, 46007
- Wales 2003 Wales, D. Energy Landscapes; Cambridge University Press: Cambridge, 2003
- Zeldovich 1942 Zeldovich, J. B. Zh. Eksper. Teor. Fiz. 1942, 12, 525
- Zeldovich 1943 Zeldovich, J. B. Acta Physiochim. URRS 1943, 18, 1
- Kashchiev 2000 Kashchiev, D. Nucleation : basic theory with applications; Butterworth-Heinemann: Oxford, 2000
- Wilemski and Li 2004 Wilemski, G.; Li, J.-S. J. Chem. Phys. 2004, 121, 7821
- Binder 1984 Binder, K. Phys. Rev. A 1984, 29, 341
- Wang et al. 1996 Wang, Y.; Sha, M.; Ren, W. Y.; van Heerden, A.; Browning, K. S.; Goss, D. J. Biochimica et Biophysica Acta (BBA) - Protein Structure and Molecular Enzymology 1996, 1297, 207 – 213
- Wojtasek and Leal 1999 Wojtasek, H.; Leal, W. S. J. of Biol. Chem. 1999, 274, 30950–30956
- Lee et al. 1992 Lee, J. M.; Kay, C. M.; Watts, T. H. Int Immunol. 1992, 4, 889–897
- Rhinow and Hampp 2008 Rhinow, D.; Hampp, N. A. J. Phys. Chem. B 2008, 112, 13116–13120