11email: k.kjaer@qub.ac.uk 22institutetext: ESO, Karl-Schwarzschild-Strasse 2, D–85748 Garching, Germany 33institutetext: Excellence Cluster Universe, Technische Universität München, Boltzmannstr. 2, Garching D-85748, Germany 44institutetext: Dept. of Astronomy, Stockholm University, AlbaNova, SE-106 91 Stockholm, Sweden 55institutetext: The Oskar Klein Centre, Stockholm University
The 3-D Structure of SN 1987A’s inner Ejecta††thanks: Based on observations collected at the European Southern Observatory, Chile (ESO Programme 076.D–0558)
Abstract
Context. Observing the inner ejecta of a supernova is possible only in a handful of nearby supernova remnants. The core-collapse explosion mechanism has been extensively explored in recent models and predict large asymmetries. SN 1987A is the first modern stellar explosion that has been continuously observed from its beginning to the supernova remnant phase. Twenty years after the explosion, we are now able to observe the three-dimensional spatially resolved inner ejecta of this supernova.
Aims. Detailed mapping of newly synthesised material and its radioactive decay daughter products sheds light on the explosion mechanism. This may reveal the geometry of the explosion and its connection to the equatorial ring and the outer rings around SN 1987A.
Methods. We have used integral field spectroscopy to image the supernova ejecta and the equatorial ring in the emission lines of [Si I] + [Fe II] ( 1.64 m) and He I ( 2.058 m). The spectral information can be mapped into a radial velocity image revealing the expansion of the ejecta both as projected onto the sky and perpendicular to the sky plane.
Results. The inner ejecta are spatially resolved in a North-South direction and are clearly asymmetric. Like the ring emission, the northern parts of the ejecta are blueshifted, while the material projected to the South of the supernova centre is moving away from us. We argue that the bulk of the ejecta is situated in the same plane as defined by the equatorial ring and does not form a bipolar structure as has been suggested. The exact shape of the ejecta is modelled and we find that an elongated triaxial ellipsoid fits the observations best. The velocity measured in the [Si I] + [Fe II] line corresponds to km s-1 and is the same as the width of the IR [Fe II] line profiles during the first years. From our spectral analyses of the ejecta spectrum we find that most of the He I, [Si I] and [Fe I-II] emission originates in the core material which has undergone explosive nucleosynthesis. The He I emission may be the result of -rich freeze-out if the positron energy is deposited locally.
Conclusions. Our observations clearly indicate a non-symmetric explosion mechanism for SN 1987A. The elongation and velocity asymmetries point towards a large-scale spatial non-spherical distribution as predicted in recent explosion models. The orientation of the ejecta in the plane of the equatorial ring argues against a jet-induced explosion through the poles due to stellar rotation.
Key Words.:
supernovae: individual: SN 1987A - ejecta - explosions1 Introduction
Numerical simulations of the core collapse and explosion of massive stars have shown that, except for progenitors with mass (Kitaura et al. 2006), a one dimensional spherically symmetric collapse does not produce a successful explosion (e.g., Buras et al. 2006; Burrows et al. 2007; Dessart et al. 2006). During the last 5-10 years it has, however, become clear that there are several effects giving rise to different kinds of multidimensional instabilities and convective motions. The first of these is the convective motion behind the stalling shock, induced by the neutrino heating from the proto-neutron star (Bethe & Wilson 1985). More recently it has been realised that a large scale instability, usually known as the standing accretion shock instability (SASI; Blondin & Mezzacappa 2006), is a generic feature of the core collapse process, with most of the power in the mode (Blondin et al. 2003). Several groups have obtained successful explosions by including these multidimensional effects, although it is too early to draw any definite conclusions with regard to e.g., the energy of the explosion and the range of progenitors.
With this background it is therefore highly interesting to seek as much observational information about the geometry, kinematics and abundance structure of the ejecta as possible. There are in the case of Cas A several indications of large scale mixing and instabilities, both from the morphology and the elemental abundance distribution (e.g., Reed et al. 1995; Wheeler et al. 2008). It is, however, likely that Cas A was a Type IIb SN (Krause et al. 2008), with only a small amount of hydrogen left, which influences the instabilities and the general dynamic structure of the ejecta. In this paper we discuss recent observations of SN 1987A, showing the spatial distribution of the inner ejecta still powered by radioactive decays. This is the first time that it is possible to spatially observe the evolution of the innermost ejecta as it emerges from the explosion.
SN 1987A is unique in being a very recent explosion, where we have been able to follow the evolution of the SN from the explosion for more than 20 years. The fact that we know the mass of the progenitor to be around (Woosley et al. 2002) is particularly important. We have also accurate estimates of the different isotopic masses, as well as masses of the most abundant elements (e.g. Fransson & Kozma 2002). From the light curve, emergence of X-rays and line profiles there were many indications of mixing in the ejecta (e.g. Arnett et al. 1989; McCray 1993). Direct evidence for large scale instabilities came from HST observations, which have resolved the ejecta, and both the morphology and the kinematics have been discussed by Wang et al. (2002) where it was claimed that the kinematics and morphology as seen in the optical indicated a bipolar structure, possibly consistent with a jet outflow and possibly connected to the asymmetry observed of the outer ejecta in early spectro-polarimetry (Cropper et al. 1988; Jeffery 1991; Wang & Wheeler 2008). The asymmetry in the explosion was suggested to have the same preferred overall axis as detected in early speckle interferometric observations (Meikle et al. 1987; Nisenson et al. 1987) and towards the first emission knot appearing in the equatorial ring (Sonneborn et al. 1998; Pun et al. 2002). The axisymmetry would include the circumstellar ring structure, the outer ejecta as well as the inner ejecta (Wang et al. 2002; Wang & Wheeler 2008) and was interpreted as possibly connected to a bipolar or jet-like structure in the explosion. In this paper we report ground based adaptive optics observations in the near-IR, which are more naturally interpreted as a prolate structure in the equatorial plane.
In section 2 we describe the observations and calibrations. In section 3 Figures 4, 5, and 7 visualise the observed spatial distribution of the ejecta velocity field. We discuss our findings and compare them to previous observations of SN 1987A in section 4, and summarise our results in section 5.

2 Observations and Calibration
2.1 Observations
Integral Field Spectroscopy observations in the J, H and K band of the ejecta emission from SN 1987A were obtained in October and November 2005 with SINFONI (Eisenhauer et al. 2003) on the Very Large Telescope (VLT) in Chile. The epochs correspond to days 6816, 6824, 6825, 6839, and 6843 since explosion. The observations were supported by Adaptive Optics (AO) using Star 3 as the reference source. The field of view (FOV) was with a spatial resolution of 10050 mas/pixel for all bands.
The observations consist of 4800s in J, 4200s in H, and 5400s in K integrated from single exposures of 600s. All individual exposures were offset by sub-spaxel spacings to improve the spatial resolution and the object exposures were separated by sky exposures of equal integration time in an object-sky, sky-object sequence. The observations were carried out on 5 separate nights indicated above with airmasses between 1.4 and 1.5 for all observations.
2.2 Calibrations
The data have been flat fielded, sky subtracted and combined into data cubes using the SINFONI pipeline version 1.2 (Schreiber et al. 2004; Modigliani et al. 2007). Exposures in a filter for a single night (between 2 and 5 exposures) were combined using the sigma clipping routine available in the pipeline, where the noise is reduced by constructing the mean for each data point and omitting data points that were 2 sigma away from the mean value.
We flux calibrated each night separately using standard stars (HD 76233 (B6V), CCDMJ03187 (G2V), HD 46976 (B9V), HD 52447 (G0V), HD 58112 (B4V), and HD 94108 (B4V)) and their 2MASS values for magnitudes, types and colours (Cohen et al. 2003). In the flux-calibration the observed standard star spectrum is divided by a template spectrum for that type of star in order to isolate the instrument response and telluric features. For the B type standard stars we superimposed hydrogen absorption features (scaled to the features observed in the standard stars) on the Planck curve and used that as the stellar template. The Planck curves are calculated from the theoretical temperatures corresponding to the stellar type. For the G type stars we used the solar spectrum scaled with the observed absorption features in the standard star and brought it to the spectral resolution of the standard star.
Data from different nights were combined in order to increase the signal and to obtain a higher spatial resolution utilising the sub pixel dithering. The resulting spatial resolution is evident in the images, where the pixel scale is 25 mas/pixel.
| EE | 50% | 80% |
|---|---|---|
| H-band | 0.063” x 0.075” | 0.150” x 0.175” |
| K-band | 0.075” x 0.050” | 0.150” x 0.125” |
| H-band | 2.5 x 3 pixels | 6 x 7 pixels |
| K-band | 3 x 2 pixels | 6 x 5 pixels |
We checked the pipeline wavelength calibration against the known position of the atmospheric OH lines (Rousselot et al. 2000) and from that determined an accuracy of the wavelength calibration as the root mean square of the correction value. The error of the wavelength calibration is found to be m, m and m, in J, H and K, respectively. This corresponds to velocity uncertainties of 3 km s-1, 4 km s-1, and 3 km s-1.
The spatial resolution of our data is established using the point spread function (PSF) of star 3 which mostly lies within our field of view. The detailed knowledge of the PSF provides us with a measure of the residuals of the adaptive correction of the atmospheric disturbance and of the spatial resolution of the spectrograph. The PSF has an enhanced core and broad faint wings and we use the encircled energy metric (EE) to quantify the quality of the data. Since Star 3 is not completely sampled in the wings in all bands, we extrapolated the missing part by using the shape of the PSF by averaging azimuthally. We measured the EE in the x and y direction independently to spot any differences caused by the FOV image being deconstructed in the y-direction. The Encircled Energy (EE) for 80% and 50% of the emission from a point source are summarised in Table 1. The EEs are shown in some of the images as ellipses (akin to a beam-size) in the upper left corners to display the spread of the emission.
We dereddened the spectra using the galactic extinction law assuming , and =0.16 (Fitzpatrick & Walborn 1990) for the colour excess towards SN 1987A, based on =0.10 from the LMC and =0.06 from the Milky Way (Staveley-Smith et al. 2003). For the recession velocity we use 286.7 km s-1(Gröningsson et al. 2008a).
3 Results
3.1 The Ejecta Spectrum
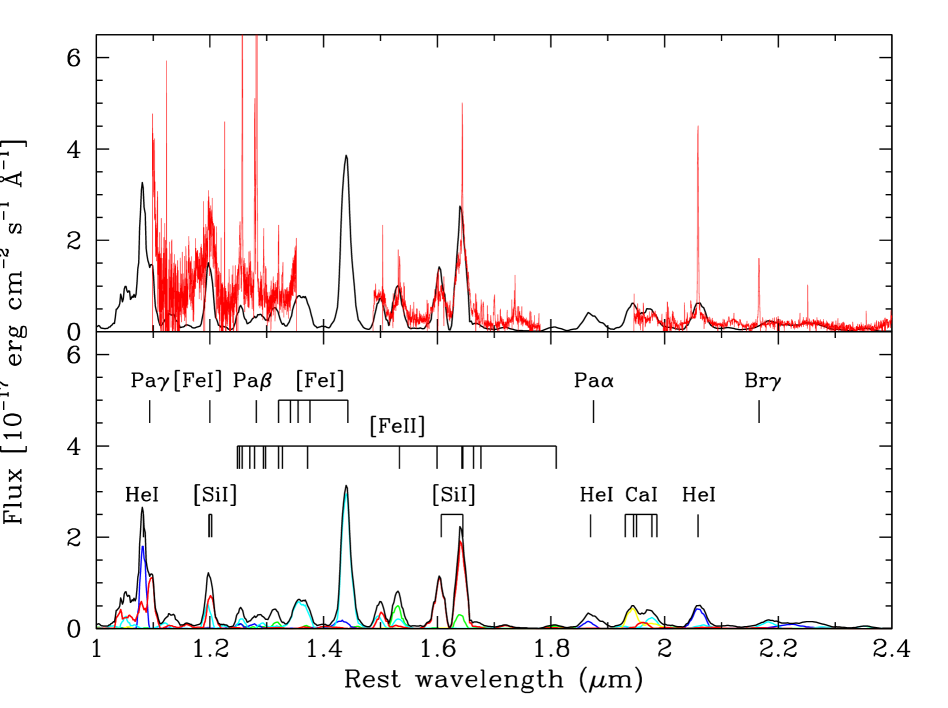
Our 3D AO spectroscopy allows us to acquire a spectrum of the ejecta and minimise the contamination from the brighter circumstellar ring. Figure 1 shows the integrated spectrum of the ejecta. The integrated area is a rectangular box with sides 0.575″and 0.825″encompassing the whole of the ejecta (rectangle shown in Fig. 7). In addition to the ejecta lines, there are also several narrow lines coming from the equatorial ring (ER). The contamination of the ejecta spectrum by light from the ER arises from the incomplete correction of the atmosphere by the adaptive optics which, as mentioned above, results in a PSF with broad wings. These narrow lines do not arise in the ejecta.
From the ejecta we note a number of broad emission lines at 1.535 m, 1.601 m, 1.644 m, and 2.060 m, already identified in Kjær et al. (2007). The 2.060 m line is identified as He I ( m). The strong lines in the H-band are blends of forbidden lines of singly and doubly ionised iron and singly ionised silicon. We also observe a weak Br at 2.166 m. The region below 1.35 m is more noisy but contains several clear lines at 1.20 m, 1.25 m and 1.27 m. Likely identifications of these are discussed below.
For the later analysis it is important to determine reliable line identifications, especially for the line at 1.644 m, which likely is a blend of [Fe II] and [Si I]. Since many of the lines originate from the same upper levels in Si I and Fe II, we made a simple model by varying the relative populations of those upper levels. We used Gaussian line profiles with widths of 3000 km s-1. These models showed that the 1.644 m line cannot be pure [Fe II], since the 1.257 m and 1.322 m lines would then be overproduced. Rather, a mix of both [Si I] and [Fe II] is required for a reasonable reproduction of the spectrum.
To obtain more specific line identifications, we have used a self-consistent model for the spectral formation. This is an updated version of the code in Kozma & Fransson (1998a), which will be discussed in detail in a forthcoming paper (Jerkstrand, Fransson & Kozma, 2010 in preparation). The main improvement is the addition of a Monte Carlo radiative transfer calculation, allowing for a detailed determination of the internal radiation field. Scattering and fluorescence are taken fully into account, using line opacities from NLTE solutions to the neutral and singly ionised stages of H, He, C, N, O, Ne, Na, Mg, Al, Si, S, Ar, Ca, Sc, Ti, V, Cr, Mn, Fe, Co and Ni. Much of the atomic data base is updated, both for the newly added elements (Sc, Ti, V, Cr, Mn) as well as for the previously included ones. Non-thermal excitations and ionisations are crucial at this epoch and are included for all elements along the lines of Kozma & Fransson (1992).
Abundances of the different nuclear burning zones are taken from the 20 model in Woosley & Weaver (1995), and we assume that these are distributed with individual filling factors in the core. This prescription mimics the macroscopic mixing for which there is abundant evidence in SN 1987A (e.g. McCray 1993). At this late phase only 44Ti is important as an energy source, the positrons from which dominate the energy deposition. We assume that these are trapped in the Fe-rich and Si-rich zones with 90% energy deposition in the former and 10% in the latter, roughly corresponding to the distribution of 44Ti in the explosion model. We discuss the sensitivity to the spectrum of this assumption below. The total 44Ti mass used is M⊙, and we assume a half-life of 58.9 years (Ahmad et al. 2006). The velocity of the core region is 2300 km s-1, in rough agreement with the line profiles. We do not make any assumptions about the composition or location of the dust, but treat it as a grey absorber within the core. We set an optical depth of from the centre to the edge of the core, based on analyses from earlier epochs (e.g. Lucy et al. 1991a). We emphasise that we have here not attempted a full investigation of the sensitivity of the model to the 44Ti mass, which depends on the assumed optical depth of the dust. The 44Ti mass should therefore only be taken as indicative. For a determination and extended discussion of the 44Ti mass we refer to Jerkstrand, Fransson & Kozma (2010, in preparation).
In Fig. 2 we show the resulting near-IR section of the spectrum. There are several interesting points to note here. First, the general agreement is good, given that the model has not been tweaked to match the data and the free parameters are few. The assumed 44Ti mass should therefore be reasonable, although, as discussed above, this needs to be confirmed with a full modelling of the spectrum. We also confirm that the 1.644 m line is indeed a mix of [Si I] and [Fe II], with [Si I] being the dominant component (80%). The 1.601 m line is essentially pure [Si I], 1.535 m is [Fe I] and [Fe II] in similar amounts, and the 1.50 m line is a blend of [Si I] and [Fe I].
The simulation also shows several [Fe I] lines. The strongest of these is the 1.443 m line, which unfortunately lies between the windows in which the atmosphere allows us to observe. We should, however, point out that the strength of the Fe I lines depends on uncertain contributions of non-thermal excitations. Collisional cross sections for these are largely lacking and are approximated by the Bethe formula.
In the region below 1.35 m we identify 1.20 m with a blend of [Si I] 1.198,1.199,1.203 m and [Fe I] 1.197 m. The line at 1.25 m is mainly Fe II, and 1.27 m is Pa. In general, this part of the spectrum is too faint in the model. The reason might be that the background level in the J-band is more uncertain compared to the longer wavelength bands due to the lower Strehl ratio. This means that the wings of the PSF, and therefore also the background from scattered light from the ring emission, is more important here than in the H- and K-bands. This could increase the background considerably in this band. However, the model also contains uncertainties (e.g. the cross sections mentioned above and the positron deposition) that may also explain the discrepancy.
An interesting result is that the relative strengths between the He I 2.058 m line and the [Fe II] lines are well reproduced. At early epochs helium from CNO nucleosynthesis gives rise to the 2.058 m emission. In our model most of the helium and iron emission comes from the iron core, although we cannot exclude some contribution by helium from the hydrogen burning region, mixed into the core. Evidence for this was seen at earlier epochs from the line profile of the He I lines (Kozma & Fransson 1998b), as well as in 2D hydrodynamic simulations (Kifonidis et al. 2006). The He in the iron core is produced by the -rich freeze-out. According to the models by Woosley & Weaver (1995) the He abundance in the iron core can be 50% by number. One may in this context note that the He I 2.058 m emission is substantially stronger than the Br line (Fig. 1), which is mainly driven by the recombination freeze-out, unless positrons leak into this region. The optical depth to the gamma-rays is small, and only a small fraction of the gamma-ray energy is absorbed by the ejecta. Recombination freeze-out effects also affect the helium rich gas from the envelope, and add to the He I emission from the core. In our model most of the He I emission is, however, produced by the Fe core. A more quantitative assessment of the He I emission requires a detailed spectral calculation.
It is not clear whether the positrons are absorbed by the zones containing the 44Ti, where they were emitted, or if they propagate to other zones before being absorbed (see e.g. Chugai et al. 1997). In order to take this uncertainty into account, we explored the consequences of this assumption by computing a model, where we assumed that the positrons were deposited in proportion to the total number of electrons in each zone, rather than at the same location as they were emitted.
This did not result in any major changes in the model spectrum, although the origin of the emission in some case were different. The 1.601 m and 1.644 m lines were still dominated by Si I in this model, however now produced by the silicon in the oxygen zones. This alternative model yielded a lower flux for these lines by a factor 2. The He I 2.058 m line flux did not change much between the two models, but the source of the emission changed from the Fe/He zone to the He and H zones in the alternative model.
3.2 The Ejecta Geometry
We focus in the following on the 1.644 m and He I 2.058 m lines in our spatial analysis of the velocity field as, from our data, these lines provide the strongest constraints on the nucleosynthesis.
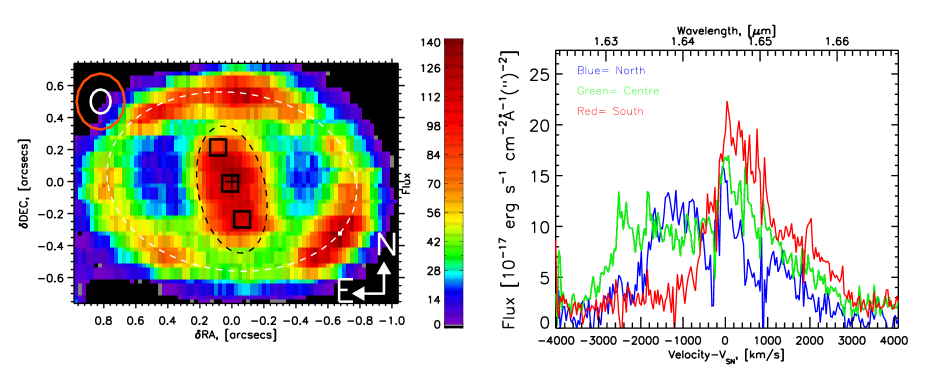
First we investigate the apparent shape of the ejecta. The left panel of Fig. 3 shows an image of the brightest ejecta line at 1.644 m. The small cross is positioned at the co-ordinates (0,0), which corresponds to 05h 35m 28.105s and -69° 16′ 10.99″(J2000.0, with the astrometry calibrated with respect to HST images and the coordinates given by West et al. 1987; Walborn et al. 1993). This is the centre of the white dashed line, that follows the shape of the inner ring. The shape of the ejecta is elliptical and we find from the isophotes a ratio of the major to minor axis of (see black dashed ellipse in left panel of Fig. 3). The axis of symmetry is at a position angle of , which agrees quite well with the found from HST observations by Wang et al. (2002) and Sugerman et al. (2005).
With 3D spectroscopy we have spectral information for each pixel in the image in the left panel of Fig. 3. The right panel of Fig. 3 shows the spectra at three different positions indicated by the squares in the left panel of Fig. 3. The extraction is performed using an averaging box function 0.1 arcseconds on the side which maximises the signal to noise while not significantly degrading the resolution. The different spatial positions of the spectra lead to different line profiles of the 1.644 m line. The southernmost pixel (red curve) has most red-shifted emission, the northernmost pixel (blue curve) has most blue-shifted emission, and the middle pixel (green curve) has both red and blue-shifted emission and thus a very broad profile. The spectra of the North and South pixels alone indicate a bipolar structure of the elongated ejecta. The middle spectrum supports this with its width.
In order to use the spectral information to derive ejecta geometry along the line of sight we briefly summarise the expected kinematic structure of freely expanding ejecta. Because of the kinematic nature of the explosion, once pressure effects have become unimportant, the expansion is expected to be homologous. With a homologous velocity field, i.e., , constant velocities along the line of sight are surfaces perpendicular to this direction. The images at the different wavelengths of an emission line therefore represent a tomography of the structure of the ejecta along the line of sight. In particular, for a spherically symmetric ejecta we expect the images at a given velocity along the line of sight, , to be concentric disks with radius , where is the velocity at the maximum radius . Departures from spherical symmetry will show up as shifts in intensity in the centre of the images and a non-circular form.
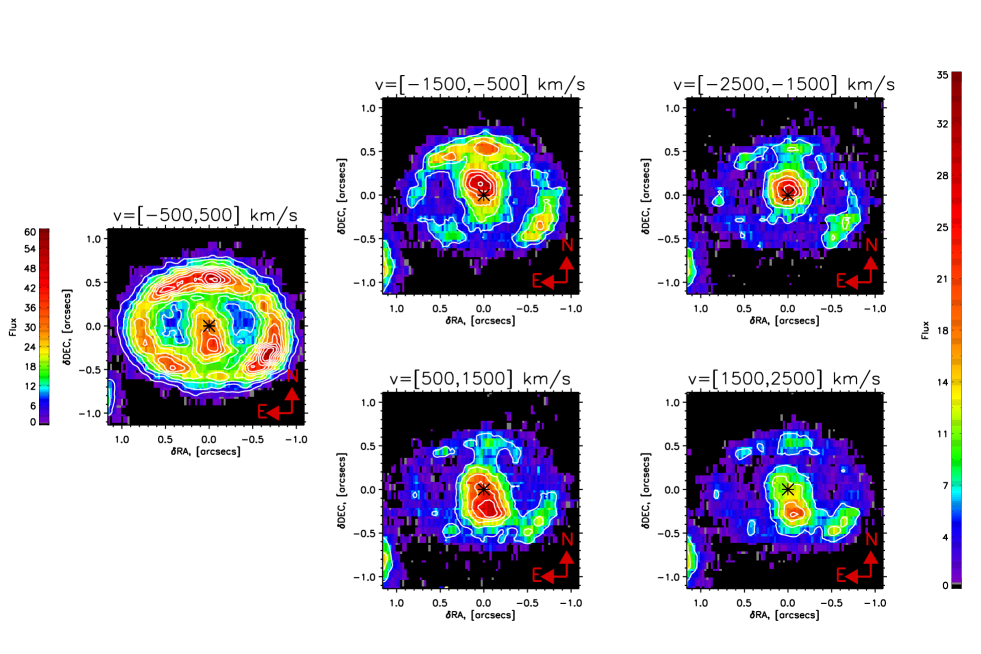
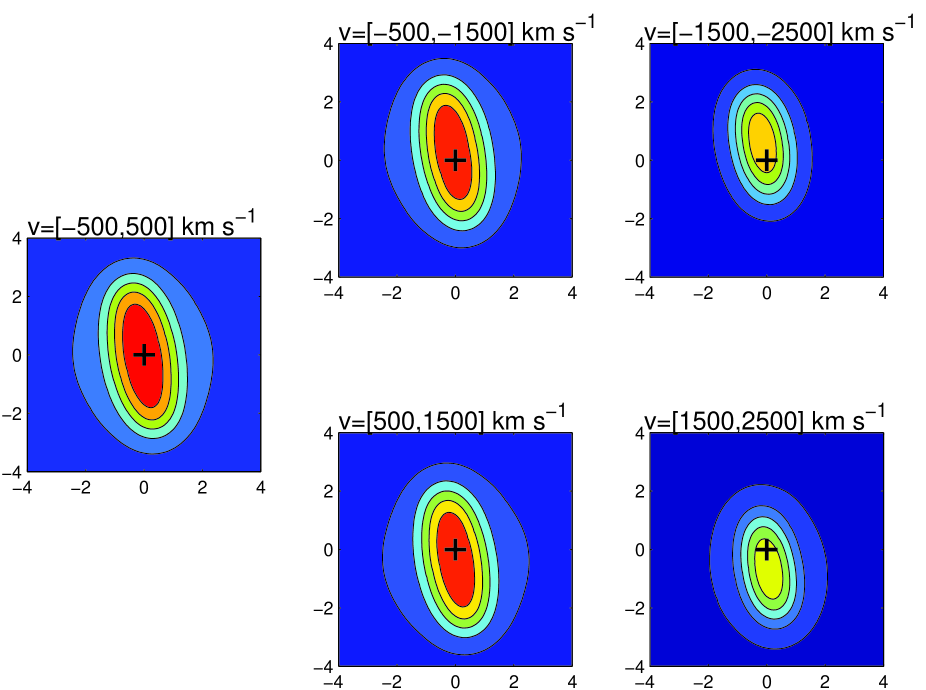
To investigate the asymmetry of the ejecta we show in Figure 4 images of the 1.644 m line of SN 1987A in different velocity intervals. Each frame in the figure shows a separate part of the ejecta line profile. The divisions are made in velocity, where the line is integrated over 1000 km s-1. The upper panels show the blue-shifted emission and the lower panels show the red-shifted emission. The contours show the intensity levels spaced by erg s-1 cm-2.
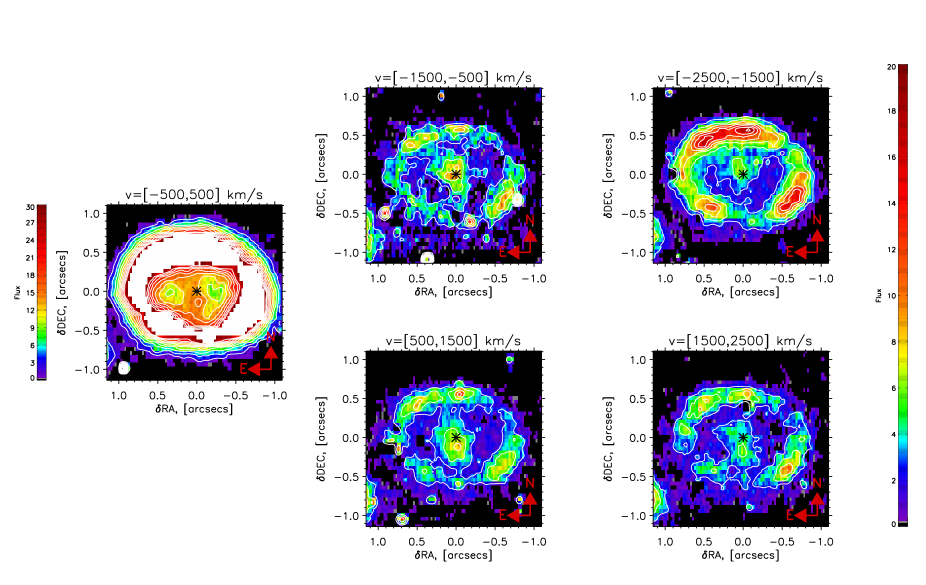
The integrated image of He I 2.058 m clearly shows elongated ejecta similar to that in the 1.644 m line. We have compared the 1.644 m and He I images by taking the ratio of the two, but do not find any significant difference in extent or intensity distribution.
Although not the subject of this paper (see instead Kjær et al. 2007), we note the dominance of the ring in the lowest velocity bins of both lines. Furthermore, we also note the stronger emission from the southern part in the red-shifted km s-1 bin, while the northern part dominates the blue-shifted km s-1 bin. Although the lines from the shocked ring are of intermediate width (200-400 km s-1) (Gröningsson et al. 2008a), we see that the ring is visible in all the velocity bins. This is caused by the continuum and other lines from the ring and/or a broadening of them due to the shock interaction in the ring. The most important result, which is new, is, however, that in all velocity bins there is a clear shift in the position of the maximum intensity between the blue and red sides of the ejecta, consistent with the velocity pattern seen for the emission from the ring. This illustrates in a nice way the power of AO-supported integral field spectroscopy.
We can also study the geometry in other lines. The spatial distribution of the kinematics for the He I 2.058 m line is shown in Figure 5. Although the emission for the ejecta is much fainter and the ring is brighter in He I 2.058 m than in the 1.644 m line, we observe the same velocity pattern in the emission arising from the ejecta, with the blue-shifted emission appearing to the North and the red-shifted component to the South. The ring emission seen in the [-1500,-2500] km s-1 bin is most likely due to the [Fe II] m line (Kjær et al. 2007).
3.3 Simulations of the ejecta kinematics
In order to understand the 3D shape of the ejecta using the spatial and velocity information in Fig. 4, we constructed a model based on a homogeneous ellipsoid. This is obviously a simplification in view of e.g., the possible patchy dust obscuration, seen as a ’hole’ in the HST images of the ejecta (Wang et al. 2002), and also compared to the complex structure seen in realistic simulations (Kifonidis et al. 2006; Hammer et al. 2010). As a first approximation to a non-spherical distribution the homogeneous ellipsoid provides the necessary constraints for a qualitative description of the ejecta geometry. We have allowed the axis ratios and the Eulerian angles of the ellipsoid to vary. Finally, the images have been convolved with the observed PSF profile for Star 3 in the H-band.
Fig. 6 shows the spatial distribution of the emission in different velocity bins, scaled to represent that of the observations in Fig. 4. The centroid of the emission is determined by a combination of the shape of the ejecta, as represented by the axis ratios, and the orientation in space of the emission region. Observations during the first years showed strong evidence for dust in the ejecta (Lucy et al. 1991b; Wooden et al. 1993). Dust will obscure emission from the far side of the eject (the red part of the integrated along the line of sight emission). However, since we spatially and spectrally resolve the emission, dust could only impact quantitative measures of the fluxes of lines arising from the ejecta. The main conclusion of our study, namely, that the ejecta are confined primarily to the equatorial plane, is unlikely to be altered by the effects of dust obscuration. We therefore do not include this effect in the simulations.
The best fit to the observations is achieved with a triaxial body with axis ratios , with Eulerian angles (inclination), (line of nodes) and (angle of major axis). Here we follow the convention for the angles by Goldstein et al. (2002). This corresponds to a position angle of and a tilt out of the plane of the sky by . The position angle is consistent within the errors with that determined directly from the image.
Comparing the model (Fig. 6) with the observations we see that there is a general qualitative agreement between the two as seen in Fig. 4, with the centroid of emission indeed shifting from north to south between the blue and red. Also the axis ratio between the projected images on the plane of the sky agrees well. Quantitatively there are, however, differences as expected for this simplified model. While the red-shifted velocity bins compare reasonably well, the blue-shifted bins have a smaller spatial extent, corresponding to an ellipsoid, where the major axis has a larger inclination from the plane of the sky (i.e. viewed more ’head on’). We discuss the ejecta geometry more in section 4.
This comparative analysis suggests that the ejecta shape does not follow a simple ellipsoid. Rather, that the shape of the blue-shifted part is different from the shape of the red-shifted part, or at least that the viewing angles of the two are not the same.
3.4 The Ejecta Kinematics
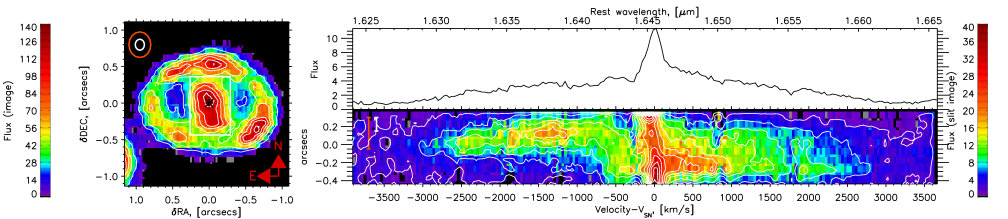
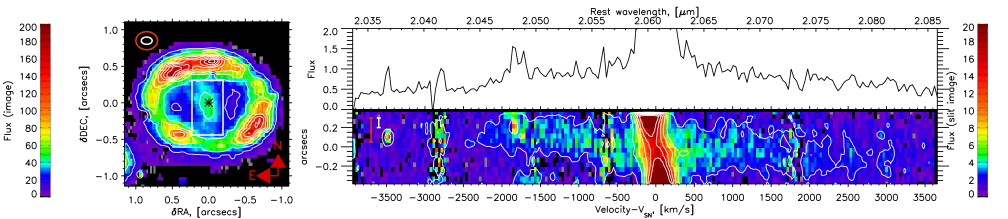
The elongated ejecta visible in images of SN 1987A show that the North part of the ejecta is predominately blue-shifted and the South part is predominately red-shifted. Figure 7 shows the spectral and spatial distribution of the [Si I]+[Fe II] 1.644 m line and the He I 2.058 m line. The left panels of the figure are image maps integrated over the spectral range from the right panels, where the top image is the 1.644 m line and the bottom image the He I 2.058 m line. The right panels show the line profiles for the given lines and underneath the spatial distribution of the emission line profile along the North-South axis, also referred to as the spectral image. The images are centred on the asterisk at coordinates (0,0), which marks the centre of elliptical appearance of the inner ring. The spectral images follow this convention for the positional zero point. The Encircled Energy (EE) for 80% and 50% of the emission from a point source are indicated by the ellipses (see Section 2 for details).
The projection of the EE ellipses are displayed in the spectral image, keeping in mind that rather than displaying a positional error, they display the distribution of the emission. The white boxes indicate the integration area for the spectrum shown in the right panels. The area of the boxes are chosen in order to minimise the contamination from the ring emission while optimising the emission from the ejecta. The spectral image retains the North-South axis, showing us the spatial distribution of the red and blue shifted material. Any information about the spatial distribution along the East-West axis is lost in this integration. Reversing the direction of extraction such that the information in the EW direction is preserved did not result in any additional kinematic information.
The similarity of the spectral image, and thus the kinematics, for the 1.644 m and He I lines suggests that He is intermixed with the Fe/Si. This is consistent with an origin of the helium from the -rich freeze-out in the iron core, as we discussed in connection to the spectral analysis (section 3.1). As was described there, we can, however, not exclude that mixing of the helium from hydrogen burning may give the same spatial distribution as the iron core.
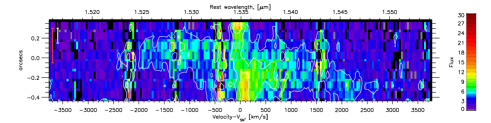
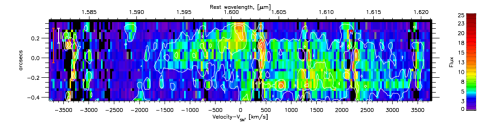
Fig. 8 shows the spectral images of two fainter ejecta lines in the H-band at 1.53 m and 1.60 m. Here we see that these lines show the same spatial distribution of the velocities along the North-South line (y-axis) as the 1.644 m and He I lines.
Note that we only observe gas which is heated and excited by either radioactivity or the emission from the shock. The latter is likely to be important mainly for the outer high velocity ejecta. The inner ejecta we are discussing in this paper is most likely mainly excited by the radioactive material. At these late epochs the ejecta is transparent to the gamma-rays, and the positrons from the 44Ti decay dominate the excitation. Because these are likely to deposit most of their energy locally the emission seen from the inner ejecta should mainly reflect the distribution of radioactive 44Ti. The explosion imprinted a velocity structure on the whole ejecta, and it is this velocity structure that we now see illuminated from within by radioactive decay.
4 Discussion
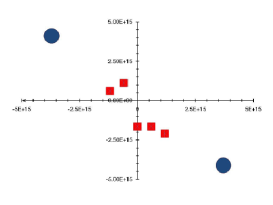
The observed kinematics and geometry of the ejecta of SN 1987A at late times clearly indicate that the emission has an orientation generally similar to the equatorial ring. Fig. 9 shows the position of the ejecta emission along the line of sight and compared to the position of the equatorial ring. We find the inner ejecta of SN 1987A to be distinctly aspherical, with the blue-shifted material displaced to the North and the red-shifted material predominately luminous to the South (Figs. 4, 5, 7, 8). The spatial extent of the red-shifted (southern) material is significantly larger than that of the blue-shifted material. If we, in spite of the differences between the blue and red shifted material, approximate the shape of the whole ejecta with that of an ellipsoid, we find that the orientation of the major axis is PA= and with a tilt out of the plane of the sky of .
The maximum velocities observed are about 2500 km s-1 to nearly 3000 km s-1(Fig. 7), corresponding quite well with the velocities inferred from the line shapes of the radioactive decay lines and the observed Fe lines in early spectra (e.g. McCray 1993). We observe material, which is still heated by radioactivity, hence must come from a region mixed with elements synthesised in the explosion. With the inner ejecta not perpendicular to the equatorial ring, we find a configuration, which deviates from the bipolar model proposed by Wang et al. (2002) and Wang & Wheeler (2008).
Wang et al. (2002) discussed the geometry and kinematics of the ejecta based on HST observations obtained in August 1999, some six years before our SINFONI observations. The HST image discussed by Wang et al. (2002) was taken through the F439W filter and is dominated by emission in [Fe I] and [Fe II]. It should therefore be directly comparable to our [Si I]+[Fe II] SINFONI image. The position angle of the ejecta was found to be , consistent with our results. Wang et al. (2002) also discuss the kinematics based on the line profile of the [Ca II] line. By applying 0.1″slits along the North-South axis, they found that the peak velocity of the northern part was close to zero, while the southern ejecta has a positive velocity of km s-1. These numbers should be compared to our average velocities of km s-1and 700 km s-1, respectively (cf. Fig.3). However, as noted by Wang et al. (2002), there may be systematic errors in their velocities, either from the uncertainty in the rest wavelength of the line ([Ca II] vs. [O II] ), in the wavelength calibration, or the exact positioning of the slit. Considering these uncertainties, our measurements may therefore be consistent, if the wavelengths by Wang et al. (2002) are blueshifted by km s-1. We note, however, that our spectra have higher S/N, and that we can trace the line profiles more reliably. In addition, the ejecta has expanded in the seven years between the two observations (the supernova age increased by a factor of nearly 1.5) and hence a better separation of the different emission regions can be achieved. Finally, thanks to the integral field spectroscopy, we can image the ejecta emission over the whole ejecta, as well as in specific lines, which represent a considerable advantage compared to the HST filter observations.
The observed geometry of the inner ejecta strongly supports a large-scale instability, like SASI, in the explosion. The strong mixing of material and the asymmetry of the explosion in SN 1987A, as already indicated by the bolometric light curve, the Bochum event, line profiles and the early emergence of and X–rays is here clearly confirmed. The kinematics of the inner ejecta show that the explosion has defined an orientation, which is close to the equatorial plane of the progenitor star as defined by the circumstellar rings. This would invalidate jets produced through the poles, if the equatorial ring really defines a rotation axis of the progenitor star.
In addition, the inner ejecta appear not to be located in a plane, but rather we see two extensions at different radial velocities and projected spatial extent. The strongest emission in the northern extension is located at about 1400 km s-1and at 0.15″from the explosion centre, while the southern part displays the strongest emission at a velocity of 500 km s-1but extends out to nearly 0.3″. Fig. 9 displays the situation of the ejecta relative to the equatorial ring. The ejecta velocities have been converted to the line-of-sight positions at the time of the observations (6840 days) and the angular distance in declination (DEC) assuming a distance to SN 1987A of 50 kpc. The ring position was determined from measured offset from the centre and assuming an inclination of (Sugerman et al. 2005). This figure should be seen as a more detailed 2D complement to Fig. 6, which, however, gives a full 3-D representation, although with the approximation of an ellipsoid. The general orientation of the major axis is consistent within the errors of these two representations.
Since the inner ejecta seem not to be co-planar, we may also speculate about the direction of the kick received by the neutron star. Presumably, the inner ejecta are the part, which impart the momentum of the large hydrodynamic instabilities onto the proto-neutron star. The connection between the SASI instabilities on scales of a few km and the large scale asymmetry we see is not obvious. The first calculations by Kifonidis et al. (2006) and Hammer et al. (2010) show that the SASI is important for triggering of the instabilities, although it is not clear how much of the initial instability survives the dynamics of the explosion on the much longer time scale of hours and days until the hydrodynamic structure is frozen-in. It is therefore too early to speculate about a specific direction for the kick of the neutron star. It should be recalled that the images reflect the distribution of the positron input and although the positrons are stipulated to have a limited travelling range their distribution cannot be taken to be the distribution of mass in the core.
As was discussed in Sect. 3.3, dust affects the observed flux from especially the red side of the emission. The limited signal-to-noise and the fact that most lines are blended make a detailed analysis of the dust difficult. The fact that we do observe substantial emission from red-shifted velocities (e.g., Figs. 3 and 7) shows that the dust can only block the core partially at most, as it has earlier in the evolution. Even so, the line profiles of the rather clean [Si I] 1.60 and 1.64 m lines show clear deficiencies of the red sides. We have not attempted any investigation to see whether these asymmetries have quantitatively changed compared to earlier epochs (e.g. Fassia et al. 2002), mainly because of the limited resolution and signal-to-noise of these observations.
5 Conclusions
The outer ejecta of SN 1987A travelling at around 30000 km s-1 have reached the outer ring a decade ago, and have become visible mostly in the reverse shocks generated by the collision with the ring material (McCray 2003; Gröningsson et al. 2006, 2008b, 2008a; Kjær et al. 2007; Zanardo et al. 2010). The inner ejecta are still heated by the radioactive decays (mostly positrons from the 44Ti decays; Fransson & Kozma 2002) and have expanded enough to be spatially resolved. The extent of this material corresponds to about 3000 km s-1. Our spectral analysis shows that most of the helium emission comes from the helium produced in the -rich freeze-out in the core. This is also supported by the similar spatial distribution of the He I and [Si I]+[Fe II] images. Helium zone material mixed into the core may, however, also contribute to the He I emission.
We have confirmed the asymmetric shape of the inner ejecta in SN 1987A and have shown that it is confined roughly to a similar plane as the equatorial ring. Also, the northern and southern lobes are not symmetric and show slightly different radial velocities, which points towards two separate angles in the line of sight of the emission sites. Both these arguments are against a jet-induced explosion as favoured by Wang et al. (2002) due to an explosion propagating through the poles of a rotating star. Instead, the shape of the inner ejecta are fully consistent with what is expected from the large instabilities predicted in recent explosion models of core-collapse supernovae. The SINFONI observations of SN 1987A can be seen as a direct observational confirmation of these models.
Acknowledgements.
We would like to thank the Garching and Paranal Astronomers who provided support during the service observations with SINFONI. We are also grateful to Thomas Janka, Cecilia Kozma, Dick McCray and Craig Wheeler for discussions. This work was supported by the Swedish Research Council and the Swedish National Space Board (CF, AJ, KK). KK has been supported by a Carlsberg Foundation Fellowship and by Queen’s University Belfast, Northern Ireland.References
- Ahmad et al. (2006) Ahmad, I., Greene, J. P., Moore, E. F., et al. 2006, Phys. Rev. C, 74, 065803
- Arnett et al. (1989) Arnett, W. D., Bahcall, J. N., Kirshner, R. P., & Woosley, S. E. 1989, ARA&A, 27, 629
- Blondin & Mezzacappa (2006) Blondin, J. M. & Mezzacappa, A. 2006, ApJ, 642, 401
- Blondin et al. (2003) Blondin, J. M., Mezzacappa, A., & DeMarino, C. 2003, ApJ, 584, 971
- Buras et al. (2006) Buras, R., Janka, H., Rampp, M., & Kifonidis, K. 2006, A&A, 457, 281
- Burrows et al. (2007) Burrows, A., Livne, E., Dessart, L., Ott, C. D., & Murphy, J. 2007, ApJ, 655, 416
- Chugai et al. (1997) Chugai, N. N., Chevalier, R. A., Kirshner, R. P., & Challis, P. M. 1997, ApJ, 483, 925, (C97)
- Cohen et al. (2003) Cohen, M., Wheaton, W. A., & Megeath, S. T. 2003, AJ, 126, 1090
- Cropper et al. (1988) Cropper, M., Bailey, J., McCowage, J., Cannon, R. D., & Couch, W. J. 1988, MNRAS, 231, 695
- Dessart et al. (2006) Dessart, L., Burrows, A., Livne, E., & Ott, C. D. 2006, ApJ, 645, 534
- Eisenhauer et al. (2003) Eisenhauer, F., Abuter, R., Bickert, K., et al. 2003, in Instrument Design and Performance for Optical/Infrared Ground-based Telescopes. Edited by Iye, Masanori; Moorwood, Alan F. M. Proceedings of the SPIE, Volume 4841, pp. 1548-1561 (2003)., ed. M. Iye & A. F. M. Moorwood, 1548–1561
- Fassia et al. (2002) Fassia, A., Meikle, W. P. S., & Spyromilio, J. 2002, MNRAS, 332, 296
- Fitzpatrick & Walborn (1990) Fitzpatrick, E. L. & Walborn, N. R. 1990, AJ, 99, 1483
- Fransson & Kozma (2002) Fransson, C. & Kozma, C. 2002, New Astronomy Review, 46, 487
- Goldstein et al. (2002) Goldstein, H., Poole, C., & Safko, J. 2002, Classical mechanics (Addison-Wesley)
- Gröningsson et al. (2008a) Gröningsson, P., Fransson, C., Leibundgut, B., et al. 2008a, A&A, 492, 481
- Gröningsson et al. (2008b) Gröningsson, P., Fransson, C., Lundqvist, P., et al. 2008b, A&A, 479, 761
- Gröningsson et al. (2006) Gröningsson, P., Fransson, C., Lundqvist, P., et al. 2006, A&A, 456, 581
- Hammer et al. (2010) Hammer, N. J., Janka, H., & Müller, E. 2010, ApJ, 714, 1371
- Jeffery (1991) Jeffery, D. J. 1991, ApJ, 375, 264
- Kifonidis et al. (2006) Kifonidis, K., Plewa, T., Scheck, L., Janka, H., & Müller, E. 2006, A&A, 453, 661
- Kitaura et al. (2006) Kitaura, F. S., Janka, H., & Hillebrandt, W. 2006, A&A, 450, 345
- Kjær et al. (2007) Kjær, K., Leibundgut, B., Fransson, C., et al. 2007, A&A, 471, 617
- Kozma & Fransson (1992) Kozma, C. & Fransson, C. 1992, ApJ, 390, 602
- Kozma & Fransson (1998a) Kozma, C. & Fransson, C. 1998a, ApJ, 496, 946
- Kozma & Fransson (1998b) Kozma, C. & Fransson, C. 1998b, ApJ, 497, 431
- Krause et al. (2008) Krause, O., Birkmann, S. M., Usuda, T., et al. 2008, Science, 320, 1195
- Lucy et al. (1991a) Lucy, L. B., Danziger, I. J., Gouiffes, C., & Bouchet, P. 1991a, in Supernovae, ed. S. E. Woosley, 82–+
- Lucy et al. (1991b) Lucy, L. B., Danziger, I. J., Gouiffes, C., & Bouchet, P. 1991b, in Supernovae. The Tenth Santa Cruz Workshop in Astronomy and Astrophysics, held July 9-21, 1989, Lick Observatory. Publisher, Springer-Verlag, New York, 1991., ed. S. E. Woosley, 82
- McCray (1993) McCray, R. 1993, ARA&A, 31, 175
- McCray (2003) McCray, R. 2003, in Lecture Notes in Physics, Berlin Springer Verlag, Vol. 598, Supernovae and Gamma-Ray Bursters, ed. K. Weiler, 219–240
- Meikle et al. (1987) Meikle, W. P. S., Matcher, S. J., & Morgan, B. L. 1987, Nature, 329, 608
- Modigliani et al. (2007) Modigliani, A., Hummel, W., Abuter, R., et al. 2007, ArXiv astro-ph/0701297
- Nisenson et al. (1987) Nisenson, P., Papaliolios, C., Karovska, M., & Noyes, R. 1987, ApJ, 320, L15
- Pun et al. (2002) Pun, C. S. J., Michael, E., Zhekov, S. A., et al. 2002, ApJ, 572, 906
- Reed et al. (1995) Reed, J. E., Hester, J. J., Fabian, A. C., & Winkler, P. F. 1995, ApJ, 440, 706
- Rousselot et al. (2000) Rousselot, P., Lidman, C., Cuby, J.-G., Moreels, G., & Monnet, G. 2000, A&A, 354, 1134
- Schreiber et al. (2004) Schreiber, J., Thatte, N., Eisenhauer, F., et al. 2004, in ASP Conf. Ser. 314: Astronomical Data Analysis Software and Systems (ADASS) XIII, ed. F. Ochsenbein, M. G. Allen, & D. Egret, 380
- Sonneborn et al. (1998) Sonneborn, G., Pun, C. S. J., Kimble, R. A., et al. 1998, ApJ, 492, L139
- Staveley-Smith et al. (2003) Staveley-Smith, L., Kim, S., Calabretta, M. R., Haynes, R. F., & Kesteven, M. J. 2003, MNRAS, 339, 87
- Sugerman et al. (2005) Sugerman, B. E. K., Crotts, A. P. S., Kunkel, W. E., Heathcote, S. R., & Lawrence, S. S. 2005, ApJS, 159, 60
- Walborn et al. (1993) Walborn, N. R., Phillips, M. M., Walker, A. R., & Elias, J. H. 1993, PASP, 105, 1240
- Wang & Wheeler (2008) Wang, L. & Wheeler, J. C. 2008, ARA&A, 46, 433
- Wang et al. (2002) Wang, L., Wheeler, J. C., Höflich, P., et al. 2002, ApJ, 579, 671
- West et al. (1987) West, R. M., Lauberts, A., Schuster, H.-E., & Jorgensen, H. E. 1987, A&A, 177, L1
- Wheeler et al. (2008) Wheeler, J. C., Maund, J. R., & Couch, S. M. 2008, ApJ, 677, 1091
- Wooden et al. (1993) Wooden, D. H., Rank, D. M., Bregman, J. D., et al. 1993, ApJS, 88, 477
- Woosley et al. (2002) Woosley, S. E., Heger, A., & Weaver, T. A. 2002, Reviews of Modern Physics, 74, 1015
- Woosley & Weaver (1995) Woosley, S. E. & Weaver, T. A. 1995, ApJS, 101, 181
- Zanardo et al. (2010) Zanardo, G., Staveley-Smith, L., Ball, L., et al. 2010, ApJ, 710, 1515