Direct Confirmation of the Asymmetry of the Cas A Supernova with Light Echoes
Abstract
We report the first detection of asymmetry in a supernova (SN) photosphere based on SN light echo (LE) spectra of Cas A from the different perspectives of dust concentrations on its LE ellipsoid. New LEs are reported based on difference images, and optical spectra of these LEs are analyzed and compared. After properly accounting for the effects of finite dust-filament extent and inclination, we find one field where the He I and H features are blueshifted by an additional 4000 km s-1 relative to other spectra and to the spectra of the Type IIb SN 1993J. That same direction does not show any shift relative to other Cas A LE spectra in the Ca II near-infrared triplet feature. We compare the perspectives of the Cas A LE dust concentrations with recent three-dimensional modeling of the SN remnant (SNR) and note that the location having the blueshifted He I and H features is roughly in the direction of an Fe-rich outflow and in the opposite direction of the motion of the compact object at the center of the SNR. We conclude that Cas A was an intrinsically asymmetric SN. Future LE spectroscopy of this object, and of other historical SNe, will provide additional insight into the connection of explosion mechanism to SN to SNR, as well as give crucial observational evidence regarding how stars explode.
Subject headings:
ISM: individual (Cas A) — supernovae: general — supernova remnants1. Introduction
Light echoes (LEs) are the scattered light of a transient event that reflects off dust in the interstellar medium. The extra path length of the two-segment trajectory results in LE light arriving at an observer significantly later than the undelayed photons. Such circumstances provide exciting scientific opportunities that are extremely rare in astronomy — specifically, to observe historical events with modern instrumentation and to examine the same event from different lines of sight (LoS). We have previously employed LEs to take advantage of the time delay, identifying systems of such LEs associated with several-hundred-year old supernova (SN) remnants (SNRs) in the Large Magellanic Cloud and subsequently spectroscopically classifying the supernovae (SNe; Rest et al., 2005b, 2008a). Our work represented the first time that the spectral classification of SN light was definitively linked with a SNR. The analysis of the X-ray spectrum of that SNR by Badenes et al. (2008) provided confirmation of both its classification (Type Ia) and subclass (high luminosity). Clearly, LE spectroscopy is a powerful technique for understanding the nature of SNe in the Milky Way and Local Group galaxies.
Cas A is the brightest extrasolar radio source in the sky (Ryle & Smith, 1948) and the youngest (age 330 yr) Milky Way core-collapse SNR (Stephenson & Green, 2002). Its distance is approximately 3.4 kpc. Dynamical measurements of the SNR indicate that the explosion occurred in year (Fesen et al., 2006a); we adopt this date for age calculations in this paper. A single historical account of a sighting in 1680 by Flamsteed is attributed to the Cas A SN (Ashworth, 1980), although this has been disputed (Kamper, 1980). Cas A is the youngest of the certain historical CC SNe and is thus an excellent target for LE studies.
Krause et al. (2005) identified a few moving Cas A features (called “infrared echoes”) using infrared (IR) images from the Spitzer Space Telescope, the result of dust absorbing the SN light, warming up, and reradiating light at longer wavelengths. Their main scientific conclusion, that most if not all of these IR echoes were caused by a series of recent X-ray outbursts from the compact object in the Cas A SNR, was incorrect because they did not take into account that the apparent motion strongly depends on the inclination of the scattering dust filament (Dwek & Arendt, 2008; Rest et al., 2011). Rather, the echoes must have been generated by an intense and short burst of ultraviolet (UV) radiation associated with the breakout of the SN shock through the surface of the progenitor star of Cas A (Dwek & Arendt, 2008).
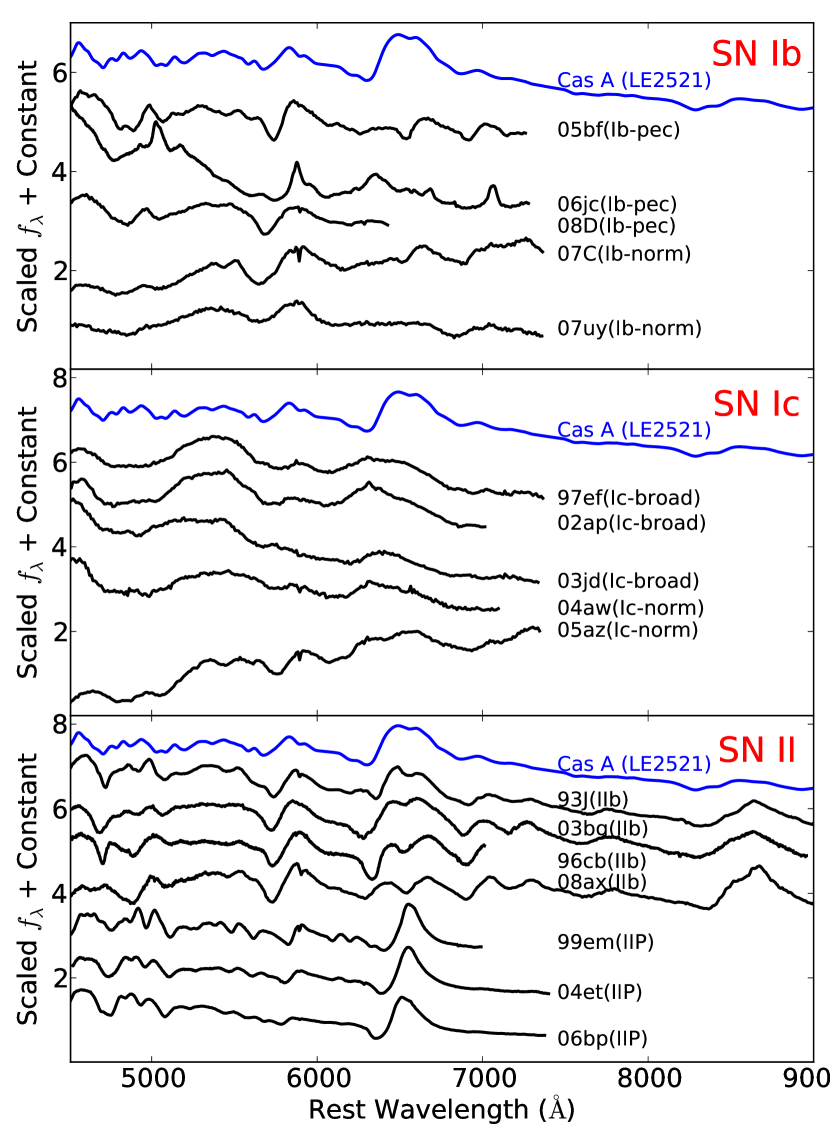
The first scattered LEs of Galactic SNe associated with Tycho’s SN and the Cas A SN were discovered by Rest et al. (2007, 2008b). Contemporaneously, Krause et al. (2008) obtained a spectrum of a scattered optical light echo spatially coincident with one of the Cas A IR echoes, and identified the Cas A SN to be of Type IIb from its similarity to the spectrum of SN 1993J, the very well-observed and prototypical example of the SN IIb class (e.g., Filippenko et al., 1993; Richmond et al., 1994; Filippenko et al., 1994; Matheson et al., 2000).
The discovery and spectroscopic follow-up observations of different LEs from the same SN allow us to benefit from the unique advantages of LEs — their ability to probe the SN from significantly different directions. The only time this technique has been applied previously was by Smith et al. (2001, 2003), who used spectra of the reflection nebula of Carinae to observe its central star from different directions. Dust concentrations scattering SN light lie at numerous different position angles and at different radial distances from the observer. This is illustrated in Figure 1, which shows the Cas A SNR (red dots), the scattering dust (brown dots), and the light paths. We denote the light echoes as LE2116, LE2521, and LE3923, where the number represents the ID of the grid tile of the search area in this region of the sky. LE2521 and LE3923 are newly discovered and LE2116 was discovered by Rest et al. (2008b). The scattering dust of LE3923 is more than 2000 ly in front of Cas A, much farther than any other scattering dust; thus, we show only part of its light path.
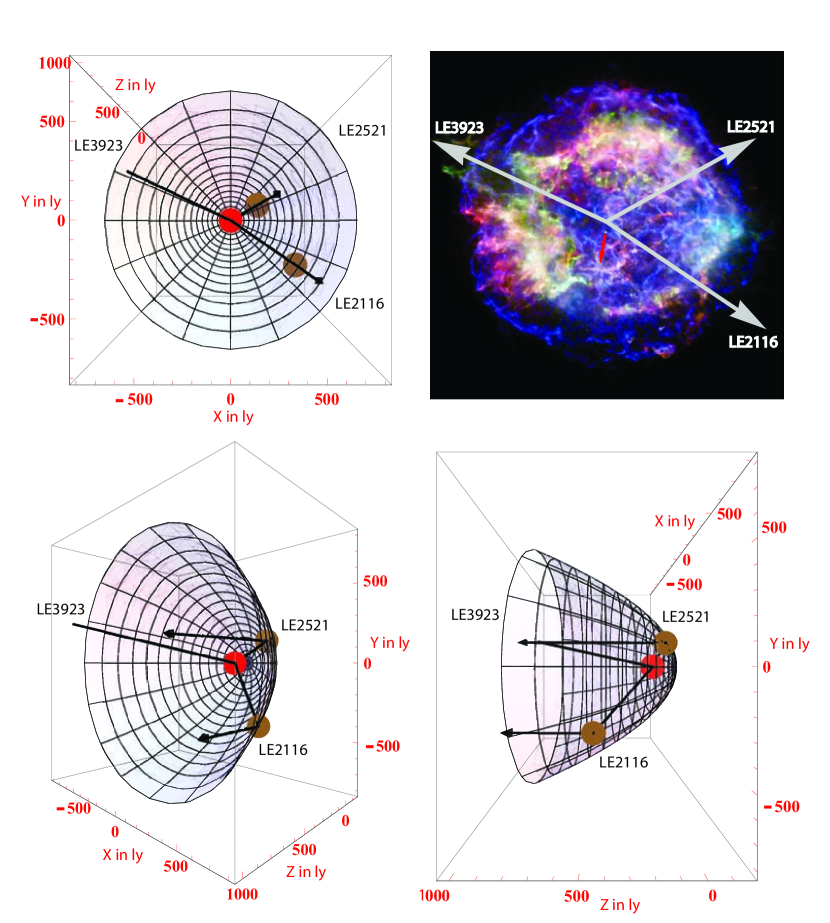
The study of a single SN from different LoS is particularly relevant for the Cas A SNR. With observations of the LEs shown in Figure 1, we are positioned to directly measure the symmetry of a core-collapse SN, and compare it to the structure of the remnant. The thermal X-ray emission as well as the optical emission of the Cas A SNR is very inhomogeneous, with large Fe-rich and Si-rich outflows being spatially distinct, indicating that the SN explosion was asymmetric (Hughes et al., 2000; Hwang et al., 2004; Fesen et al., 2006a). The nature of these outflows and their individual relevance to the SN explosion is still debated (Burrows et al., 2005; Wheeler et al., 2008; DeLaney et al., 2010). Tananbaum (1999) detected in Chandra images a compact X-ray source 7′′ from the Cas A SNR center; it is an excellent candidate for being the neutron star produced by the SN explosion (Tananbaum, 1999; Fesen et al., 2006b). The position angle of the X-ray source is off by only ∘ from the position angle of the southeast Fe-rich structure (Wheeler et al., 2008), and has a projected apparent motion of 350 km s-1. In §2 of this paper, we report two new LE complexes associated with Cas A, and we show optical spectra of these LEs as well as one of the previously known LEs. With these data we are able to view three distinct directions, where each dust concentration probes different hemispheres of the SN photosphere. In Rest et al. (2010) we have introduced an innovative technique for modeling both astrophysical (dust inclination, scattering, and reddening) and observational (seeing and slit width) effects to measure the light-curve weighted window function which is the determining factor for the relative time-weighting of the observed (integrated) LE spectrum. We apply this technique in §3 to similar well-observed SNe to produce appropriate comparison spectra. Such spectra are necessary to compare the Cas A spectra to other SNe as well as to compare the LE spectra to each other. We show that the Cas A SN was indeed very similar to the prototypical Type IIb SN 1993J, as claimed by Krause et al. (2008). In §4 we demonstrate that, despite the excellent agreement between the Cas A spectra and SN 1993J, one LE has a systematically higher ejecta velocity than either SN 1993J or the other LEs, revealing that Cas A was an intrinsically asymmetric explosion; observers from different directions would have viewed a “different” SN spectroscopically. In this section we also discuss the implications of our finding for both other historical SNe and for core-collapse SNe and their explosions.
2. Observations & Reductions
2.1. Imaging
We reobserved LEs discovered in a campaign of several observing runs on the Mayall 4 m telescope at Kitt Peak National Observatory (KPNO) starting in 2006 (Rest et al., 2008b). As described in that paper, the Mosaic imager, which operates at the /3.1 prime focus at an effective focal ratio of /2.9, was used with the Bernstein broad-band filter (k1040) which has a central wavelength of 5945 Å and a full width at half-maximum intensity (FWHM) of 2120 Å. The images were kernel- and flux-matched, aligned, subtracted, and masked using the SMSN pipeline (Rest et al., 2005a; Garg et al., 2007; Miknaitis et al., 2007). LE2116 had been previously discovered and reported (Rest et al., 2008b), whereas LE2521 and LE3923 are light echoes discovered on 2009 September 14 and 16, respectively (UT dates are used throughout this paper).
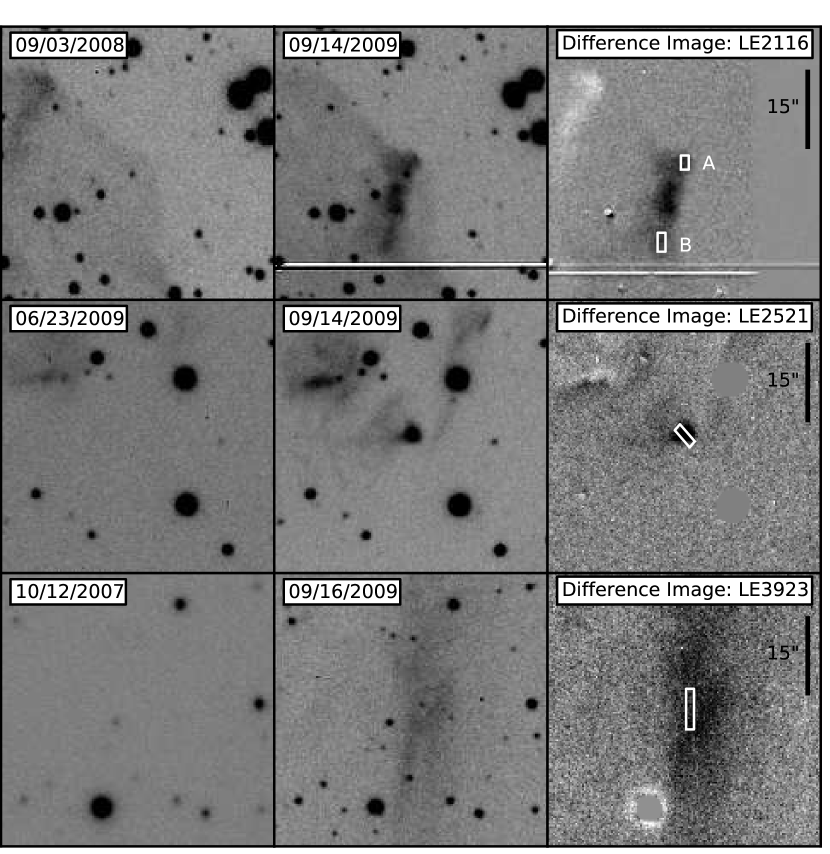
Figure 2 shows the LEs and the adopted spectroscopic slit positions. For the LE2116 mask design, we used images from KPNO obtained on 2009 September 14, 1 week before the spectroscopy was obtained. Note that we had a third slit in the high surface brightness region between slits A and B. Unfortunately, the LE filled the entire slit, making proper sky subtraction impossible. Sky subtraction using the sky observed in other slits produced inaccurate spectra with large residuals near the sky lines. As a result, we have not included the spectra from this slit in our analysis. For LE3923, we used images obtained at the Apache Point Observatory 3.5 m telescope on 2009 October 16 with the SPIcam111http://www.apo.nmsu.edu/arc35m/Instruments/SPICAM/. CCD imager in the SDSS- filter and processed in a similar manner with the SMSN pipeline. Since the apparent motion of the LEs is 30′′ per year, we measured the apparent motion and adjusted the slit position accordingly. These position adjustments amounted to 1′′. LE2521 was sufficiently compact and bright that long-slit spectroscopy was favored over masks. A summary of the spectroscopic and geometric parameters is given in Tables 1 and 2, respectively. For the light-echo profile fits described in §3, we used the deep images in good seeing from 2009 September 14–16.
| R.A. | decl. | PA SNR-LE | SeeingaaParameters for spectroscopic slit. | WidthaaParameters for spectroscopic slit. | LengthaaParameters for spectroscopic slit. | PAaaParameters for spectroscopic slit. | |||||
|---|---|---|---|---|---|---|---|---|---|---|---|
| LE | Telescope | (J2000) | (J2000) | (∘) | UT DateaaParameters for spectroscopic slit. | (′′) | IDaaParameters for spectroscopic slit. | (′′) | (′′) | (∘) | UT MaskbbUT date of image used for mask design. |
| 2116 | Keck | 23:02:27.10 | +56:54:23.4 | 237.79 | 20090922 | 0.81 | A | 1.5 | 2.69 | 0.0 | 20090914 |
| 2116 | Keck | 23:02:27.67 | +56:54:07.7 | 237.79 | 20090922 | 0.81 | B | 1.5 | 3.59 | 0.0 | 20090914 |
| 2521 | Keck | 23:12:03.86 | +59:34:59.3 | 299.10 | 20090922 | 0.79 | 1.5 | 4.32 | 41.0 | ||
| 2521 | MMT | 23:12:03.88 | +59:34:59.2 | 299.10 | 20090921 | 0.70 | 1.0 | 4.20 | 30.0 | ||
| 3923 | Keck | 00:21:04.97 | +61:15:37.3 | 65.08 | 20091023 | 0.89 | 1.5 | 7.72 | 0.0 | 20091016 |
| aaAngular distance between SNR and LE. | bbDistance between SNR and LE in the plane of the sky (). | ccCoordinates ,, and of the LE with origin at the SNR. The positive and axis are in the plane of the sky toward West and North, respectively. The positive axis is along the line of sight from the SNR toward the observer. We assume a distance to the Cas A SNR of 3.4 kpc and 1681 AD as the time of explosion. | ccCoordinates ,, and of the LE with origin at the SNR. The positive and axis are in the plane of the sky toward West and North, respectively. The positive axis is along the line of sight from the SNR toward the observer. We assume a distance to the Cas A SNR of 3.4 kpc and 1681 AD as the time of explosion. | ccCoordinates ,, and of the LE with origin at the SNR. The positive and axis are in the plane of the sky toward West and North, respectively. The positive axis is along the line of sight from the SNR toward the observer. We assume a distance to the Cas A SNR of 3.4 kpc and 1681 AD as the time of explosion. | |
|---|---|---|---|---|---|
| LE | (∘) | (ly) | (ly) | (ly) | (ly) |
| 2116 | 3.376 | 628 | 531 | -335 | 437 |
| 2521 | 1.642 | 318 | 278 | 155 | -10 |
| 3923 | 7.587 | 1204 | -1092 | 507 | 2045 |
2.2. Spectroscopy
We obtained spectra of the LEs with the Low Resolution Imaging Spectrometer (LRIS; Oke et al., 1995) on the 10 m Keck I telescope and with the Blue Channel spectrograph (Schmidt et al., 1989) on the 6.5 m MMT (see Table 1). For the LRIS observations, slit masks were designed to maximize the efficiency of the telescope time. Standard CCD processing and spectrum extraction were performed with IRAF222IRAF: the Image Reduction and Analysis Facility is distributed by the National Optical Astronomy Observatory, which is operated by the Association of Universities for Research in Astronomy (AURA), Inc., under cooperative agreement with the National Science Foundation (NSF).. The data were extracted using the optimal algorithm of Horne (1986). Low-order polynomial fits to calibration-lamp spectra were used to establish the wavelength scale, and small adjustments derived from night-sky lines in the object frames were applied. We employed our own IDL routines to flux calibrate the data and remove telluric lines using the well-exposed continua of spectrophotometric standard stars (Wade & Horne, 1988; Matheson et al., 2000; Foley et al., 2003). For LE2116, we combine slits A and B using weights of 0.9 and 0.1, respectively. We present our LE spectra in §4.
3. Generating Comparison Spectra
We have recently determined that modeling the dust-filament properties (e.g., the dust width) is required to accurately model LE spectra (Rest et al., 2010). All previous studies have neglected this aspect. Because the dust filament that reflects the LE has a nonzero size, it translates into a window function over the time domain as the SN light traverses over it. If this window function is narrower than the SN light curve, the observed LE spectrum is affected. We find that the observed LE spectrum is a function of dust-filament thickness, dust-filament inclination, seeing, spectrograph slit width, and slit rotation/position with respect to the LE. All of the noninstrumental parameters can be determined with an analysis of the LE in images at different epochs, and an individually modeled spectral template for a given observed LE can be constructed a priori without using the actual observed LE spectrum. Rest et al. (2010) describe this process in detail, showing that the observed LE spectrum is the integration of the individual spectra weighted with an effective light curve, which is the product of the light curve with the dust-filament-dependent window function. We emphasize that these window functions are different for every LE location. The top-left panel of Figure 3 shows the window functions for the LEs for which we have spectra using the SN 1993J spectral library (Jeffery et al., 1994; Barbon et al., 1995; Fransson et al., 2005) and light curve (Richmond et al., 1996). We refer the reader to Rest et al. (2010) for a detailed description of how the effective light curves are derived. Examples of the fitted parameters are given in Tables 1 and 2 and shown in Figure 12 of Rest et al. (2010)
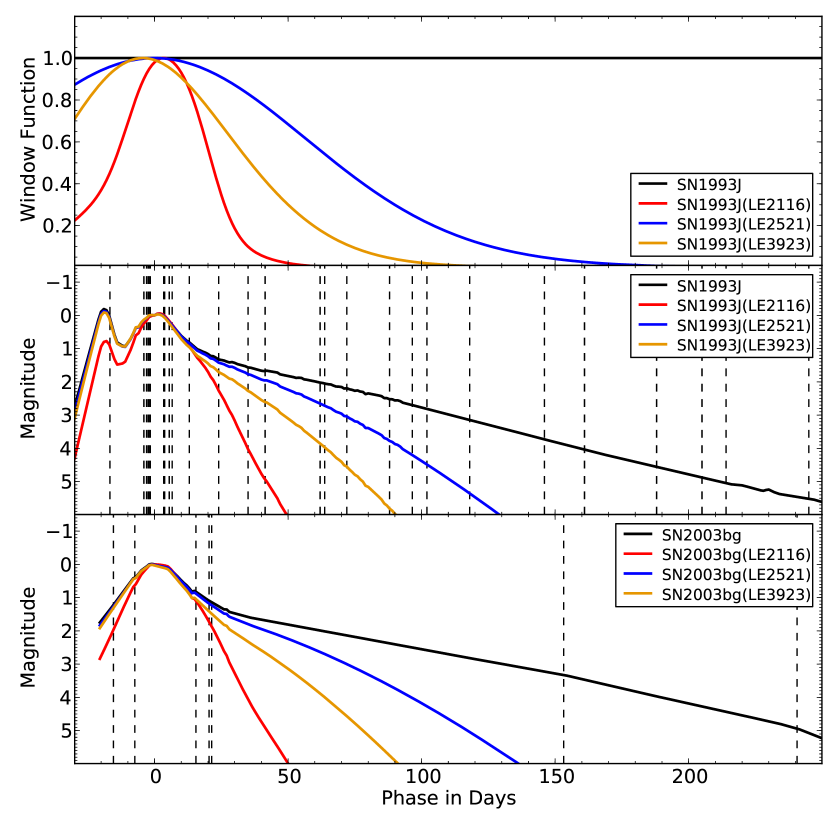
Even though LE2521 and LE2116 have comparable dust widths, LE2521 has a considerably wider window function than LE2116 since its dust-filament inclination () is significantly larger than that of LE2116 (), causing the projected SN light-curve shape to be “squashed.” LE3923 has an inclination similar to that of LE2116, but its scattering dust is thicker, leading to a wider window function. We note that the dust-filament inclination and width are the two most influential parameters affecting the window function.
The middle-left and bottom-left panels of Figure 3 show the effective light curves of SN 1993J and SN 2003bg, respectively. We constructed the effective light curve of SN 2003bg using the spectra and light curve in Hamuy et al. (2009). In general, the rise time of a SN is shorter than 50 days. Since the window functions have, in most cases, FWHM days (see the top-left panel in Figure 3), the rising wing of the effective light curves and the real light curve are similar (see the middle-left and bottom-left panels in Figure 3), and consequently the impact on the integrated spectra is small. However, the decline time of a SN is significantly longer, and therefore the window function has a much more profound impact at late phases: it cuts off the contribution of spectra with phases days. Even though the intrinsic brightness of the SN at late phases is much fainter than at peak, these late-phase spectra still significantly contribute to the integrated spectra since they are completely dominated by a few persistent lines. This is illustrated in the top-right and bottom-right panels of Figure 3, which show the integrated spectra of SN 1993J and SN 2003bg, respectively. The late-time spectra of SNe IIb such as SN 1993J and SN 2003bg are dominated by [O I] , 6363, [Ca II] , 7324, and the Ca II NIR triplet. Note that the black spectra, which are weighted by the original, unmodified light curve, are much stronger at these lines compared to the other spectra, which are integrated using the effective light curves. This figure clearly illustrates the impact and importance of the effective light curve on the contribution of the late-phase spectra to the observed integrated spectrum.
3.1. Integrating and Fitting the Spectral Templates to the Observed LE Spectra
We numerically integrate the spectral templates of SN 1993J (Jeffery et al., 1994; Barbon et al., 1995; Richmond et al., 1996; Fransson et al., 2005), SN 2003bg (Hamuy et al., 2009), and SN 2008ax (Chornock et al., 2010a) by weighting the individual epochs with the light curve as described by Rest et al. (2008a), with the only difference being that the real light curve is replaced with an effective light curve as described in §3 and in more detail by Rest et al. (2010).
Several authors have addressed the single-scattering approximation for LEs (e.g., Couderc, 1939; Chevalier, 1986; Emmering & Chevalier, 1989; Sugerman, 2003; Patat, 2005). The total surface brightness depends on parameters such as the intrinsic brightness of the event, dust density and thickness, and others. For our purposes, we only need to consider the parameters that attenuate the spectrum, which are (1) the forward scattering described by the integrated scattering function as derived by Sugerman (2003), and (2) the reddening due to the extinction by Galactic dust. The attenuation by forward scattering can be determined a priori using the observed angular separation of the LE from Cas A. The only uncertainties introduced here are due to the assumed age and distance for Cas A. The reddening cannot be determined independently and therefore we fit for it. We fit the template spectra to the observed LE spectra with the only free parameters being the normalization and the reddening. Figure 4 compares the LE spectrum of LE2521 (blue line) to various SNe Ib, Ic, and II using the window function for LE2521. SN 1993J and SN 2003bg quite clearly provide the best fit.
4. Comparison of the Cas A Light Echoes
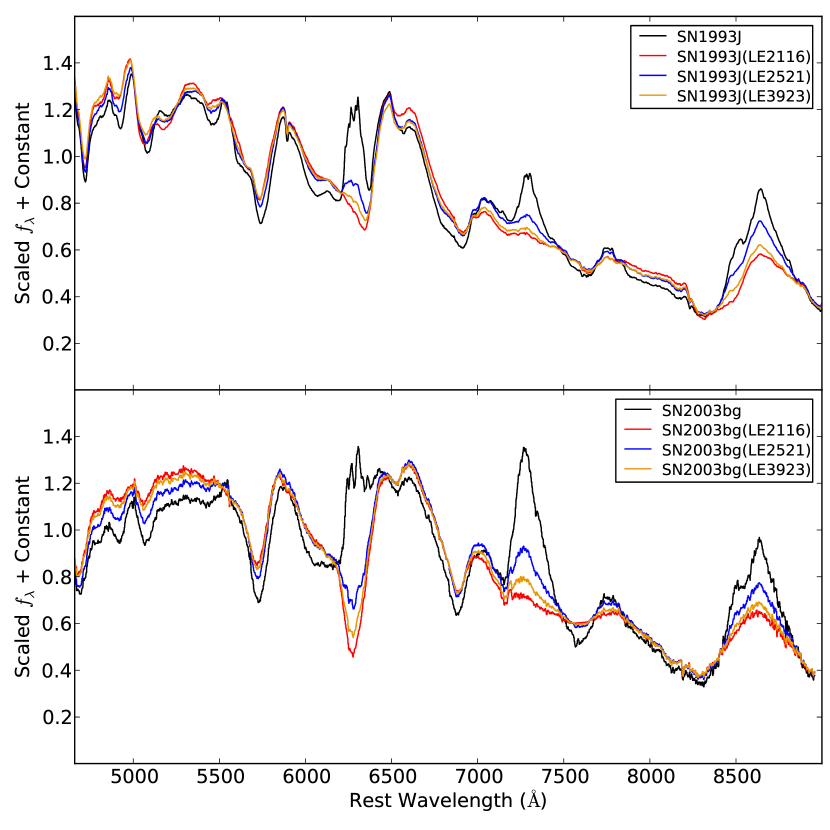
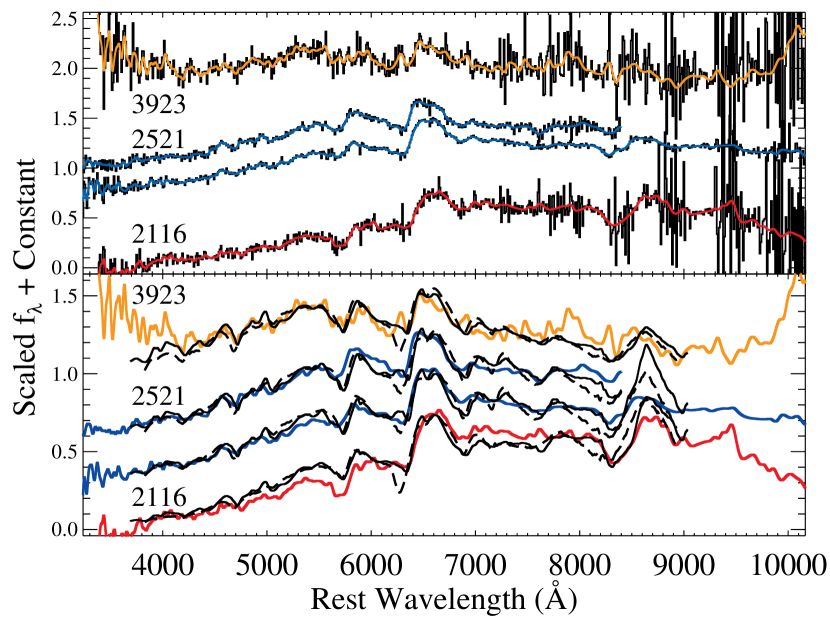
In Figure 5, we present four spectra of Cas A LEs, corresponding to three different directions. LE2521 was much brighter than the other LEs, and as a result, its spectrum has a higher signal-to-noise ratio (S/N) than the others. The spectrum of LE3923 has the lowest S/N, but it still displays the same spectral features as the other spectra. All three directions have very similar spectra with the main differences being the continuum shape, which we have shown to be a result of different scattering and reddening for the various directions. The line profiles do exhibit some differences, but as shown in §3, different window functions can create significant differences in the spectra.
To properly compare the LEs from different directions, one must make a comparison to another SN, which removes the effect of the window function. Assuming that the window functions are correct, if a LE spectrum is the same as the integrated spectrum of a SN, then the two objects likely looked the same at maximum light (there is obviously some degeneracy between the different epochs within the window function). If the two spectra are different, then either their maximum-light spectra or light curves were likely different; regardless, it is a direct indication that the two objects appeared different along those LoS. Moreover, if one LE matches the integrated spectrum of a particular spectrum, but a LE from a different direction does not, then observers along the two LoS would have seen “different” SNe.
For Cas A, we have compared the LEs to spectra of SNe 1993J, 2003bg, and 2008ax (see Fig. 5). These are the best-observed SNe IIb for which we had light curves and a good time series of spectra. As described above, SN 1993J is an iconic SN IIb that was extensively observed (e.g., Filippenko et al., 1993; Richmond et al., 1994; Filippenko et al., 1994; Matheson et al., 2000) and whose progenitor system was identified in pre-explosion images (Podsiadlowski et al., 1993; Aldering et al., 1994), and its binary companion was identified through late-time spectroscopy (Maund et al., 2004). SN 2003bg was a luminous event (both optically and in the radio) with broad lines at early times (Soderberg et al., 2006; Hamuy et al., 2009; Mazzali et al., 2009). SN 2008ax was discovered hours after explosion, which enabled significant follow-up observations (Pastorello et al., 2008; Roming et al., 2009; Chornock et al., 2010b), including extensive spectropolarimetry (Chornock et al., 2010b) indicating that the outer layers of the ejecta were rather aspherical. Furthermore, its progenitor system was also detected in pre-explosion images (Crockett et al., 2008).
Examining Figure 5, it is clear that the LE spectra in all directions are similar to each other. In addition, the LE spectra are similar to spectra of SNe 1993J and 2003bg, indicating that no dramatic differences are seen from the various directions (such as a different spectral classification). SN 2008ax is a worse match to the LEs, having significantly weaker H emission than the other objects. Since our spectral series of SN 2008ax (both CfA and published spectra from Chornock et al. 2010b) is not as exhaustive as that of SNe 1993J and 2003bg, we do not know if the differences are intrinsic or the result of incomplete data. Because of the poor match and the differences not necessarily being physical, as well as for clarity, we do not show in Figure 5 the comparison spectra generated from SN 2008ax.
Despite all LEs being quite similar, a detailed comparison of the LE line profiles to those of SN 1993J in Figure 6 indicates that while two directions (LE2116 and LE3923) are consistent with the line velocities of SN 1993J, one direction (LE2521) has higher-velocity absorption for the He I and H features. Specifically, the minima of the features are blueshifted by an additional 4000 and 3000 km s-1, respectively. In addition to the blueshifted absorption minima, the entire profile of the features seems to be shifted blueward, including the emission component of the P-Cygni profile. The Ca II NIR triplet may have a slightly larger velocity for LE2521 than in the other directions, but this does not appear to be significant. We estimate that the uncertainties in these lines are small and not significantly more than 100 km s-1.
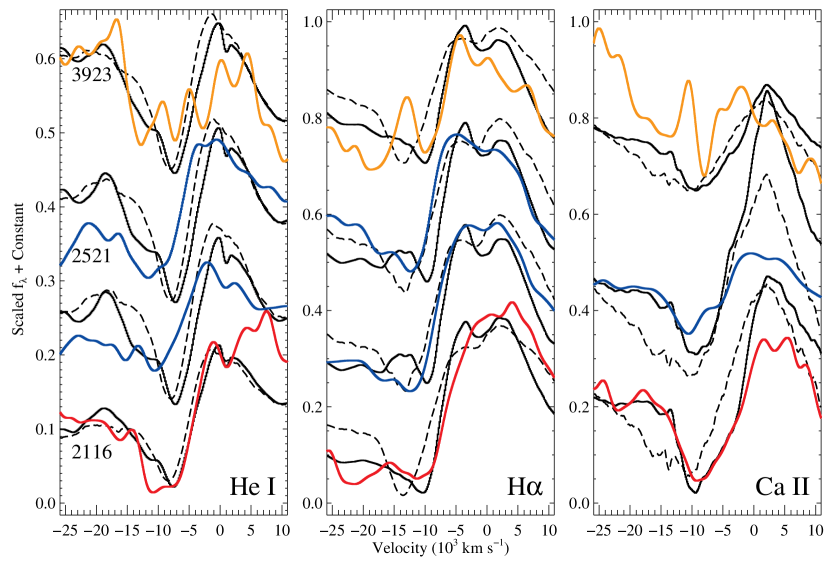
Interestingly, the comparison spectra from SN 2003bg show H velocities that are larger than those of Cas A for LE2116 and LE3923, but the velocity matches that of Cas A for LE2521. For this direction, the profile shape is also matched. The LE2521 He I velocity (and full profile) appears to be larger than that of SN 2003bg, which has a similar velocity to that of SN 1993J. This indicates that although SN 2003bg is an excellent match to the H feature of LE2521, there are still differences, and SN 2003bg is not a perfect analog. SN 2003bg has a slightly higher velocity for the Ca II NIR triplet than SN 1993J, which makes it more consistent with LE2521, but we reiterate that the difference is not significant.
5. Comparison of the Light Echoes to the SNR structure
The structure of the Cas A SNR is very complex — from the large scales, which show spatially distinct Fe-rich and Si-rich regions, to the small scales, which are dominated by many filaments and bright knot-like features in the optical and X-ray bands. Overall, the ejecta emission from the SNR appears very turbulent and inhomogeneous, similar to other remnants of core-collapse SNe (e.g., G292.0+1.8, Park et al., 2007). Hughes et al. (2000) argue that the ejecta have overturned during the explosion, since the Fe-rich material is ahead of the Si-rich material in the southeast (SE; however, see DeLaney et al., 2010). The Si-rich regions in the northeast (NE) and southwest (SW) show structure that was interpreted by Hwang et al. (2004) as indicative of a bipolar jet system. These “jet-like” outflows were also seen by Fesen et al. (2006a) in the Hubble Space Telescope (HST) census of fast-moving optical knots of the intermediate-mass elements N II and O II, further supporting this NE–SW bipolar jet interpretation.
While this “jet-counterjet” structure is clearly a directional outflow associated with the ejecta (and not the result of some pre-existing bipolar cavity in the circumstellar medium; e.g., Blondin et al., 1996), it seems that the outflow was not energetic enough to power the entire explosion (Laming et al., 2006). In addition, the projected motion of the compact object detected in the X-rays (Tananbaum, 1999; Fesen et al., 2006b), thought to be the neutron star or black hole created by the explosion, is perpendicular to the NE–SW outflows. Most jet-powered explosion models predict that the neutron-star kick would be roughly aligned with the jet axis. Furthermore, the Fe-rich outflows are concentrated into two regions in the SE and NW (Hughes et al., 2000; Willingale et al., 2002; Dewey et al., 2007), with the SE outflow blueshifted and the NW outflow redshifted (Willingale et al., 2002). This has given rise to a new picture that there is an axis in the Cas A SNR from the SE to the NW at a position angle of 125∘ aligned with the Fe-rich knots. In this model, the Si-rich structures to the NE and SW are only secondary features caused by instability-powered flows from an equatorial torus (Burrows et al., 2005; Wheeler et al., 2008).
In a recent study, DeLaney et al. (2010) used the technique of Doppler imaging to give the most complete and updated three-dimensional (3D) model. This model is derived from IR (Spitzer), optical (ground-based and HST), and X-ray (Chandra) data. DeLaney et al. (2010) used velocity information from specific spectral features to deproject the structure of the SNR along the radial direction perpendicular to the plane of the sky (see their §2, §3, and §4 for details of the data reduction and deprojection techniques). Their work reveals a very complex 3D structure that can be characterized by a spherical component, a tilted “thick disk,” and multiple ejecta outflows. In their model, the thick disk is tilted from the plane of the sky at an angle of from the E–W axis and from the N–S axis. This thick disk contains all the ejecta structures, including the most prominent outflows that show up best in X-ray Fe K emission, but also appear in other datasets. Infrared emission in the [Ar II] and [Ne II] lines often reveals ring-like structures, which are sometimes seen as broken rings, at the base of these outflows. DeLaney et al. (2010) note that these rings appear at the intersection between the thick-disk structures and a roughly spherical reverse shock. Some of the outflows are bipolar, with oppositely directed flows about the expansion center, while others are not. In particular, the blueshifted emission from the Fe-rich outflow in the SE is clearly collimated, but the corresponding redshifted emission in the NW is not.
The 3D analysis by DeLaney et al. (2010) suggests that the Cas A SN explosion was highly asymmetric, with most of the ejecta flattened in a thick disk that is slightly tilted from the plane of the sky and no prominent structures perpendicular to the plane of the sky. It is possible that this might be due to selection effects, at least to some extent, because limb brightening will make structures close to the plane of the sky easier to detect, but given the quality of the individual datasets, it is unlikely that any prominent outflows along the radial direction would have been missed completely by DeLaney et al. (2010).
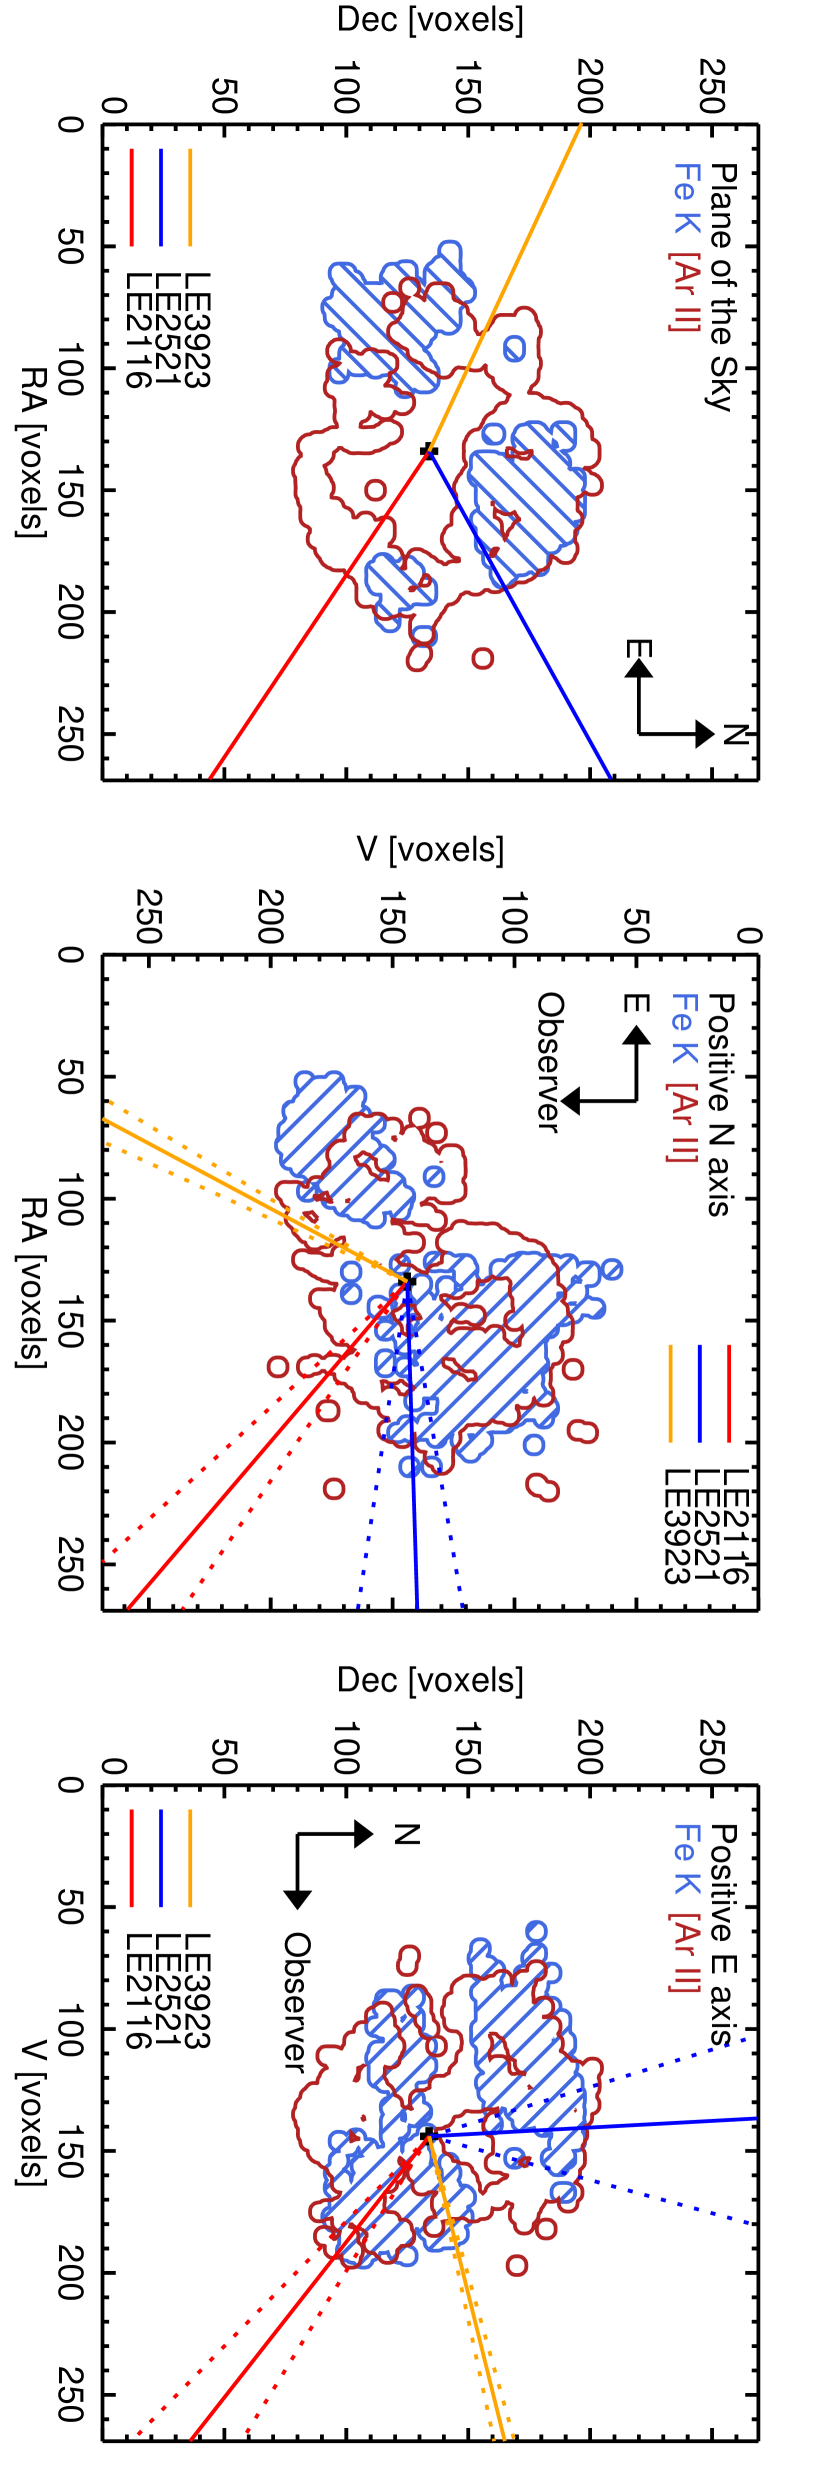
In Figure 7, we superimpose the LoS from our LEs onto three of the [Ar II] and Fe K datasets from DeLaney et al. (2010). The thick disk is apparent in the structure of the SNR as seen from the positive N axis (middle panel of Fig. 7), and (to a lesser extent) the positive E axis (right panel of Fig. 7). Among our observed LEs, LE2116 and LE3923 are sampling LoS away from this disk, and do not intersect any prominent ejecta structures. The LoS of LE2521, on the other hand, intersects the edge of the large complex of Fe K emission in the NW that is at the edge of the thick disk.
6. Discussion
6.1. Systematic Effects
To properly assess differences in the LE spectra, we have compared each LE to light-curve and window-function weighted spectra of well-studied SNe. When assessing the similarities of a LE to another SN, this process is straightforward. However, when comparing different LEs by examining their similarities to other SNe, there are potential systematic effects.
6.1.1 Window Functions and Comparison Objects
When making integrated comparison spectra, the light curve and spectra of that particular SN are used. If that object is not a perfect analog of Cas A, then different window functions can introduce apparent differences between the LEs. As an extreme example, consider two window functions: one which is a top hat only covering the premaximum portion of the light curve, and another top hat only covering the postmaximum portion of the light curve. If the comparison SN had lower line velocities than Cas A before maximum brightness, but similar line velocities after maximum, the comparison spectra would indicate a difference for the two LEs.
For the LEs presented here, the window functions are not significantly different. In Figure 3, we see that the major differences are the contribution of the light curve 50–140 days after maximum brightness. One main source of uncertainty in the window function is caused by the uncertainty in the dust inclination. The dust inclination is derived from the apparent motion. In particular, for faint LEs, the uncertainty in the apparent motion can introduce uncertainties in the inclination of ∘ (Rest et al., 2010). We have not yet fully explored all ways to improve how we determine the dust inclination, and we hope that better modeling will further reduce its uncertainty in the future. Another source of uncertainty is caused by imperfections in the light-echo profile modeling and thus the dust width caused by substructure in the dust. This can be tested with the SN 1987A LEs (Kunkel et al., 1987; Crotts, 1988; Suntzeff et al., 1988), since the spectrophotometric evolution of the SN itself has been monitored extensively. We show in Rest et al. (2010) and Sinnott et al. (2011) that the observed LE profile, apparent motion, and spectra can all be brought in excellent accordance with what is predicted using the SN 1987A spectrophotometric library.
Figure 3 shows how the window functions change the integrated spectra, including a flat window function, corresponding to the full light-curve weighted integrated spectrum. The most significant differences occur at the positions of nebular emission lines, particularly [O I] , 6363, [Ca II] , 7324, and the Ca II NIR triplet.
The H line is most affected by the [O I] feature. For SN 1993J, as [O I] becomes more prominent, it can make the velocity of the minimum of the H absorption appear lower, which may affect our interpretation of this feature for Cas A. However, it does not affect the blue edge of the emission feature. For SN 2003bg, the H absorption is at a higher velocity, coinciding almost exactly with the peak of the [O I] emission. As a result, the differences in window functions do not dramatically change the apparent velocity of the H absorption, but rather just affect its strength.
For both SNe 1993J and 2003bg, the He I feature does not change much with different window functions. There is a noticeable change in the spectra between those with the measured window functions and the full light-curve weighted spectrum. The full light-curve weighted spectrum has a slightly lower velocity for both SNe 1993J and 2003bg.
Although we cannot rule out that the window function has created the differences seen in Cas A, that scenario requires particular tuning. One way this could happen is if Cas A changes from a SN 1993J-like spectrum to a higher-velocity spectrum from about 80 days after maximum, when the window functions for LE2116 and LE3923 are 6 mag below peak, significantly less than the window function of LE2521. In addition, most of the flux at these late phases needs to be in H and He I instead of the nebular emission lines, which is physically unlikely for SNe IIb. Then the integrated spectrum of SN 1993J could show a lower velocity than LE2521 while still having the same velocity for the other directions. Additional comparison objects and LE spectra with different window functions should address this potential systematic effect.
6.2. Connection to Explosion Models
The LE data alone suggest that Cas A was an asymmetric SN. As outlined in §5, this is consistent with observations of the SNR, which indicate the existence of a rich set of multiple outflows (e.g., Hughes et al., 2000; Willingale et al., 2002; Fesen et al., 2006a). The most prominent are bipolar Fe-rich outflows in the SE and NW that are blueshifted and redshifted, respectively. These outflows are approximately (but not exactly) aligned along a single axis through the kinematic center of the SNR (Burrows et al., 2005; Wheeler et al., 2008; DeLaney et al., 2010). The combination of LE and SNR data paint a coherent picture of the SN, and further connect observations to the explosion.
Our detection of blueshifted H and He I emission from the direction of the NW outflow (LE2521) is the first direct connection between significantly higher kinetic energy per unit mass in the SN explosion in one direction and outflows observed in the SNR. Additionally, the NW outflow that seems to be associated with LE2521 is in roughly the opposite direction of the apparent motion of a compact X-ray source, which is presumed to be the resulting neutron star (NS). From the position of the NS relative to the kinematic center of the SNR and the age of the SNR, Fesen et al. (2006a) determined that the object is moving at 350 km s-1 in the plane of the sky with a position angle of . A simple explanation of both the high-velocity ejecta in the direction of LE2521 and the NS kick direction and velocity is an inherently asymmetric explosion.
Although this alignment could be coincidental, it may provide a key clue to understanding core-collapse SN explosions. In particular, these observations indicate that the explosion mechanism may be directly connected to the observed SN — a nontrivial statement considering the size scales between the core and outer envelope of the star.
One model to give the NS a kick is the ejecta-driven mechanism, in which asymmetry in density before the collapse leads to an asymmetric explosion. This gives the protoneutron star a kick in the opposite direction than the ejecta, as in the rocket effect (Burrows & Hayes, 1996; Fryer, 2004). However, if neutrino-driven kicks help drive the supernova explosion, then the strongest ejecta motion can be in the direction of the NS, and opposite the direction of the neutrinos (Fryer & Kusenko, 2006; Socrates et al., 2005).
Numerical models have shown that large asymmetric instabilities can occur near the core during collapse (e.g., Blondin et al., 2003; Burrows et al., 2007; Marek & Janka, 2009). These instabilities can be imprinted on both the SN ejecta and NS by aligning high-velocity ejecta along the same axis as the NS kick. 3D models have only recently been explored, and the models have not been extended to examine the effects of this mechanism on the composition, density, or velocity structure of the ejecta. Nonetheless, these mechanisms are an example of a possible way to directly connect the NS kick with an asymmetric velocity in the ejecta.
To determine if the alignment of the NS kick and higher-velocity ejecta can be physically explained, we perform a simple calculation using the ejecta-driven model. If we assume that in the direction of the NS’s motion the ejecta velocity is the same as in the lower-velocity directions we have measured, and that the momentum of the NS is equal to the excess momentum of the ejecta in the opposite direction, we can measure the mass of ejecta at higher velocity. The velocity difference is 4000 km s-1 for the different LoS. We also assume that . Then we have
| (1) |
For our assumed NS mass, we find that the amount of material moving at the higher velocity would be . This mass estimate assumes that the radial velocity of the NS is zero. Although the radial velocity could be quite large, it is likely of order the transverse velocity, and will not affect our mass estimate by more than a factor of a few. Similarly, we have assumed that the velocity difference in the ejecta is the total velocity difference, but there could be a significant component perpendicular to our line of sight.
Willingale et al. (2003) determined that the Cas A SNR had a total mass of 2.2 M☉ with 0.4 M☉ of fast-moving ejecta having an initial velocity of 15,000 km s-1, consistent with our measured velocity but slightly higher than our estimated mass of high-velocity material. Willingale et al. (2003) claim that 90% of the kinetic energy of the SN was at the highest velocities, which seems inconsistent with SN explosion models. If the Cas A SN explosion was similar to these models, which expect most of the kinetic energy to be at lower velocities (e.g., km s-1), then the lower mass estimate for the high-velocity material seems reasonable. This implies a kinetic energy of erg located in high-velocity material. The estimate of the kinetic energy of Cas A is (2–3) erg (Laming & Hwang, 2003) for an ejected mass of . These values are very similar to those derived for SN 2006aj, the SN Ic associated with the X-ray flash GRB 060218 (e.g., Pian et al., 2006) and which Mazzali et al. (2006) suggested to have been the result of a magnetar event. The analogy with the properties of Cas A and the orientation of the motion of the NS suggests that the Cas A SN may have produced a magnetar. This would justify the higher-than average kinetic energy of Cas A.
A further constraint for explosion models is the different velocities of H, He, and Ca for LE2521 relative to SNe 1993J and 2003bg. SNe 1993J and 2003bg have similar velocities for the Ca II NIR triplet, and both are consistent with that of LE2521. The H velocity of SN 2003bg is significantly larger than that of SN 1993J, and is consistent with that of LE2521. However, SNe 1993J and 2003bg have similar velocities for He I, with SN 2003bg having a slightly larger velocity. Conversely, LE2521 has a much larger He I velocity than that of either comparison object.
There are several ways to explain the velocity structure. First, since all spectra appear to have similar velocities for Ca II, it is likely that the feature is forming in a more symmetric region of the ejecta. The small differences between the LEs and the relatively low velocities of the feature suggest that the Ca-emitting region is more central than that of H or He, and that the central region of the ejecta is more symmetric than the outer layers.
There are several explanations for the He I velocity being higher than that of SN 2003bg, which had the same H velocity of LE2521. In Cas A the H layer may have been extremely thin (thinner than in either SN 1993J or SN 2003bg), causing the H and He velocities to be coincident. Alternatively, the Cas A He layer may be more mixed into the hydrogen layer than in SN 2003bg, causing He I to have a velocity similar to that of H. Finally, the 56Ni distribution may have been different in the two objects, causing a different ionization structure in the outer ejecta.
7. Conclusions
We have obtained optical spectra of LEs from three different perspectives of the Cas A SN, effectively probing different regions of the SN photosphere — the first time that this technique has been applied to a SN. The spectra are very similar to each other and are all similar to the prototypical SN IIb 1993J. After accounting for the window function determined by the combination of dust inclination and slit orientation, we are able to precisely compare Cas A to other SNe as well as compare the LEs to each other. From these comparisons, two of the three directions have spectra which are indistinguishable from that of SN 1993J; however, one direction has He I and H P-Cygni features that are significantly blueshifted ( 4000 km s-1) relative to SN 1993J and the other two directions, indicating a higher ejecta velocity from Cas A in that one direction. This is direct and independent evidence of an asymmetric explosion.
The spectrum for the discrepant LE has an H line profile consistent with that of the high-luminosity SN IIb 2003bg, but its He I line profile had an even higher velocity than that of SN 2003bg. This may indicate that Cas A had a very thin hydrogen layer, significant ejecta mixing, or different ionization structure in this direction. All LE spectra have Ca II NIR triplet line profiles consistent with each other as well as with those of SNe 1993J and 2003bg. This suggests that the emitting region of the Ca is distributed more spherically than that of the H or He-emitting regions.
Even though there seems to be a “jet-like” structure in the NE corner and a counterjet in the SW corner (Hwang et al., 2004; Fesen et al., 2006a), recent optical and X-ray data from the Cas A SNR indicate that the dominant Cas A SN outflow is in the SE at a position angle of 115∘, slightly tilted toward the observer, and its counterpart approximately on the opposite side (Burrows et al., 2005; Wheeler et al., 2008; DeLaney et al., 2010). Our detection of a blueshift looking into the counter outflow in the NW corner is the first direct, unambiguous, and independent confirmation of this outflow. It is also in excellent agreement with the apparent motion of the compact object, which moves at a position angle of (Tananbaum, 1999; Fesen et al., 2006b) away from the center of the SNR.
Finally, we note that the existing surveys for LE features in this portion of the Galactic plane are far from complete, and that additional LEs are very likely to be discovered, providing additional perspectives of the SN in three dimensions. The inventory of such features will further illuminate the degree of asymmetry of the SN, but will also serve the purpose of testing the degree of coherence of spectra from similar perspectives. Since the spectrum at a given dust-concentration location is the result of integration over an entire hemisphere of SN photosphere, spectral differences are expected to vary slowly with changes in the perspective angle.
References
- Aldering et al. (1994) Aldering, G., Humphreys, R. M., & Richmond, M. 1994, AJ, 107, 662
- Ashworth (1980) Ashworth, W. B., J. 1980, Journal for the History of Astronomy, 11, 1
- Badenes et al. (2008) Badenes, C., Hughes, J. P., Cassam-Chenaï, G., & Bravo, E. 2008, ApJ, 680, 1149
- Barbon et al. (1995) Barbon, R., Benetti, S., Cappellaro, E., Patat, F., Turatto, M., & Iijima, T. 1995, A&AS, 110, 513
- Blondin et al. (1996) Blondin, J. M., Lundqvist, P., & Chevalier, R. A. 1996, ApJ, 472, 257
- Blondin et al. (2003) Blondin, J. M., Mezzacappa, A., & DeMarino, C. 2003, ApJ, 584, 971
- Burrows & Hayes (1996) Burrows, A., & Hayes, J. 1996, Physical Review Letters, 76, 352
- Burrows et al. (2007) Burrows, A., Livne, E., Dessart, L., Ott, C. D., & Murphy, J. 2007, ApJ, 655, 416
- Burrows et al. (2005) Burrows, A., Walder, R., Ott, C. D., & Livne, E. 2005, in Astronomical Society of the Pacific Conference Series, Vol. 332, The Fate of the Most Massive Stars, ed. R. Humphreys & K. Stanek, 350
- Chevalier (1986) Chevalier, R. A. 1986, ApJ, 308, 225
- Chornock et al. (2010a) Chornock, R., et al. 2010a, ArXiv e-prints, 1001.2775
- Chornock et al. (2010b) ——. 2010b, ArXiv e-prints, 1001.2775
- Couderc (1939) Couderc, P. 1939, Annales d’Astrophysique, 2, 271
- Crockett et al. (2008) Crockett, R. M., et al. 2008, MNRAS, 391, L5
- Crotts (1988) Crotts, A. 1988, IAU Circ., 4561, 4
- DeLaney et al. (2010) DeLaney, T., et al. 2010, ApJ, 725, 2038
- Dewey et al. (2007) Dewey, D., Delaney, T., & Lazendic, J. S. 2007, in Revista Mexicana de Astronomia y Astrofisica Conference Series, Vol. 30, Revista Mexicana de Astronomia y Astrofisica Conference Series, 84
- Dwek & Arendt (2008) Dwek, E., & Arendt, R. G. 2008, ApJ, 685, 976
- Emmering & Chevalier (1989) Emmering, R. T., & Chevalier, R. A. 1989, ApJ, 338, 388
- Fesen et al. (2006a) Fesen, R. A., et al. 2006a, ApJ, 645, 283
- Fesen et al. (2006b) Fesen, R. A., Pavlov, G. G., & Sanwal, D. 2006b, ApJ, 636, 848
- Filippenko et al. (1994) Filippenko, A. V., Matheson, T., & Barth, A. J. 1994, AJ, 108, 2220
- Filippenko et al. (1993) Filippenko, A. V., Matheson, T., & Ho, L. C. 1993, ApJ, 415, L103
- Foley et al. (2003) Foley, R. J., et al. 2003, PASP, 115, 1220
- Fransson et al. (2005) Fransson, C., et al. 2005, ApJ, 622, 991
- Fryer (2004) Fryer, C. L. 2004, ApJ, 601, L175
- Fryer & Kusenko (2006) Fryer, C. L., & Kusenko, A. 2006, ApJS, 163, 335
- Garg et al. (2007) Garg, A., et al. 2007, AJ, 133, 403
- Hamuy et al. (2009) Hamuy, M., et al. 2009, ApJ, 703, 1612
- Horne (1986) Horne, K. 1986, PASP, 98, 609
- Hughes et al. (2000) Hughes, J. P., Rakowski, C. E., Burrows, D. N., & Slane, P. O. 2000, ApJ, 528, L109
- Hwang et al. (2004) Hwang, U., et al. 2004, ApJ, 615, L117
- Jeffery et al. (1994) Jeffery, D. J., et al. 1994, ApJ, 421, L27
- Kamper (1980) Kamper, K. W. 1980, The Observatory, 100, 3
- Krause et al. (2008) Krause, O., Birkmann, S. M., Usuda, T., Hattori, T., Goto, M., Rieke, G. H., & Misselt, K. A. 2008, Science, 320, 1195
- Krause et al. (2005) Krause, O., et al. 2005, Science, 308, 1604
- Kunkel et al. (1987) Kunkel, W., et al. 1987, IAU Circ., 4316, 1
- Laming & Hwang (2003) Laming, J. M., & Hwang, U. 2003, ApJ, 597, 347
- Laming et al. (2006) Laming, J. M., Hwang, U., Radics, B., Lekli, G., & Takács, E. 2006, ApJ, 644, 260
- Marek & Janka (2009) Marek, A., & Janka, H. 2009, ApJ, 694, 664
- Matheson et al. (2000) Matheson, T., Filippenko, A. V., Ho, L. C., Barth, A. J., & Leonard, D. C. 2000, AJ, 120, 1499
- Maund et al. (2004) Maund, J. R., Smartt, S. J., Kudritzki, R. P., Podsiadlowski, P., & Gilmore, G. F. 2004, Nature, 427, 129
- Mazzali et al. (2009) Mazzali, P. A., Deng, J., Hamuy, M., & Nomoto, K. 2009, ApJ, 703, 1624
- Mazzali et al. (2006) Mazzali, P. A., et al. 2006, Nature, 442, 1018
- Miknaitis et al. (2007) Miknaitis, G., et al. 2007, ApJ, 666
- Oke et al. (1995) Oke, J. B., et al. 1995, PASP, 107, 375
- Park et al. (2007) Park, S., Hughes, J. P., Slane, P. O., Burrows, D. N., Gaensler, B. M., & Ghavamian, P. 2007, ApJ, 670, L121
- Pastorello et al. (2008) Pastorello, A., et al. 2008, MNRAS, 389, 955
- Patat (2005) Patat, F. 2005, MNRAS, 357, 1161
- Pian et al. (2006) Pian, E., et al. 2006, Nature, 442, 1011
- Podsiadlowski et al. (1993) Podsiadlowski, P., Hsu, J. J. L., Joss, P. C., & Ross, R. R. 1993, Nature, 364, 509
- Rest et al. (2007) Rest, A., et al. 2007, in Bulletin of the American Astronomical Society
- Rest et al. (2008a) Rest, A., et al. 2008a, ApJ, 680, 1137
- Rest et al. (2011) Rest, A., Sinnott, B., & Welch, D. L. 2011, in prep.
- Rest et al. (2010) Rest, A., Sinnott, B., Welch, D. L., Foley, R. J., Narayan, G., & Mandel, K. 2010, ArXiv e-prints, 1004.3783
- Rest et al. (2005a) Rest, A., et al. 2005a, ApJ, 634, 1103
- Rest et al. (2005b) ——. 2005b, Nature, 438, 1132
- Rest et al. (2008b) ——. 2008b, ApJ, 681, L81
- Richmond et al. (1996) Richmond, M. W., Treffers, R. R., Filippenko, A. V., & Paik, Y. 1996, AJ, 112, 732
- Richmond et al. (1994) Richmond, M. W., Treffers, R. R., Filippenko, A. V., Paik, Y., Leibundgut, B., Schulman, E., & Cox, C. V. 1994, AJ, 107, 1022
- Roming et al. (2009) Roming, P. W. A., et al. 2009, ApJ, 704, L118
- Ryle & Smith (1948) Ryle, M., & Smith, F. G. 1948, Nature, 162, 462
- Schmidt et al. (1989) Schmidt, G. D., Weymann, R. J., & Foltz, C. B. 1989, PASP, 101, 713
- Sinnott et al. (2011) Sinnott, B., et al. 2011, in prep.
- Smith et al. (2001) Smith, N., Davidson, K., Gull, T., & Ishibashi, K. 2001, in Astronomical Society of the Pacific Conference Series, Vol. 242, Eta Carinae and Other Mysterious Stars: The Hidden Opportunities of Emission Spectroscopy, ed. T. R. Gull, S. Johannson, & K. Davidson, 117
- Smith et al. (2003) Smith, N., Davidson, K., Gull, T. R., Ishibashi, K., & Hillier, D. J. 2003, ApJ, 586, 432
- Socrates et al. (2005) Socrates, A., Blaes, O., Hungerford, A., & Fryer, C. L. 2005, ApJ, 632, 531
- Soderberg et al. (2006) Soderberg, A. M., Chevalier, R. A., Kulkarni, S. R., & Frail, D. A. 2006, ApJ, 651, 1005
- Stephenson & Green (2002) Stephenson, F. R., & Green, D. A. 2002, Historical Supernovae and their Remnants. International Series in Astronomy and Astrophysics, Vol. 5. Oxford: Clarendon Press
- Sugerman (2003) Sugerman, B. E. K. 2003, AJ, 126, 1939
- Suntzeff et al. (1988) Suntzeff, N. B., Heathcote, S., Weller, W. G., Caldwell, N., & Huchra, J. P. 1988, Nature, 334, 135
- Tananbaum (1999) Tananbaum, H. 1999, IAU Circ., 7246, 1
- Wade & Horne (1988) Wade, R. A., & Horne, K. 1988, ApJ, 324, 411
- Wheeler et al. (2008) Wheeler, J. C., Maund, J. R., & Couch, S. M. 2008, ApJ, 677, 1091
- Willingale et al. (2003) Willingale, R., Bleeker, J. A. M., van der Heyden, K. J., & Kaastra, J. S. 2003, A&A, 398, 1021
- Willingale et al. (2002) Willingale, R., Bleeker, J. A. M., van der Heyden, K. J., Kaastra, J. S., & Vink, J. 2002, A&A, 381, 1039