On-line Excited-State Laser Spectroscopy of Trapped Short-Lived Ra+ Ions
Abstract
As an important step towards an atomic parity violation experiment in one single trapped Ra+ ion, laser spectroscopy experiments were performed with on-line produced short-lived 212,213,214Ra+ ions. The isotope shift of the D3/2 - Pand D3/2 - Ptransitions and the hyperfine structure constant of the Pand Dstates in 213Ra+ were measured. These values provide a benchmark for the required atomic theory. A lower limit of ms for the lifetime of the metastable Dstate was measured by optical shelving.
pacs:
11.30.Er, 32.30.Bv, 32.10.Fn, 31.30.GsThe radium ion, Ra+, is a promising candidate for an atomic parity violation (APV) experiment with one single trapped ion Fortson (1993); T. W. Koerber et al. (2003); Sherman et al. (2005); L. W. Wansbeek et al. (2008). APV experiments Fortson (1993); T. W. Koerber et al. (2003); Sherman et al. (2005); L. W. Wansbeek et al. (2008); M. A. Bouchiat et al. (1982); C. S. Wood et al. (1997); Bennett and Wieman (1999); G. Gwinner et al. (2006); G. Stancari et al. (2007); K. Tsigutkin et al. (2009) are sensitive probes of the electroweak interaction at low energy. APV is due to the exchange of the boson between the electrons and the quarks in the atomic nucleus. Its size depends on the mixing angle of the photon and the boson, which is a fundamental parameter of the electroweak theory. The APV signal is strongly enhanced in heavy atoms Bouchiat and Bouchiat (1974) and it is measurable by exciting suppressed (M1, E2) transitions Guéna et al. (2005). The predicted enhancement in Ra+ is about 50 times larger than in Cs atoms L. W. Wansbeek et al. (2008); Dzuba et al. (2001); Pal et al. (2009), for which the most accurate measurement has been performed C. S. Wood et al. (1997); Bennett and Wieman (1999); Porsev et al. (2009). However, laser spectroscopy on trapped Ra+ ions has not been performed yet, and certain spectroscopic information, needed to test the required atomic many-body theory, is lacking L. W. Wansbeek et al. (2008). For instance, the lifetimes of the Dand Dstates, which are important quantities for a single-ion APV experiment, have not been measured yet. These states are also relevant for a potential Ra+ optical clock Dzuba and Flambaum (2000); B. K. Sahoo et al. (2007); Sahoo et al. (2009).
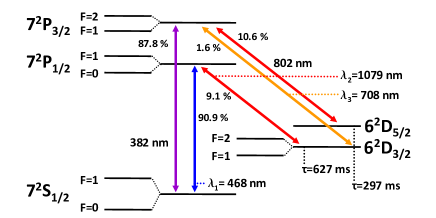
Up to now, accurate experimental information on the optical spectrum of Ra+ (cf. Fig. 1) was only available from measurements at the ISOLDE facility at CERN, where the isotope shift (IS) and hyperfine structure (HFS) of the S, P, and P states were obtained by collinear spectroscopy over a large range of isotopes K. Wendt et al. (1987); E. Arnold et al. (1987). The only absolute measurement of the relevant wavelengths dates back to arc emission spectroscopy performed on 226Ra+ in 1933 Rasmussen (1933). We present here the results of on-line excited-state laser spectroscopy experiments of trapped, short-lived 212,213,214Ra+ ions, obtained at the TRIP facility P. D. Shidling et al. (2009) of the KVI in Groningen. IS and HFS measurements were performed to constrain the atomic theory: HFS is a sensitive probe of the atomic wave functions in the nucleus Dinh et al. (2009), the accuracy of which is important for APV, while experiments on different isotopes serve to cancel remaining uncertainties in the atomic theory L. W. Wansbeek et al. (2008).
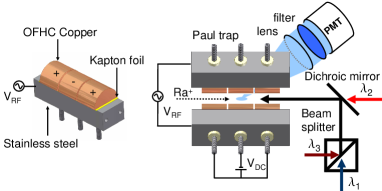
Radium isotopes were produced in inverse kinematics by bombarding an 8.5 MeV/nucleon 206Pb beam of typically particles/s from the AGOR cyclotron on a 4 mg/cm2 diamond-like carbon foil, and emerged from the fusion-evaporation reactions 206Pb + 12C 218-xRa, in which neutrons were liberated. The isotopes 212Ra, 213Ra, and 214Ra were separated from the primary beam and fission products in the magnetic separator G. P. A. Berg et al. (2006). They were stopped and re-ionized to Ra+ in a Thermal Ionizer (TI) P. D. Shidling et al. (2009) with a transmission efficiency of 8%. Rates of 800 212Ra+/s, 2600 213Ra+/s, and 1000 214Ra+/s were extracted as an ion beam with an energy of 2.8 keV. The Ra+ isotopes were passed through a Wien Filter (which eliminated contaminants from the TI), and electrostatically decelerated upon injection in a (N2 or Ne) gas-filled Radio Frequency Quadrupole (RFQ) cooler E. Traykov et al. (2008), operated at a frequency of 500 kHz with a peak-to-peak RF voltage of V applied between neighboring rods; the opposite half-moon-shaped electrodes had a tip distance of 5 mm. For on-line optical spectroscopy, the ions were trapped at the end of the RFQ by suitable axial potentials (Paul trap); cf. Fig. 2. Typically 212Ra+, 213Ra+, and 214Ra+ ions could be stored. The storage time was of order 100 seconds at a residual gas pressure of mbar (the lifetimes for radioactive decay are 13 s, 164 s, and 2.5 s for 212Ra, 213Ra, and 214Ra, respectively). A N2 or Ne buffer gas was used to aid effective catching and trapping of the radioactive particles from the beam in the RFQ. This gas dissipated the large (eV) energies of the ion beam, compressed the trapped cloud, and also enhanced the storage time. The buffer gas influenced the level lifetimes of the ions because of optical quenching and (hyper)fine-structure mixing of the metastable states. Based on Ref. Knoop et al. (1998) it was expected that Ne had the smallest influence on the level lifetimes.
Home-built Extended Cavity Diode Lasers (ECDLs) were used to drive the optical transitions (cf. Fig. 1). Light to drive the S1/2 - Ptransition at wavelength nm came from NDHA210APAE1 laser diodes from Nichia; the D3/2 - Ptransition at wavelength nm was driven with light from a LD-1080-0075-1 diode from Toptica; the D3/2 - Pline at wavelength nm was excited with light from a HL7001MG diode from Opnext. The laser light was delivered to the ion trap with single-mode optical fibers. The beams were overlapped with polarizing beam splitters and a dichroic mirror and sent axially through the trap to minimize scattered light. They were focussed to 1 mm diameter at the trap location. Typical laser beam powers at the trap center were W, W, and W. The wavelengths were monitored with two High-Finesse Angstrom WS6 VIS and IR wavelength meters. Absolute frequency calibration for light at was provided by an absorption line in Te2 at wavelength 468.3185 nm (no. 178 in Ref. Cariou and Luc (CNRS, Paris, 1980)) through linear absorption in a Te2 glass cell at 450 K. Light at was calibrated by linear absorption at the P(146)(2-8) resonance in I2 in a cell at 500 K. Since for wavelength no similar reference was available, it was determined with the IR wavelength meter. The IR wavelength meter was continuously cross-referenced with a high-finesse cavity. The transitions in Ra+ were detected through fluorescence light from the S1/2 - Ptransition at wavelength . Because of the 10% branching into the metastable Dstate, this fluorescence was only observed when both the S1/2 - Pand D3/2 - Ptransitions were resonantly excited. The fluorescence light was imaged with a single lens of focal length mm inside the vacuum through a low-pass filter with 80% transmission for wavelengths shorter than 500 nm (Thorlabs FES0500) onto the photocathode of a photomultiplier (Hamamatsu R7449). The collection solid angle was 0.4 sr.
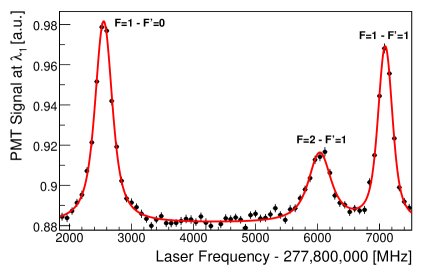
To study the HFS of the D3/2 - Ptransition in 213Ra+ the wavelengths of the light from two diode lasers at were kept close to the resonances S=1 - P’=0 and S=0 - P=1. The frequency of the laser light at was scanned over the resonances. For this measurement N2 buffer gas was used. Collisions admixed the two hyperfine levels of the Dlevel, ensuring that no significant shelving to the metastable D=1 (=2) state occurred when the D=2 (=1) was depopulated by the resonant laser light at . The frequency was calibrated with the IR wavelength meter. The measured line shapes are shown in Fig. 3. The different Lorentzian line-widths are due to saturation effects related to various relaxation rates Budker et al. (2008), here introduced by the buffer gas. The measured HFS splitting 4542(7) MHz for the Pstate is within 2 standard deviations of the value 4525(5) MHz obtained at ISOLDE K. Wendt et al. (1987). For the Dstate the HFS splitting is measured as 1055(10) MHz; the extracted Pand DHFS constants are given in Table 1. The theoretical predictions L. W. Wansbeek et al. (2008); Pal et al. (2009) are in good agreement with the experimental values.
| P | D | |
|---|---|---|
| This work | 4542(7) | 528(5) |
| ISOLDE K. Wendt et al. (1987) | 4525(5) | – |
| Theory L. W. Wansbeek et al. (2008) | 4555111The theoretical uncertainty is at the %-level Timmermans ; Safronova . | 543111The theoretical uncertainty is at the %-level Timmermans ; Safronova . |
| Theory Pal et al. (2009) | 4565111The theoretical uncertainty is at the %-level Timmermans ; Safronova . | 541111The theoretical uncertainty is at the %-level Timmermans ; Safronova . |
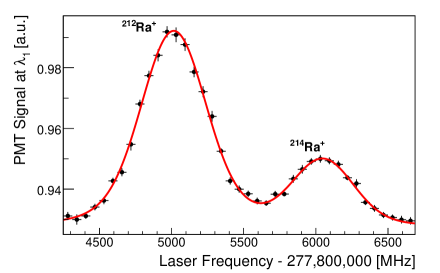
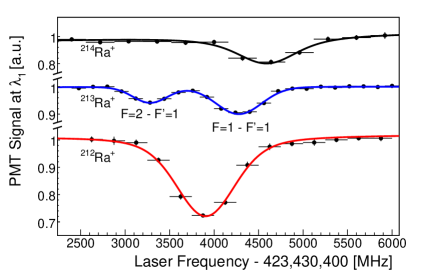
The IS for the D3/2 - Ptransition of Ra+ was obtained with light from two lasers kept close to wavelength . One of these laser beams excited the S1/2 - P transition in 212Ra+, while the other one accessed either the S1/2 - Ptransition in 214Ra+ or the S=1 - P=0 transition in 213Ra+. The frequency of the laser light at was scanned over the D3/2 - Presonances of the isotopes under investigation. A typical spectrum of the D3/2 - Presonances of 212Ra+ and 214Ra+ is shown in Fig. 4. The IR wavelength meter was used for frequency calibration. In order to minimize the influence of the buffer gas on the resonance line shape, only Ne was used. The measurements were performed at gas pressures , , and mbar to study the influence of the buffer gas on the resonance line shapes. No significant effects on the measured IS were found. The resulting IS are summarized in Table 2.
To determine the IS of the D3/2 - Ptransition the lasers operating at and were kept close to resonance of a particular Ra+ isotope. This created a fluorescence cycle. The frequency of the laser light at was scanned over the resonances. Near resonance the ions were pumped to the Pstate, from which some 10% decayed to the Dstate (cf. Fig. 1). In this metastable state the ions were shelved and did not participate in the fluorescence cycle. This caused a dip in the fluorescence signal, the position of which was calibrated against the P(146)(2-8) single-pass absorption resonance in molecular I2 at = MHz. The scan linearity was verified with a high-finesse cavity. We found for the D3/2 - Ptransition = MHz for 212Ra+ and = MHz for 214Ra+.
| 214Ra – 212Ra | 213Ra – 212Ra | 214Ra – 213Ra | |
|---|---|---|---|
| D- P | 1032(5) | 318(11) | 714(12) |
| D- P | 701(50) | 248(50) | 453(34) |
For 213Ra+ the fluorescence cycle was established by pumping on the S=1 - P=0 transition and repumping on the D=1 - P=0 transition. This left the D=2 state largely depopulated. The frequency of the laser light at was scanned over the resonances (cf. Fig. 5). A rate equation model of the system that explicitly takes the (hyper)fine structure mixing caused by the Ne gas into account shows that a small mixing rate already causes several resonances to appear. The D=1 - P=1 resonance is deformed by the close-lying D=2 - P=2 transition. We use the D=2 - P=1 resonance to determine the IS. The measurements were carried out at gas pressures , , and mbar. The power of the laser beam at was varied between 50 and 150 W; no significant changes were found. We found = MHz. The measured isotope shifts are summarized in Table 2. Ref. Rasmussen (1933) measured the absolute frequency of the D3/2 - Ptransition in 226Ra+ as 423,437,660(570) MHz. The value measured here for 212Ra+is 423,434,288(42) MHz. This indicates an IS of 3.4(6) GHz between the two isotopes.
The demonstrated shelving to the Dstate by accessing the D3/2 - Ptransition also enables a measurement of the lifetime of this metastable state. The lasers at and were kept close to resonance in 212Ra+, while the laser light at was pulsed with 170 ms on-periods and 670 ms off-periods by a mechanical chopper wheel. The laser light at was kept on resonance to populate Dvia the Pstate. When the laser light at was switched off, the Dstate depopulated and the ions re-entered the fluorescence cycle with a time constant equal to the lifetime of the Dstate (cf. Fig. 6).
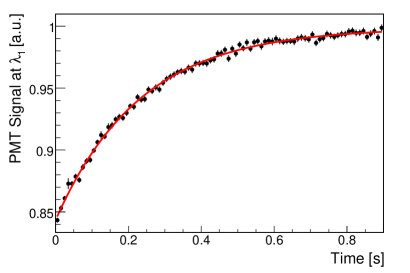
However, the neon buffer gas caused a reduction of the lifetime of the metastable state by quenching it to the ground state. To estimate the effects of the buffer gas, measurements were conducted at different gas pressures ranging from to mbar. The buffer gas was shown to have a strong influence on the optical lifetime. However, no detailed theory for this system is presently available to extrapolate the lifetime to zero pressure. A lower bound on the radiative lifetime of the Dstate was found to be 232(4) ms; it corresponds to the lifetime measured at the lowest pressure of some mbar. Corrections for the radioactive lifetime of 212Ra and for the replacement time can be neglected. Theoretical predictions are 297(4) ms B. K. Sahoo et al. (2007) and 303(4) ms Pal et al. (2009). Our experimental result is an important confirmation that the Dstate is indeed long-lived. This is a necessary property in view of the long coherence times needed in APV experiments with a single trapped ion Fortson (1993).
In conclusion, for the first time on-line excited-state laser spectroscopy was performed on short-lived trapped ions. HFS measurements are suited to test wave functions at the origin, whereas the measurement of radiative lifetimes test them at larger distances. IS measurements probe atomic theory and yield information about the size and shape of the atomic nucleus. These measurements test the atomic theory, the accuracy of which is indispensable for upcoming single-ion APV experiments aiming at an improved low-energy determination of the electroweak mixing angle L. W. Wansbeek et al. (2008). For the refinement of this test, Ra offers a chain of isotopes, where no measurements have been made and where theory is challenged to provide unbiased predictions.
We acknowledge the support received from the AGOR cyclotron group and the KVI technical personnel. O. Böll, O. Dermois, and L. Huisman were essential in the design and the setup of the experiment. We thank R. Hoekstra for useful discussions. This research was supported by the Stichting voor Fundamenteel Onderzoek der Materie (FOM) under Program 114 (TRIP) and FOM projectruimte 06PR2499. O.O.V. acknowledges funding from the NWO Toptalent program.
References
- Fortson (1993) N. Fortson, Phys. Rev. Lett. 70, 2383 (1993).
- T. W. Koerber et al. (2003) T. W. Koerber et al., J. Phys. B 36, 637 (2003).
- Sherman et al. (2005) J. A. Sherman, T. W. Koerber, A. Markhotok, W. Nagourney, and E. N. Fortson, Phys. Rev. Lett. 94, 243001 (2005).
- L. W. Wansbeek et al. (2008) L. W. Wansbeek et al., Phys. Rev. A 78, 050501(R) (2008).
- M. A. Bouchiat et al. (1982) M. A. Bouchiat et al., Phys. Lett. B 117, 358 (1982).
- C. S. Wood et al. (1997) C. S. Wood et al., Science 275, 1759 (1997).
- Bennett and Wieman (1999) S. C. Bennett and C. E. Wieman, Phys. Rev. Lett. 82, 2484 (1999).
- G. Gwinner et al. (2006) G. Gwinner et al., Hyperfine Interact. 172, 45 (2006).
- G. Stancari et al. (2007) G. Stancari et al., Eur. Phys. J. Spec. Top. 150, 389 (2007).
- K. Tsigutkin et al. (2009) K. Tsigutkin et al., Phys. Rev. Lett. 103, 071601 (2009).
- Bouchiat and Bouchiat (1974) M. A. Bouchiat and C. C. Bouchiat, Phys. Lett. B 48, 111 (1974).
- Guéna et al. (2005) J. Guéna, M. Lintz, and M. A. Bouchiat, Mod. Phys. Lett. A 20, 375 (2005).
- Dzuba et al. (2001) V. A. Dzuba, V. V. Flambaum, and J. S. M. Ginges, Phys. Rev. A 63, 062101 (2001).
- Pal et al. (2009) R. Pal, D. Jiang, M. S. Safronova, and U. I. Safronova, Phys. Rev. A 79, 062505 (2009).
- Porsev et al. (2009) S. G. Porsev, K. Beloy, and A. Derevianko, Phys. Rev. Lett. 102, 181601 (2009).
- Dzuba and Flambaum (2000) V. A. Dzuba and V. V. Flambaum, Phys. Rev. A 61, 034502 (2000).
- B. K. Sahoo et al. (2007) B. K. Sahoo et al., Phys. Rev. A 76, 040504(R) (2007).
- Sahoo et al. (2009) B. K. Sahoo, R. G. E. Timmermans, B. P. Das, and D. Mukherjee, Phys. Rev. A 80, 062506 (2009).
- K. Wendt et al. (1987) K. Wendt et al., Z. Phys. D 4, 227 (1987).
- E. Arnold et al. (1987) E. Arnold et al., Phys. Rev. Lett. 59, 771 (1987).
- Rasmussen (1933) E. Rasmussen, Z. Phys. 86, 24 (1933).
- P. D. Shidling et al. (2009) P. D. Shidling et al., Nucl. Instr. Meth. A 606, 305 (2009).
- Dinh et al. (2009) T. H. Dinh, V. A. Dzuba, and V. V. Flambaum, Phys. Rev. A 80, 044502 (2009).
- G. P. A. Berg et al. (2006) G. P. A. Berg et al., Nucl. Instr. Meth. A 560, 169 (2006).
- E. Traykov et al. (2008) E. Traykov et al., Nucl. Instr. Meth. B 266, 4532 (2008).
- Knoop et al. (1998) M. Knoop, M. Vedel, and F. Vedel, Phys. Rev. A 58, 264 (1998).
- Cariou and Luc (CNRS, Paris, 1980) J. Cariou and P. Luc, Atlas du Spectre d‘Absorption de la Molécule de Tellure (CNRS, Paris, 1980).
- Budker et al. (2008) D. Budker, D. F. Kimball, and D. P. DeMille, Atomic Physics (Oxford University Press, 2008).
- (29) R. G. E. Timmermans, private communication.
- (30) M. S. Safronova, private communication.