Observation of , Decays
and Measurement of Polarization
R. Louvot
École Polytechnique Fédérale de Lausanne (EPFL), Lausanne
O. Schneider
École Polytechnique Fédérale de Lausanne (EPFL), Lausanne
T. Aushev
École Polytechnique Fédérale de Lausanne (EPFL), Lausanne
Institute for Theoretical and Experimental Physics, Moscow
K. Arinstein
Budker Institute of Nuclear Physics, Novosibirsk
Novosibirsk State University, Novosibirsk
A. M. Bakich
School of Physics, University of Sydney, NSW 2006
V. Balagura
Institute for Theoretical and Experimental Physics, Moscow
E. Barberio
University of Melbourne, School of Physics, Victoria 3010
A. Bay
École Polytechnique Fédérale de Lausanne (EPFL), Lausanne
K. Belous
Institute of High Energy Physics, Protvino
M. Bischofberger
Nara Women’s University, Nara
A. Bondar
Budker Institute of Nuclear Physics, Novosibirsk
Novosibirsk State University, Novosibirsk
A. Bozek
H. Niewodniczanski Institute of Nuclear Physics, Krakow
M. Bračko
University of Maribor, Maribor
J. Stefan Institute, Ljubljana
T. E. Browder
University of Hawaii, Honolulu, Hawaii 96822
P. Chang
Department of Physics, National Taiwan University, Taipei
Y. Chao
Department of Physics, National Taiwan University, Taipei
A. Chen
National Central University, Chung-li
K.-F. Chen
Department of Physics, National Taiwan University, Taipei
P. Chen
Department of Physics, National Taiwan University, Taipei
B. G. Cheon
Hanyang University, Seoul
C.-C. Chiang
Department of Physics, National Taiwan University, Taipei
I.-S. Cho
Yonsei University, Seoul
Y. Choi
Sungkyunkwan University, Suwon
M. Danilov
Institute for Theoretical and Experimental Physics, Moscow
M. Dash
IPNAS, Virginia Polytechnic Institute and State University, Blacksburg, Virginia 24061
A. Drutskoy
University of Cincinnati, Cincinnati, Ohio 45221
S. Eidelman
Budker Institute of Nuclear Physics, Novosibirsk
Novosibirsk State University, Novosibirsk
P. Goldenzweig
University of Cincinnati, Cincinnati, Ohio 45221
H. Ha
Korea University, Seoul
J. Haba
High Energy Accelerator Research Organization (KEK), Tsukuba
T. Hara
High Energy Accelerator Research Organization (KEK), Tsukuba
Y. Horii
Tohoku University, Sendai
Y. Hoshi
Tohoku Gakuin University, Tagajo
W.-S. Hou
Department of Physics, National Taiwan University, Taipei
Y. B. Hsiung
Department of Physics, National Taiwan University, Taipei
H. J. Hyun
Kyungpook National University, Taegu
T. Iijima
Nagoya University, Nagoya
K. Inami
Nagoya University, Nagoya
R. Itoh
High Energy Accelerator Research Organization (KEK), Tsukuba
M. Iwabuchi
Yonsei University, Seoul
M. Iwasaki
Department of Physics, University of Tokyo, Tokyo
Y. Iwasaki
High Energy Accelerator Research Organization (KEK), Tsukuba
N. J. Joshi
Tata Institute of Fundamental Research, Mumbai
D. H. Kah
Kyungpook National University, Taegu
J. H. Kang
Yonsei University, Seoul
P. Kapusta
H. Niewodniczanski Institute of Nuclear Physics, Krakow
N. Katayama
High Energy Accelerator Research Organization (KEK), Tsukuba
T. Kawasaki
Niigata University, Niigata
C. Kiesling
Max-Planck-Institut für Physik, München
H. J. Kim
Kyungpook National University, Taegu
H. O. Kim
Kyungpook National University, Taegu
J. H. Kim
Korea Institute of Science and Technology Information, Daejeon
M. J. Kim
Kyungpook National University, Taegu
Y. J. Kim
The Graduate University for Advanced Studies, Hayama
K. Kinoshita
University of Cincinnati, Cincinnati, Ohio 45221
B. R. Ko
Korea University, Seoul
P. Kodyš
Faculty of Mathematics and Physics, Charles University, Prague
S. Korpar
University of Maribor, Maribor
J. Stefan Institute, Ljubljana
P. Križan
Faculty of Mathematics and Physics, University of Ljubljana, Ljubljana
J. Stefan Institute, Ljubljana
P. Krokovny
High Energy Accelerator Research Organization (KEK), Tsukuba
T. Kumita
Tokyo Metropolitan University, Tokyo
Y.-J. Kwon
Yonsei University, Seoul
S.-H. Kyeong
Yonsei University, Seoul
J. S. Lange
Justus-Liebig-Universität Gießen, Gießen
M. J. Lee
Seoul National University, Seoul
S.-H. Lee
Korea University, Seoul
J. Li
University of Hawaii, Honolulu, Hawaii 96822
C. Liu
University of Science and Technology of China, Hefei
A. Matyja
H. Niewodniczanski Institute of Nuclear Physics, Krakow
S. McOnie
School of Physics, University of Sydney, NSW 2006
K. Miyabayashi
Nara Women’s University, Nara
H. Miyata
Niigata University, Niigata
Y. Miyazaki
Nagoya University, Nagoya
G. B. Mohanty
Tata Institute of Fundamental Research, Mumbai
M. Nakao
High Energy Accelerator Research Organization (KEK), Tsukuba
H. Nakazawa
National Central University, Chung-li
S. Nishida
High Energy Accelerator Research Organization (KEK), Tsukuba
K. Nishimura
University of Hawaii, Honolulu, Hawaii 96822
O. Nitoh
Tokyo University of Agriculture and Technology, Tokyo
T. Ohshima
Nagoya University, Nagoya
S. Okuno
Kanagawa University, Yokohama
S. L. Olsen
Seoul National University, Seoul
University of Hawaii, Honolulu, Hawaii 96822
P. Pakhlov
Institute for Theoretical and Experimental Physics, Moscow
G. Pakhlova
Institute for Theoretical and Experimental Physics, Moscow
H. Palka
H. Niewodniczanski Institute of Nuclear Physics, Krakow
H. Park
Kyungpook National University, Taegu
H. K. Park
Kyungpook National University, Taegu
R. Pestotnik
J. Stefan Institute, Ljubljana
M. Petrič
J. Stefan Institute, Ljubljana
L. E. Piilonen
IPNAS, Virginia Polytechnic Institute and State University, Blacksburg, Virginia 24061
A. Poluektov
Budker Institute of Nuclear Physics, Novosibirsk
Novosibirsk State University, Novosibirsk
M. Prim
Institut für Experimentelle Kernphysik, Karlsruher Institut für Technologie, Karlsruhe
M. Röhrken
Institut für Experimentelle Kernphysik, Karlsruher Institut für Technologie, Karlsruhe
S. Ryu
Seoul National University, Seoul
H. Sahoo
University of Hawaii, Honolulu, Hawaii 96822
Y. Sakai
High Energy Accelerator Research Organization (KEK), Tsukuba
C. Schwanda
Institute of High Energy Physics, Vienna
A. J. Schwartz
University of Cincinnati, Cincinnati, Ohio 45221
K. Senyo
Nagoya University, Nagoya
M. E. Sevior
University of Melbourne, School of Physics, Victoria 3010
M. Shapkin
Institute of High Energy Physics, Protvino
V. Shebalin
Budker Institute of Nuclear Physics, Novosibirsk
Novosibirsk State University, Novosibirsk
C. P. Shen
University of Hawaii, Honolulu, Hawaii 96822
J.-G. Shiu
Department of Physics, National Taiwan University, Taipei
J. B. Singh
Panjab University, Chandigarh
P. Smerkol
J. Stefan Institute, Ljubljana
A. Sokolov
Institute of High Energy Physics, Protvino
S. Stanič
University of Nova Gorica, Nova Gorica
M. Starič
J. Stefan Institute, Ljubljana
T. Sumiyoshi
Tokyo Metropolitan University, Tokyo
G. N. Taylor
University of Melbourne, School of Physics, Victoria 3010
Y. Teramoto
Osaka City University, Osaka
K. Trabelsi
High Energy Accelerator Research Organization (KEK), Tsukuba
S. Uehara
High Energy Accelerator Research Organization (KEK), Tsukuba
Y. Unno
Hanyang University, Seoul
S. Uno
High Energy Accelerator Research Organization (KEK), Tsukuba
G. Varner
University of Hawaii, Honolulu, Hawaii 96822
K. E. Varvell
School of Physics, University of Sydney, NSW 2006
K. Vervink
École Polytechnique Fédérale de Lausanne (EPFL), Lausanne
C. H. Wang
National United University, Miao Li
M.-Z. Wang
Department of Physics, National Taiwan University, Taipei
P. Wang
Institute of High Energy Physics, Chinese Academy of Sciences, Beijing
J. Wicht
High Energy Accelerator Research Organization (KEK), Tsukuba
E. Won
Korea University, Seoul
B. D. Yabsley
School of Physics, University of Sydney, NSW 2006
Y. Yamashita
Nippon Dental University, Niigata
Z. P. Zhang
University of Science and Technology of China, Hefei
T. Zivko
J. Stefan Institute, Ljubljana
O. Zyukova
Budker Institute of Nuclear Physics, Novosibirsk
Novosibirsk State University, Novosibirsk
Abstract
First observations of the , and decays are reported
together with measurements of their branching fractions: , and ().
From helicity-angle distributions,
we measured the longitudinal polarization fraction in decays to be .
These results are based on a 23.6 fb-1 data sample
collected at the resonance
with the Belle detector at the KEKB collider.
The measurement of exclusive cha
( or ) decays is an important milestone in the study
of the poorly understood decay processes of the meson.
In Refs. A. Drutskoy et al. (2007a) (Belle
Collaboration); A. Drutskoy et al. (2007b) (Belle
Collaboration); J. Wicht et al. (2008) (Belle
Collaboration); R. Louvot et al. (2009) (Belle
Collaboration)
Belle confirmed the large potential of factories for investigations
due to the low multiplicities of charged and neutral particles and high reconstruction
efficiencies.
We have now observed three new exclusive modes
with relatively large branching fractions and neutral particles such as photons or ’s
in their final states.
The leading amplitude for the four and modes
is a tree diagram of order
(in the Wolfenstein parameterization L. Wolfenstein (1983)
of the CKM quark-mixing matrix M. Kobayashi and T. Maskawa (1973)) with a spectator quark.
The study of decays provides useful tests of the
heavy-quark theories that predict, based on an symmetry,
similarities between -meson decay modes
and their corresponding -meson counterparts.
These include the unitarized quark model N.A. Törnqvist (1984),
the heavy quark effective theory (HQET)
J.L. Rosner (1990); B. Block and M. Shifman (1993); A. Deandrea et al. (1993); T. Mannel, W. Roberts and
Z. Ryzak (1991),
and a more recent approach based on chiral symmetry W. Bardeen, E. Eichten and
C. Hill (2003).
Our branching fraction results can be used
to normalize measurements of decays made at
hadron collider experiments, where the number
of mesons produced has a substantial systematic
uncertainty.
The decay is mediated
by the same tree diagram as ,
but with a spectator quark.
The contribution of the strongly suppressed -exchange diagram is
expected to be negligibly small.
Moreover, the helicity amplitudes in decays can be used
to test the factorization hypothesis J.G. Körner and G.R. Goldstein (1979); T. Mannel, W. Roberts and
Z. Ryzak (1991).
The relative strengths of the longitudinal and transverse states can be
measured with an angular analysis of the decay products.
In the helicity basis, the expected differential decay width is
where is the longitudinal polarization fraction,
() are the helicity amplitudes, and
() is the helicity angle of the ()
defined as the supplement of the angle between the and the () momenta
in the () frame.
Here
we report measurements performed with fully reconstructed
, and decays
in a data set corresponding to an integrated luminosity of
fb-1 collected with the Belle detector at
the KEKB asymmetric-energy (3.6 GeV on 8.2 GeV) collider S. Kurokawa and E. Kikutani (2003)
operated at the resonance
( R. Louvot et al. (2009) (Belle
Collaboration)).
The total cross section at the energy has been measured to be
nb A. Drutskoy et al. (2007a) (Belle
Collaboration); G.S. Huang et al. (2007) (CLEO
Collaboration).
Three production modes are kinematically allowed at the :
, , and .
The decays to , emitting a photon with energy .
The fraction of events containing a pair has been measured to be
C. Amsler et al. (2008) (Particle Data
Group).
The fraction of events containing a pair is predominant
and has been measured with events to be
R. Louvot et al. (2009) (Belle
Collaboration).
The number of mesons produced in the dominant production mode
is thus
.
The Belle detector is a large-solid-angle magnetic
spectrometer that consists of a silicon vertex detector,
a central drift chamber (CDC), an array of
aerogel threshold Cherenkov counters (ACC),
a barrel-like arrangement of time-of-flight
scintillation counters (TOF), and an electromagnetic calorimeter
comprised of CsI(Tl) crystals (ECL) located inside
a superconducting solenoid coil that provides a 1.5 T
magnetic field. An iron flux-return located outside of
the coil is instrumented to detect and to identify
muons. The detector is described in detail elsewhere A. Abashian et al. (2002) (Belle
Collaboration).
Reconstructed charged tracks are required to have a maximum impact parameter with respect
to the nominal interaction point of 0.5 cm in the radial direction and 3 cm
in the beam-axis direction.
A likelihood ratio
is constructed using
ACC, TOF and CDC (ionization energy loss) measurements.
A track is identified as a charged pion if
or as a charged kaon otherwise.
With this selection,
the momentum-averaged identification efficiency for pions (kaons) is about (),
while the momentum-averaged rate of kaons (pions) identified as pions (kaons)
is about ().
Photons are reconstructed using ECL energy clusters
within the polar angle acceptance to
that are not associated with a charged track and that have an energy deposit
larger than .
A photon candidate is retained only if the ratio of the energy deposited
in the array of the central cells is
more than 85% of that in the array of cells.
Neutral pions are reconstructed via the decay with photon pairs
having an invariant mass within
of the mass.
A mass-constrained fit is then applied to the candidates.
Neutral kaons are reconstructed via the decay
with no requirements
for the two charged pions.
The candidates are required to have an invariant mass within
of the mass.
Requirements are applied on the vertex displacement from the interaction point (IP)
and on the difference between the flight directions
obtained from the momentum and from the decay vertex and IP.
The criteria are described in detail elsewhere F. Fang .
The (, ) candidates are reconstructed
via the decay (, )
with an invariant mass
within (, ) of their nominal values.
Candidates for are reconstructed in the three modes ,
,
and and are required to have a mass within
of the mass.
The candidates are reconstructed via the decay
by adding a photon candidate to a candidate.
The pair is required to have a mass difference
within of the mass difference.
All mass values are those reported in Ref. C. Amsler et al. (2008) (Particle Data
Group),
and the applied mass windows correspond to around these values;
the mass resolution, , is obtained from MC signal simulations.
The and candidates are reconstructed using two variables:
the beam-energy-constrained mass of the candidate
, and the energy difference
,
where is the four-momentum of the candidate
and is the beam energy, both expressed in the center-of-mass frame.
The two angles and are used as additional observables
for the candidate.
We select candidates with and .
Further selection criteria are developed using Monte Carlo (MC) samples
based on the EvtGen D.J. Lange (2001) event generator
and the GEANT CERN Application Software Group (1993) full-detector simulation.
The most significant source of background is continuum processes,
().
In addition, peaking backgrounds can arise from specific decays.
Using a MC sample of events corresponding
to three times the integrated luminosity,
we find that and events make a significant contribution
to the background in the analysis.
However, they are well separated from the signal in the distribution.
If a decay is combined with an extra photon,
the energy is larger than the signal;
the four charged tracks of a event can be selected
with an additional photon giving a
candidate with a smaller energy.
Similarly, decays give a significant contribution
to the analysis at lower energies.
For the analysis, there is no significant peaking background.
MC studies show that, for the three modes, all the other background sources
(mainly and events) are smooth and small enough to be well
described by the same shape that is used for the continuum.
The contribution of non-resonant decays
is studied by relaxing the mass () requirement
and doing a two-dimensional fit in and (see below).
The signal distribution is then obtained using the sPlot method NIMA_555_356 .
The resulting
spectrum shows no indication of decays
(consistent with results for PRD_50_43 ),
and we neglect this component in our fit.
To improve signal significance, criteria for each of the three modes
are chosen to maximize
,
evaluated in the signal region in the plane.
The expected continuum background, ,
is estimated using MC-generated continuum events corresponding to three times the data.
The expected signal, , and peaking background,
,
are obtained assuming C. Amsler et al. (2008) (Particle Data
Group)
and J.L. Rosner (1990).
The efficiencies of exclusive decays are determined using MC simulations.
To suppress the continuum background,
we use the ratio of the second and zeroth Fox-Wolfram moments G.C. Fox and S. Wolfram (1978), .
This variable has a broad distribution between zero
and one for jet-like continuum events and
is concentrated in the range below for the more spherical signal events.
This property allows an efficient continuum reduction
with a low systematic uncertainty ().
Candidates for ( and )
are required to have ().
This selection rejects (, ) of the background while
retaining (, ) of the (, ) signal.
After the event selection described above, about
15%, 15%, and 28% of
, and candidate events, respectively,
have multiple candidates. We select one
candidate per event according to the following
criteria.
The with the mass closest to the nominal value is preferred.
The formed with the preferred and
with the mass difference closest to the nominal value is preferred.
The candidate with the preferred
and the with the best is retained.
The preferred is the one with the mass
(before the mass-constrained fit) closest to the nominal value
and the with the best .
The () candidate with the preferred ()
and the preferred is retained.
After this selection, in MC signal simulations, 76%, 68% and 51% (64%)
of the selected ,
and longitudinally (transversally) polarized candidates
are correctly reconstructed.
The and signals are extracted from
a two-dimensional unbinned extended maximum likelihood fit R. Barlow (1990)
in and .
The three decays of the
(, and ) are considered.
Each signal probability density function (PDF) is described
with sums of Gaussian or so-called
“Novosibirsk functions” nov ;
the latter function is used to describe the distribution
if it is asymmetrical around its central value.
Each signal PDF is composed of two components with their respective proportions fixed,
representing the correctly and the incorrectly reconstructed candidates.
In a simulated signal event, a candidate is correctly (incorrectly) reconstructed
when the selected decay products do (do not) match the true combination.
The fractions of correctly reconstructed candidates are fixed from MC samples
and their uncertainties are included in the systematic error.
The and resolutions for ( and )
are calibrated by a multiplying factor measured with the R. Louvot et al. (2009) (Belle
Collaboration)
() signal.
The mean values of and for the three production modes (6 parameters)
are related to two floating parameters
corresponding to the and meson masses mas .
The peaking background PDFs are analytically defined and fixed from specific MC samples.
The continuum (together with possible and background) is modeled
with an ARGUS function H. Albrecht et al. (1987) (ARGUS
Collaboration) for and a linear function for .
The endpoint of the ARGUS function is fixed to the beam energy,
while the two other parameters are left free.
All the yields can float.
For the candidates, we perform a four-dimensional fit
using the two observables and in addition to and .
Only the main production mode is considered (),
and three components are used in the likelihood:
the transverse and longitudinal signals, and the background.
We define the PDF for and in the same way as described above,
while the angular distributions are analytically
described with polynomials of order up to five.
The shape parameters are floated for the background PDF
but are fixed for the two signal PDFs.
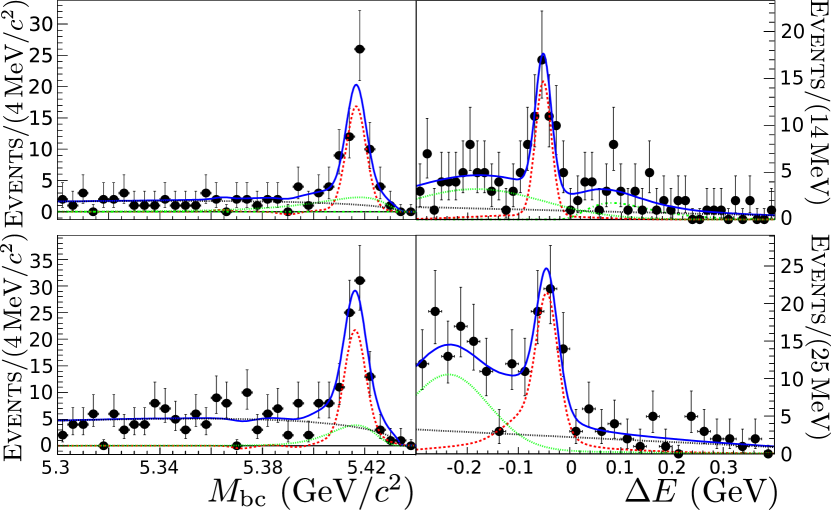
The fitted signal yields are listed in Table 1,
while Figs. 1 and 2 show the observed distributions
in the signal region with the projections of the fit result.
The significance is defined by ,
where () is the value at the maximum
(with the corresponding yield set to zero)
of the likelihood function convolved with a Gaussian distribution
that represents the systematic errors of the yield.
The linearity of the floating parameters in the region near the results
has been extensively checked with MC simulations,
as well as the statistical uncertainty of ,
which lies near the limit of the physically allowed range .
Table 1: Total efficiencies (),
signal yields () with statistical errors,
and significance () including systematic uncertainties,
for the three measured modes.
Mode
Prod. mode
(%)
–
–
–
–
–
–
–
–
–
Longitudinal component
–
Transverse component
–
Figure 1: Left (right): () distributions
for the (top) and (bottom) candidates
with () restricted to the signal region.
The blue solid curve is the total PDF,
while the green (black) dotted curve is the peaking (continuum)
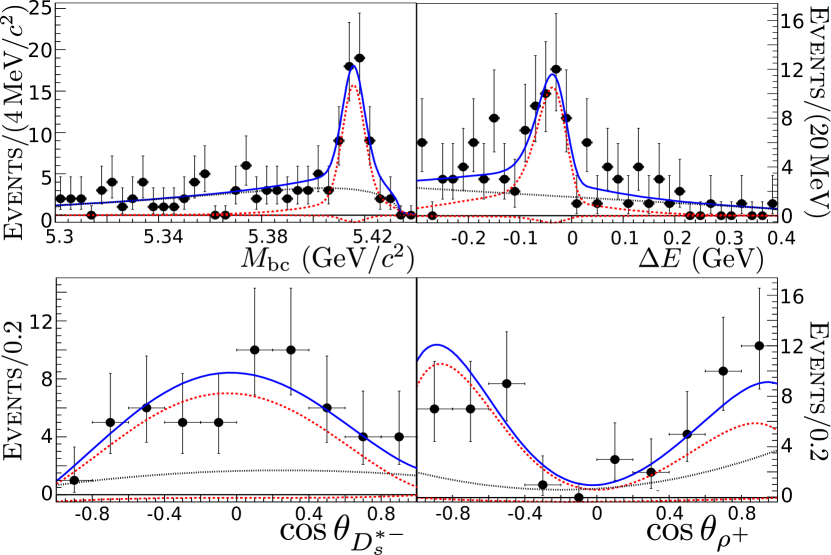
background and the red dashed curve is the signal.Figure 2: Distributions for the candidates.
Top: and distributions, as in Fig. 1.
Bottom: helicity distributions of the (left) and (right)
with and restricted to the kinematic region.
The components of the total PDF (blue solid line) are shown separately:
the black-dotted curve is the background and
the two red-dashed curve are the signal.
The large (small) signal shape corresponds to the longitudinal (transverse) component.
The dominance of the mode is confirmed.
For better precision,
we therefore extract the branching fractions (BF)
using only the yields in this mode.
Table 2 shows the values obtained with the relations
, for the and modes.
The values for and are obtained by floating these two parameters in a fit where
the longitudinal (transverse) yield is replaced by the relation (),
with , and being fixed.
Since the transverse yield fluctuated to a negative central value, .
The common systematic uncertainties on the BF are due to the errors on
the integrated luminosity (1.3%), (4.6%),
(15.0%), (4.3%), the BF (6.4%), the cut (2.0%),
the tracking efficiency (4.0%) and the charged-particle identification (5.4%).
In addition, uncertainties due to the MC statistics (1.6%, 2.3%, 1.5%),
the neutral-particle identification (8.8%, 5.4%, 8.8%)
and the PDF shapes (4.6%, 4.7%, 4.3%)
depend on the (, , ) mode.
The systematic errors on are due to the uncertainties in PDF shapes.
Table 2: Top: measured BF values with statistical,
systematic (without ) and uncertainties,
and HQET predictions from the factorization hypothesis A. Deandrea et al. (1993).
Bottom: BF ratios where several systematic uncertainties cancel out.
We use our previous measurement of R. Louvot et al. (2009) (Belle
Collaboration).
Mode
()
HQET ()
Ratios
Our values for the BF are in good agreement with predictions based on HQET and
the factorization approximation A. Deandrea et al. (1993).
The large value of is consistent with
the value measured for decays S.E. Csorna et al. (2003) (CLEO
Collaboration)
and with the predictions of Refs. J.L. Rosner (1990); A. Ali et al. (1979).
In summary, we report the first observation of
three CKM-favored exclusive decay modes,
we extract their branching fractions, and,
for , we measure the longitudinal
polarization fraction.
Our results are consistent
with theoretical predictions based on HQET A. Deandrea et al. (1993) and
are similar to analogous decay branching
fractions.
The dominance of the unexpectedly large
mode R. Louvot et al. (2009) (Belle
Collaboration) is confirmed.
Acknowledgements.
We thank the KEKB group for excellent operation of the
accelerator, the KEK cryogenics group for efficient solenoid
operations, and the KEK computer group and
the NII for valuable computing and SINET3 network support.
We acknowledge support from MEXT, JSPS and Nagoya’s TLPRC (Japan);
ARC and DIISR (Australia); NSFC (China); MSMT (Czechia);
DST (India); MEST, NRF, NSDC of KISTI, and WCU (Korea); MNiSW (Poland);
MES and RFAAE (Russia); ARRS (Slovenia); SNSF (Switzerland);
NSC and MOE (Taiwan); and DOE (USA).
References
(1)
Unless specified otherwise, charge-conjugated modes are implied
throughout.
A. Drutskoy et al. (2007a) (Belle
Collaboration)A. Drutskoy et al. (Belle
Collaboration), Phys. Rev. Lett.
98, 052001
(2007a).
A. Drutskoy et al. (2007b) (Belle
Collaboration)A. Drutskoy et al. (Belle
Collaboration), Phys. Rev. D
76, 012002
(2007b).
J. Wicht et al. (2008) (Belle
Collaboration)J. Wicht et al. (Belle
Collaboration), Phys. Rev. Lett.
100, 121801
(2008).
R. Louvot et al. (2009) (Belle
Collaboration)R. Louvot et al. (Belle Collaboration),
Phys. Rev. Lett. 102,
021801 (2009).
L. Wolfenstein (1983)
L. Wolfenstein,
Phys. Rev. Lett. 51,
1945 (1983).
M. Kobayashi and T. Maskawa (1973)
M. Kobayashi and T. Maskawa,
Prog. Theor. Phys. 49,
652 (1973);
N. Cabibbo,
Phys. Rev. Lett. 10,
531 (1963).
B. Block and M. Shifman (1993)
B. Block and M. Shifman,
Nucl. Phys. B 389,
534 (1993).
A. Deandrea et al. (1993)
A. Deandrea et al.,
Phys. Lett. B 318,
549 (1993).
T. Mannel, W. Roberts and
Z. Ryzak (1991)
T. Mannel, W. Roberts and Z. Ryzak,
Phys. Lett. B 259,
359 (1991).
W. Bardeen, E. Eichten and
C. Hill (2003)
W. Bardeen, E. Eichten and C. Hill,
Phys. Rev. D 68,
054024 (2003).
J.G. Körner and G.R. Goldstein (1979)
J.G. Körner and G.R. Goldstein,
Phys. Lett. B 89,
105 (1979).
S. Kurokawa and E. Kikutani (2003)
S. Kurokawa and E. Kikutani,
Nucl. Instrum. Methods Phys. Res., Sect. A
499,
1 (2003), and other articles included in this Volume.
G.S. Huang et al. (2007) (CLEO
Collaboration)G.S. Huang et al. (CLEO Collaboration),
Phys. Rev. D 75,
012002 (2007).
C. Amsler et al. (2008) (Particle Data
Group)C. Amsler et al. (Particle Data Group),
Phys. Lett. B 667,
1 (2008).
A. Abashian et al. (2002) (Belle
Collaboration)A. Abashian et al. (Belle
Collaboration), Nucl. Instrum. Methods Phys. Res., Sect. A
479, 117 (2002).
(19)
F. Fang, Ph.D. thesis,
University of Hawaii (2003).
D.J. Lange (2001)
D.J. Lange,
Nucl. Instrum. Methods Phys. Res., Sect. A 462,
152 (2001).
CERN Application Software Group (1993)
CERN Application Software Group
(1993), CERN Program Library, W5013.
(22)
M. Pivk and F.R. Le Diberder,
Nucl. Instrum. Methods A 555,
356 (2005).
(23)
M.S. Alam et al. (CLEO Collaboration),
Phys. Rev. D 50,
43 (1994).
G.C. Fox and S. Wolfram (1978)
G.C. Fox and S. Wolfram,
Phys. Rev. Lett. 41,
1581 (1978).
R. Barlow (1990)
R. Barlow,
Nucl. Instrum. Methods Phys. Res., Sect. A 297,
496 (1990).
(26)
The Novosibirsk function is defined as
with
. The parameters represent the
mean (), the width () and the tail asymmetry ().
(27)
See Table I of Ref. R. Louvot et al. (2009) (Belle
Collaboration) for the detailed
parameterization.
H. Albrecht et al. (1987) (ARGUS
Collaboration)H. Albrecht et al. (ARGUS
Collaboration), Phys. Lett. B
185, 218 (1987).
S.E. Csorna et al. (2003) (CLEO
Collaboration)S.E. Csorna et al. (CLEO
Collaboration), Phys. Rev. D
67, 112002
(2003).
A. Ali et al. (1979)
A. Ali et al.,
Z. Phys. C 1,
269 (1979).