Anisotropic electron spin resonance of YbIr2Si2
Abstract
A series of electron spin resonance (ESR) experiments were performed on a single crystal of the heavy fermion metal YbIr2Si2 to map out the anisotropy of the ESR-intensity which is governed by the microwave field component of the -factor. The temperature dependencies of and were measured for different orientations and compared within the range . The analysis of the intensity dependence on the crystal orientation with respect to both the direction of the microwave field and the static magnetic field revealed remarkable features: The intensity variation with respect to the direction of the microwave field was found to be one order of magnitude smaller than expected from the -factor anisotropy. Furthermore, we observed a weak basal plane anisotropy of the ESR parameters which we interpret to be an intrinsic sample property.
pacs:
76.30.Kg; 75.20.Hr; 71.27.+a; 75.30.Gw1 Introduction
The heavy fermion metal YbIr2Si2 [1] is a rare example of a dense Kondo system that displays a well defined electron spin resonance (ESR) signal well below the Kondo temperature [2]. This unexpected observation, discovered for the first time in YbRh2Si2 [3], initiated a series of theoretical approaches to understand the origin of the ESR line from both an picture of itinerant heavy electrons [4, 5, 6, 7] and a picture of localized Yb3+ spins [6, 8]. The latter is supported by the localized character of the magnetic susceptibility [9] and by the unambiguously local property of the observed ESR line, reflecting a large magnetic anisotropy influenced by the crystalline electric field [2, 10]. Besides the relevance of this ESR line to study locally the physics of Kondo lattices it also provides the possibility to investigate the effect of a large -factor anisotropy on the ESR intensity - a case which, although discussed thoroughly in terms of discriminating field-sweep and frequency-sweep ESR [11, 12], to the best of our knowledge has never been reported for ESR probes in metals. Both, YbRh2Si2 and YbIr2Si2 exhibit a highly anisotropic magnetic response, indicating that Yb3+ moments are forming an easy plane square lattice within the crystallographic basal plane [1, 13]. Recently, the effect of the anisotropy in the Yb-Yb interactions has been considered for the resonant susceptibility within a molecular field model, yielding a satisfying description of the observed temperature dependence of the -factor [14]. In this publication, we concentrate on a detailed investigation of the ESR-intensity of YbIr2Si2 for which, in contrast to YbRh2Si2, the resonance is experimentally observable for fields perpendicular to the basal plane.
2 Experimental Details
For our ESR measurements we used two In-flux grown single crystals of YbIr2Si2 crystallizing in a body centered tetragonal structure (I-type) [1]. A huge residual resistivity ratio () of more than 200 indicates a high sample quality and very little crystalline disorder of the YbIr2Si2 sample [1]. The temperature dependence of the electrical resistivity and the magnetic properties have been thoroughly described elsewhere [1, 9].
ESR detects the absorbed power of a magnetic microwave field as a function of a transverse external static magnetic field . To improve the signal-to-noise ratio, a lock-in technique is used by modulating the static field, which yields the derivative of the resonance signal . All our ESR measurements were performed with a standard Bruker spectrometer at X-band frequencies ( ) and using a cylindrical resonator in TE012 mode. The temperature was varied between using a He-flow cryostat.
We used a platelet-like single crystal where the crystallographic -axis was perpendicular to the platelet. The single crystal had a weight of , a surface area of about and a thickness up to . Figure 1(a) shows this crystal after cutting a circular disc by spark erosion. This reduces the mass to for our measurements where we rotated the disc around its symmetry axis and keeping this axis aligned parallel to . We expect geometry effects in the microwave absorption to be less important for this crystal shape. The spark erosion process did not affect the position, width, and shape of the ESR line.
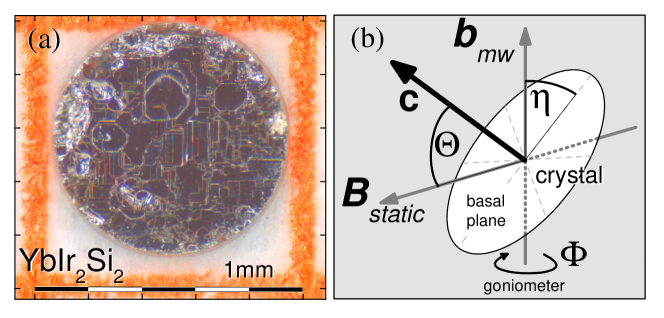
In Figure 1(b) we show the three angles , and introduced for describing the geometry of our measurement. To map the anisotropy we used on the one hand a goniometer to rotate the crystal by an angle around the direction of the microwave field . On the other hand we manually tilted the basal plane by an angle with respect to and affixed the such oriented YbIr2Si2 crystal in paraffin.
For the further discussions we use the indices and for the angles and between the crystallographic fourfold symmetry axis and the direction of the susceptibility component that determines the quantity in question. That means, the indices refer to the orientation of for the ESR-intensity whereas in the -factor they refer to the orientation of .
3 Experimental Results and Discussion
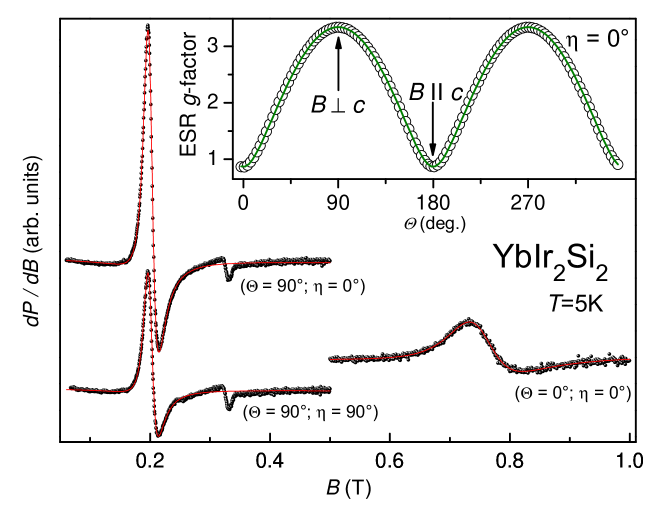
Figure 2 presents examples of ESR signals of YbIr2Si2 at for three special crystal orientation. The line shape, resonance field and linewidth agree with the previously published spectra parameters [2]. At the experimentally detected values are: and . The dependence of the ESR -factor can be nicely fitted with an uniaxial symmetry behavior (line in inset of figure 2) reflecting the tetragonal YbIr2Si2 crystal structure. As one can see by the solid lines, all spectra nicely agree with a metallic Lorentzian, frequently called also Dysonian, because of its shape being identical to a conduction spin resonance in the limit of infinite spin diffusion time [15]. From these fits we determined the ESR parameters linewidth , amplitude and resonance field (as given by the resonance condition ). The ratio , denoting the ratio of dispersion and absorption contributions in the Lorentzian shape, was kept constant, , throughout the entire temperature range. A value is expected if the sample size is much larger than the microwave penetration depth. In our case the penetration depth of YbIr2Si2 at is approximately .
3.1 ESR-intensity and its temperature dependence
The ESR-intensity provides a measure for the static resonant susceptibility , which is determined by the -value component along the direction of the microwave magnetic field [12]:
| (1) |
From the recorded ESR spectra is determined by integrating the absorption curve in the frequency domain [11]. The commonly used ESR setups record spectra by sweeping the magnetic field and leaving the microwave frequency constant. For this case the typical procedure to determine the intensity is also to integrate the field-sweep absorption curve which then yields a quantity by calculating the area under the curve as [15]:
| (2) |
However, for the proper relation between and it is necessary to be aware of the correct conversion between the ESR spectra integrals in the frequency- and field-domain. For systems with an effective spin [11, 12]
| (3) |
where corresponds to the -value component along the static magnetic field that also determines the resonance field via the resonance condition. Hence, especially for systems with large -factor variation as a function of e.g. temperature or sample orientation the ESR intensity must be evaluated using equation (3) for a field-sweep experiment. For YbIr2Si2 one observes a very large -factor anisotropy () as shown in the inset of figure 2. Thus, the dependence of the -factor anisotropy on the intensity becomes important in an angle dependent experiment.
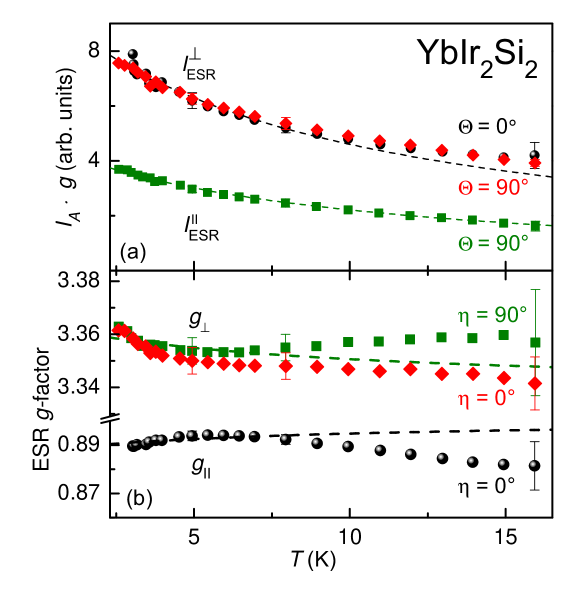
Figure 3(a) shows the temperature dependence of , using the data as shown in frame (b). Note that within the error bars does not depend on (figure 4 bottom panel). For a proper calculation of we took the microwave penetration depth (:electrical conductivity) into account. It is worth to note that according to equation (3) the intensities
are nearly equal, following the same temperature dependence and therefore behave as expected from equation (1) because is parallel to the basal plane in both configurations. The anisotropy of in respect to the angle will be discussed in details in section 3.2.
The dashed lines in figure 3(a) represent Curie-Weiss laws fitting the data between . The resulting Weiss temperatures are: and , i.e., within the experimental error of the intensity data one obtains . However, it is interesting to note that a small difference may be the origin of the weak temperature dependence of below 6K, see figure 3(b). The molecular magnetic field description of the anisotropic Yb-Yb interaction by Huber [14, 16] provides a link between the -factor and the exchange anisotropy which is reflected in :
| (4) | |||||
| (5) |
The dashed lines shown in figure 3(b) represent fits of the -factor temperature dependencies with equations (4) and (5) for . We obtained for the adjustable parameters and . These values reasonably agree with the Yb3+ -factors calculated for the Kramers doublet ground state in the crystal electric field (CEF) of YbIr2Si2 : and [9]. The behavior of for K is obviously inconsistent with the low temperature description according equations (4) and (5). Instead, for instance, excited CEF levels may become relevant as observed in the linewidth temperature dependence [3].
3.2 Anisotropy of the ESR-intensity
We first explore the behavior of the ESR-intensity at by tilting the basal plane by an angle against (see figure 1(b)). At the same time we carefully checked that the -axis is always perpendicular to the direction of the static magnetic field (i.e. ).
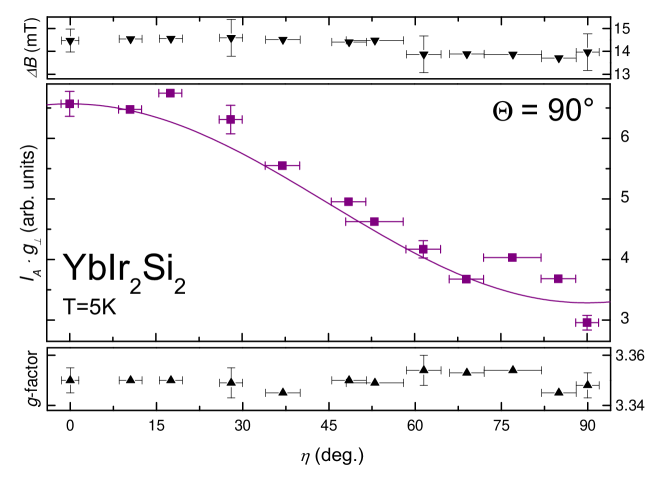
As shown in the upper and lower frame of figure 4 the linewidth and the -factor remain almost constant for this geometry of the measurement. This means that the amplitude of the absorption curve is the only parameter to determine ( was kept constant for fitting the lineshape). The main frame of figure 4 shows the dependence of with a periodicity of . According to equation (1) the ESR-intensity is related to the -value component along the microwave magnetic field . Hence, and and the axial symmetry angular dependence reads . As shown by the solid line this equation describes the data with a ratio . However, from the -values one would expect for the ratio . This discrepancy cannot be justified by experimental errors and is also found for the system YbRh2Si2 where the difference is even much larger: as compared to the experimental value of . At this point, we do not have any sound explanation for this discrepancy.
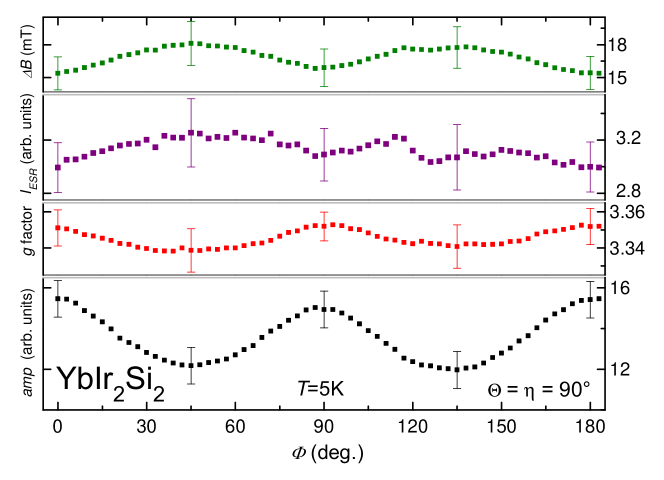
Finally we discuss the behavior of the ESR parameters by rotating the YbIr2Si2 crystal around its -axis by an angle , leaving the angles constant. For this configuration we used the disc-shaped single crystal shown in figure 1(a) where the -axis is pointing perpendicular to the disc plane. With this geometry the influence on the microwave field distribution should be minimized for the rotation. We expect that the large -factor anisotropy should neither be reflected in the resonance field nor in the intensity because the magnetic fields and are always aligned perpendicular to the -axis or the crystallographic basal plane, respectively (compare figure 1(b)). Indeed, as shown in figure 5, both -factor (as determined by the resonance field) and show only small variations which are consistent with a constant value within experimental accuracy. However, the -periodicity of the anisotropy of -factor, linewidth and the signal amplitude is remarkable and is even exceeding the experimental error in the case of . This observation should not originate from sample geometry effects which are minimized by using a disc-shaped crystal. Also, we could confirm this anisotropy with a TE102 rectangular resonator that has a different microwave resonant mode. Moreover, it is worth to note that the minima of the linewidth correlate with the -factor maxima. Therefore, the anisotropic features point to a sample property although this effect is very weak and was not recognized in previous measurements: the -value variation shown in figure 5 is three orders of magnitude smaller than in the usual case of rotation shown in figure 2.
In order to explain the -periodicity of the -value one may assume a fourfold symmetry of a directional distribution of the -axes in respect to the rotation axis. This consideration holds only true if the spread of the -axes orientations of our crystal is as estimated from the observed -factor variation of . However, the crystal mosaicity determined by a Laue-procedure shows a maximum deviation of from the expected -direction. Hence, only a weak intrinsic basal plane anisotropy of the -value of YbIr2Si2 should be a plausible explanation of the --periodicity. It indicates the influence of the off-diagonal crystalline electric field parameters, i.e. and which, for instance, are needed to describe -factor anisotropies in cubic crystal symmetry [17].
4 Summary
We presented a detailed study of the anisotropy of the ESR signal on a YbIr2Si2 crystal at a constant X-band frequency of . As we used a standard field-sweep setup a proper determination of signal intensity is required to take the large -factor anisotropy into account. This leads to a basal plane intensity which is independent from the angle between crystalline c-axis and external magnetic field. Moreover, we found an almost perfect agreement in the temperature dependences of for and . The temperature dependence of the -factors anisotropies suggests a weak exchange anisotropy which is consistent with the behavior of within a molecular field treatment [14]. Furthermore, we obtained a remarkable result that is not expected for strongly anisotropic -factors of the Yb3+-ESR: a rotation of the basal plane by the angle respective the microwave field direction yields a much smaller change of than expected from the -factor anisotropy. Another interesting behavior was found when leaving the crystalline symmetry axis oriented with fixed angles respective to the external field: then the rotation of the crystalline sample still showed a -periodicity in the ESR line parameters indicating the influence of the off-diagonal crystalline electric field parameters.
Acknowledgements
We thank Dave Huber and Elihu Abrahams for fruitful discussions which stimulated large parts of our investigations. We acknowledge the Volkswagen foundation (I/84689) for financial support.
References
- [1] Hossain Z, Geibel C, Weickert F, Radu T, Tokiwa Y, Jeevan H, Gegenwart P and Steglich F 2005 Phys. Rev. B 72 094411
- [2] Sichelschmidt J, Wykhoff J, H-A Krug von Nidda, Fazlishanov I I, Hossain Z, Krellner C, Geibel C and Steglich F 2007 J. Phys. Cond. Mat. 19 016211
- [3] Sichelschmidt J, Ivanshin V, Ferstl J, Geibel C and Steglich F 2003 Phys. Rev. Lett. 91 156401
- [4] Abrahams E and Wölfle P 2008 Phys. Rev. B 78 104423
- [5] Wölfle P and Abrahams E 2009 Phys. Rev. B 80 235112 (pages 8)
- [6] Schlottmann P 2009 Phys. Rev. B 79 045104
- [7] Zvyagin A A, Kataev V and Büchner B 2009 Phys. Rev. B 80 024412
- [8] Kochelaev B I, Belov S I, Skvortsova A M, Kutuzov A S, Sichelschmidt J, Wykhoff J, Geibel C and Steglich F 2009 Eur. Phys. J. B 72 485–489
- [9] Kutuzov A, Skvortsova A, Belov S, Sichelschmidt J, Wykhoff J, Eremin I, Krellner C, Geibel C and Kochelaev B 2008 J. Phys. Cond. Mat. 20 455208
- [10] Sichelschmidt J, Wykhoff J, von Nidda H A K, Ferstl J, Geibel C and Steglich F 2007 J. Phys. Cond. Mat. 19 116204
- [11] Aasa R and Vänngård T 1975 J. Magn. Res. 19 308
- [12] Pilbrow J R 1984 J. Magn. Res. 58 186
- [13] Trovarelli O, Geibel C, Mederle S, Langhammer C, Grosche F M, Gegenwart P, Lang M, Sparn G and Steglich F 2000 Phys. Rev. Lett. 85 626
- [14] Huber D L 2009 J. Phys. Cond. Mat. 21 322203
- [15] Wykhoff J, Sichelschmidt J, Lapertot G, Knebel G, Flouquet J, Fazlishanov I I, Krug von Nidda H A, Krellner C, Geibel C and Steglich F 2007 Science Techn. Adv. Mat. 8 389
- [16] Holanda L, Duque J, Bittar E, Adriano C, Pagliuso P, Rettori C, Hu R, Petrovic C, Maquilon S, Fisk Z, Huber D and Oseroff S 2009 Physica B 404 2964 – 2968
- [17] Abragam A and Bleaney B 1970 Electron Paramagnetic Resonance of Transition Ions (Oxford: Clarendon Press)