789\Yearpublication2006\Yearsubmission2005\Month11\Volume999\Issue88
later
Sulphur abundances in halo stars from Multiplet 3 at 1045 nm††thanks: Using data from CRIRES at the ESO-VLT, Programme 079.D-0434.
Abstract
Sulphur is a volatile -element which is not locked into dust grains in the interstellar medium (ISM). Hence, its abundance does not need to be corrected for dust depletion when comparing the ISM to the stellar atmospheres. The abundance of sulphur in the photosphere of metal-poor stars is a matter of debate: according to some authors, [S/Fe] versus [Fe/H] forms a plateau at low metallicity, while, according to other studies, there is a large scatter or perhaps a bimodal distribution. In metal-poor stars sulphur is detectable by its lines of Mult. 1 at 920 nm, but this range is heavily contaminated by telluric absorptions, and one line of the multiplet is blended by the hydrogen Paschen line. We study the possibility of using Mult. 3 (at 1045 nm) for deriving the sulphur abundance because this range, now observable at the VLT with the infra-red spectrograph CRIRES, is little contaminated by telluric absorption and not affected by blends at least in metal-poor stars. We compare the abundances derived from Multiplets 1 and 3, taking into account NLTE corrections and 3D effects. Here we present the results for a sample of four stars, although the scatter is less pronounced than in previous analysis, we cannot find a plateau in [S/Fe], and confirm the scatter of the sulphur abundance at low metallicity.
keywords:
stars: abundances - Galaxy: halo - stars: atmospheres1 Introduction
The light elements between O and Ti of even atomic number are referred to as -elements because they are mainly produced by successively adding an -particle from nucleus to nucleus. Among them is sulphur, a volatile element which is not locked into dust in the interstellar medium (ISM), so that the sulphur abundance derived for the ISM can be directly compared to the sulphur abundance derived in stars.
The -elements are crucial probes of the chemical evolution of a stellar population: they are almost exclusively released by Type II Supernovae, while the iron peak elements are produced by Type II SNe, but also, in large amounts, by Type Ia Supernovae. Progenitors of Type II and Type Ia supernovae have very different lifetimes, making the abundance ratio of -elements to iron-peak elements a powerful diagnostic of the chemical evolution and star formation history of a galaxy. In the Milky Way, stars of lower metallicity are characterised by higher to iron abundance ratios than found in the Sun and stars of solar metallicity. This is usually interpreted in terms of the lower contribution of Type Ia SNe. Systems which are characterised by low or bursting star formation, like dwarf Spheroidal galaxies, give time to Type Ia SNe to explode before the enrichment due to Type II SNe has greatly increased. Consequently such systems display rather low to iron ratios even at low metallicities. Thus the abundance of -elements is an important property of any stellar population. For the study of chemical evolution in external galaxies, the more readily available objects are Blue Compact galaxies (BCGs) through analysis of the emission line spectra, and Damped Ly systems (DLAs) through the analysis of resonance absorption lines. In both groups of objects, sulphur is relatively easy to measure in the form of ISM emission (for the BCGs) or absorption (for the DLAs) lines.
The investigation of sulphur abundances in the stellar photospheres started with the pioneering work of Wallerstein & Conti (1964). They determined the sulphur abundance in six stars out of a sample of nine stars in six Galactic Clusters. Later on, Clegg, Tomkin, & Lambert (1981) determined the sulphur content in 20 F- G-type stars with [Fe/H], while François (1987, 1988) studied 13 and 12 metal-poor stars, respectively.
Not many sulphur lines are available in the observed stellar spectra. There is a forbidden line from the ground level of S i at 1082.1 nm, which is weak, blended, but for which lower and upper level populations are very close to local thermal equilibrium (LTE). This absorption line is measurable in the spectrum of solar-like stars (Ryde, 2006). However, it becomes undetectable below [Fe/H]. The permitted Mult. 8 at 675 nm is weak, but not blended, neither contaminated by telluric absorption. For these transitions the assumption that high and low levels are in LTE is a good approximation, and the same holds for the lines of Mult. 6 at 869 nm (Takada-Hidai et al., 2002). Both Multiplets 6 and 8 are weak, as a consequence detectable only in stars of solar, or moderately sub-solar metallicity (down to [Fe/H]). Below such metallicity, usually Mult. 1 at 920 nm is used, which is, on the other hand, contaminated by telluric absorption. Moreover one of the lines of the triplet (922.8 nm) is located in the blue wing of the hydrogen Paschen line, and the presence of the hydrogen line makes the abundance determination more difficult.
The infra-red lines of Mult. 3 at 1045 nm are well suited to measure the sulphur abundance. These lines are not as strong as the components of Mult. 1, but easily detectable in very metal-poor stars. No blend has to be taken into account in the case of metal-poor stars because the only extra line present in the range, the Fe i line at 1045.5 nm blending the strongest S i line of the triplet, vanishes at sub-solar metallicity. Telluric absorptions in this range are less abundant and less strong than in the case of Mult. 1. Observing the 1045 nm sulphur lines provides thus a possibility to obtain a reliable sulphur abundance in very metal-poor stars.
Caffau et al. (2005) analysed the sulphur abundance in a sample of Galactic stars. They investigated, when available, the lines of Multiplets 6, 8, and 1. Because of the blend of the 922.8 nm S i line of Mult. 1 with the hydrogen Paschen , they performed line profile fitting to derive the sulphur content for all the lines available. The line profile fitting procedure permitted to reproduce the line profile of the hydrogen. In their study they have suggested that in the range [Fe/H] the [S/Fe] ratio shows either a large scatter or a bimodal behaviour. Most of the stars lie on a “plateau” at about [S/Fe]=+0.4, while a non negligible number of stars shows a “high” value of [S/Fe], around +0.8. This behaviour has no proposed interpretation, but it may be supposed to be due to systematic errors affecting only the analysis of Mult. 1. In fact, in the sample of Caffau et al. (2005), the determination of [S/Fe] in this range of metallicity is based mainly on the non contaminated lines of Mult. 1. On the other hand, Nissen et al. (2004) and Nissen et al. (2007) derived the sulphur abundance from equivalent width (EW) measurements of the lines of multiplets 8 and 1, and they find a plateau at low metallicity in the [S/Fe] versus [Fe/H] plot, with no sign of bimodal distribution or scatter. It is therefore of great interest to verify this puzzling finding by the use of an independent and, probably better, diagnostic of the sulphur abundances, as can be afforded by the 1045 nm lines.
2 Model atmospheres and atomic data
This analysis was performed by means of 1D hydrostatic model atmospheres. We then applied NLTE corrections taken from Takeda et al. (2005) and 3D corrections derived by means of CO5BOLD 3D hydrodynamical models (Freytag, Steffen, & Dorch, 2002; Wedemeyer et al., 2003). The 1D model atmospheres used to derive the sulphur abundance were obtained from the Linux version of ATLAS, as described in Sbordone et al. (2004). To derive the 1D-LTE abundance of sulphur we measured the equivalent widths (EW) with the IRAF task splot and derived abundances through WIDTH (for details see Kurucz, 1993, 2005; Castelli, 2005).
The 3D-CO5BOLD models used to compute the 3D-corrections (listed in Table 1) are taken from the CIFIST grid (Ludwig et al., 2009). For each 3D model, we used as reference model the 1D model obtained as the horizontal average of each 3D snapshot over surfaces of equal (Rosseland) optical depth, and the 1D hydrostatic model computed with the LHD code with the same atmospheric parameter as the 3D model. Both these 1D models share the micro-physics and radiative transfer scheme with CO5BOLD. A description of these models can be found in Caffau & Ludwig (2007). We computed 3D corrections as described in Caffau & Ludwig (2007) and in Caffau et al. (2010).
The 3D corrections are given in Table 4 in the case of a micro-turbulence of 1.5 used in the 1D reference model. in column 7 takes into account the effects of granulation, meaning the influence that the horizontal fluctuations around the mean stratification have on the abundance determination. in column 8 accounts for the total 3D effect, meaning both the effect of horizontal fluctuations and the different mean temperature structure due to the different treatment of convection in 3D hydrodynamical models and in 1D mixing-length models.
| Model | Teff | log g | [Fe/H] | t | Box-size |
|---|---|---|---|---|---|
| K | h | km3 | |||
| d3t50g35mm10n01 | 4930 | 3.5 | –1.0 | 117 | |
| d3t50g35mm20n01 | 4980 | 3.5 | –2.0 | 151 | |
| d3t50g45mm10n03 | 5060 | 4.5 | –1.0 | 18 | |
| d3t59g35mm20n01 | 5860 | 3.5 | –2.0 | 31 | |
| d3t59g35mm30n01 | 5870 | 3.5 | –3.0 | 31 | |
| d3t59g45mm20n01 | 5920 | 4.5 | –2.0 | 7 |
The atomic data of the S i lines of Mult. 3, the same as in Caffau et al. (2007), are summarised in Table 2.
| Transition | |||
|---|---|---|---|
| (nm) air | (eV) | ||
| 1045.5449 | 0.26 | 6.86 | |
| 1045.6757 | –0.43 | 6.86 | |
| 1045.9406 | 0.04 | 6.86 |
3 Analysis of CRIRES data
We observed four metal-poor dwarf stars with CRIRES (Kaeufl et al., 2004). The observations, programme 079.D-0434 (E. Caffau), have been carried out in service mode, for details see Table 3. The spectra were observed using detector integration times of 30 s or 10 s (for the brighter stars), the total integration time for each star is given in Table 3. The observation template employed, required nodding along the slit, with an amplitude of 10′′. The A0 star HIP 28910 was also observed, to check the position of telluric lines.
The analysis was conducted using the extracted, combined and calibrated spectra provided by ESO. We compared this data with that obtained for one star by running a set of reduction routines based on the ESO CRIRES pipeline 1.6.0, but did not find any significant difference with respect to the reduced data provided by ESO.
| Star | J | date | total integration time |
|---|---|---|---|
| mag | s | ||
| BD | 7.62 | 24-07-2007 | 2 2160 |
| HD 140283 | 6.01 | 24-07-2007 | 300 |
| HD 165195 | 4.89 | 24-07-2007 | 400 |
| HD 181743 | 8.62 | 19-06-2007 | 2160 |
| 23-07-2007 | 2160 | ||
| HD 211998 | 4.15 | 22-07-2007 | 160 |
Our sample consisted of four Galactic stars from the sample of Caffau et al. (2005). Three of them, BD , HD 181743, and HD 211998, have been analysed by Caffau et al. (2005), and the sulphur abundance derived is the one in Table 4. HD 181743 has also been analysed by Nissen et al. (2004). As stellar parameter Teff/[Fe/H] they determined 5863 K/4.32/–1.93, and their sulphur abundance was A(S)=5.61, in agreement, within errors with our result.. HD 211998 has also been analysed by Israelian & Rebolo (2001) and François (1987). Israelian & Rebolo (2001) derived A(S)=5.80 with the stellar parameters Teff//[Fe/H] of 5271 K/3.36/–1.25. The difference of more than 0.3 dex with respect to our result is anyway compatible within errors, in fact for this star their error is about 0.3 dex. We stress also a difference of 0.3 dex in metallicity. Our analysis is in close agreement with the one of François (1987), who finds A(S)=6.20. For HD 140283 the values in Table 4 are from Nissen et al. (2004).
Our goal was to understand if Mult. 3 can be used in order to derive the sulphur abundance in metal-poor stars. It could be that the large scatter in [S/Fe] at low metallicity described in Caffau et al. (2005) is due to systematic effects arising from the use of one specific S i multiplet for abundance determination. A sample of 4 stars is insufficient to firmly establish whether this is the case or not, but it can provide useful insights to direct further research.
The stellar parameters for the stars of our sample are taken from Caffau et al. (2005) and are summarised in columns 2-4 of Table 4. In column 5 the 1D-LTE abundance with the uncertainty related to the EW measurement is given. While in Caffau et al. (2005) no NLTE correction was applied, here NLTE corrections are interpolated in the table of Takeda et al. (2005) and are listed in column 6 of Table 4. The 3D corrections for each star are given in column 7 and 8. In column 9 [S/Fe] is given; both NLTE and 3D corrections are applied. We adopt A(S)=7.16 for the solar sulphur abundance, as described in Caffau et al. (2010). In column 10 the sulphur abundance from Caffau et al. (2005) is reported, and in column 11 there is the relative NLTE correction from Takeda et al. (2005). The comparison in [S/Fe] is not straightforward. To derive the [S/Fe] given in column 9 of Table 4, both NLTE and 3D- corrections are applied. As one can see in the Table, these two corrections roughly cancel each other, so that the abundance we derive is close to the abundance obtained after the application of NLTE and 3D corrections. Another difference with respect to Caffau et al. (2005) is the solar reference abundance, in this analysis, while Caffau et al. (2005) adopted from Anders & Grevesse (1989). For this reasons we suggest to compare the A(S) 1D-LTE obtained in this work and in Caffau et al. (2005), in column 4 and 10 of Table 4 respectively.
| Star | Teff | [Fe/H] | A(S)-1D LTE | [S/Fe] | A(S)C05 | |||||
|---|---|---|---|---|---|---|---|---|---|---|
| K | Mult. 3 | |||||||||
| (1) | (2) | (3) | (4) | (5) | (6) | (7) | (8) | (9) | (10) | (11) |
| BD | 5020 | 4.61 | –1.19 | –0.02 | 0.03 | 0.05 | –0.03 | |||
| HD 140283 | 5690 | 3.69 | –2.42 | –0.15 | 0.00 | 0.08 | –0.16 | |||
| HD 181743 | 5970 | 4.40 | –1.81 | –0.07 | 0.02 | 0.13 | –0.04 | |||
| HD 211998 | 5210 | 3.36 | –1.56 | –0.12 | 0.06 | 0.12 | –0.19 |
u: upper limit from this work
C05: Caffau et al. (2005)
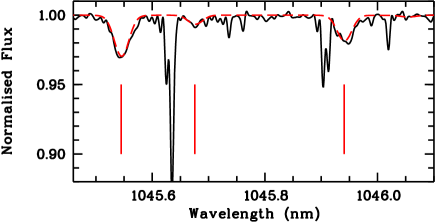
For star BD , the “high” sulphur abundance derived in Caffau et al. (2005) is here confirmed. The difference of 0.16 dex between the two analysis is large but within the errors. The same is true for HD 211998: for this star the NLTE correction for Mult. 1 is 0.07 dex larger than for Mult. 3. For HD 140283 the two analyses are in good agreement. In Fig. 1 we show the observed spectrum (solid-black line) of HD 140283 compared to an ATLAS+SYNTHE synthetic spectrum (dashed-red line). For star HD 181743 we find a difference between this analysis and the results of Caffau et al. (2005) larger than expected from the error bars. The previous analysis relied on Mult. 6, the observed spectrum was observed with UVES@VLT, with resolution of 43 000, dichroic #2 and cross disperser #4. In this spectrum a line was clearly visible at the wavelength of the Mult. 6, with a FWHM compatible with the iron line close by. The spectrum showed no fringing as suggested by Nissen et al. (2007). A possible explanation for the presence of this line is that it is a contribution of the sky, not perfectly subtracted. In fact at the time of that observation the Moon was bright (68% illumination) and close to the star ( distance). Due to the large discrepancy we found with the analysis of the lines of Mult. 3, we reduced the archival UVES spectra of this star taken during ESO programmes 67.B-0474(A) (P. I. Holmberg) as well as 67.D-0106(A) (P.I. Nissen). In the first programme a single 600’,s, R60000 spectrum was produced with CD #3, while in the second case a set of 400 s, R60000 spectra were produced with image slicer #1 and CD #2. With these data we cannot detect the Mult. 6 and are only able to give an upper limit for the sulphur abundance, which is reported in Table 4. We confirm the result of Nissen et al. (2007) about the Mult. 6, and find a sulphur abundance from Mult. 3 very close to their value. In fact, according to their LTE analysis, [S/Fe]=0.29 with , while we find [S/Fe] with .
4 Discussion
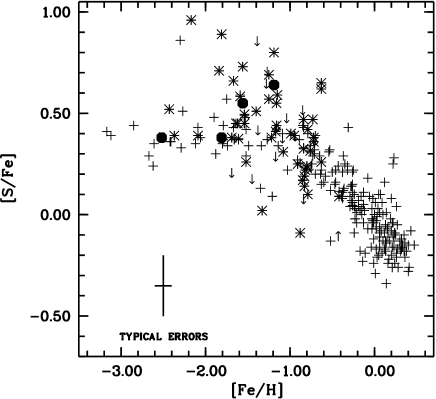
Caffau et al. (2005) derived the sulphur abundance in a sample of metal-poor stars and included in their analysis the results available in the literature for a large number of Galactic stars. Their complete sample spans a wide range in metallicities, from solar to 1/1000 of the solar metallicity. As visible in their figure 10, the S abundance, as a function of the stellar iron content, has a negative trend for stars of solar metallicity or for slightly metal-poor stars ([Fe/H]). For low metallicity ([Fe/H]) a large scatter or a bimodal behaviour is visible. This trend, which at the moment has no physical explanation, could have been attributed either to the fact that the sulphur abundance in metal-poor stars was mainly derived from the S i lines of Mult. 1 where telluric absorption can be a problem, or to the neglect of NLTE effects. NLTE effects are not very large, about –0.1 dex, and in part they are compensated by 3D effects. The scatter we find in this work from Mult. 3 from our 4 stars is larger than 0.3 dex, compatible only within 2 with a plateau. In Fig. 2 our 1D-LTE results are compared to the results of Caffau et al. (2005), which have been renormalised to .
Caffau et al. (2007) investigated the sulphur abundance derived from the S i lines of Mult. 3 in the Sun and a small sample of solar metallicity stars. They compared this abundance with the one obtained from the weaker lines of Multiplets 6 and 8. Their analysis was carried out before CRIRES was available and the needed spectral range was obtained by forcing the extraction of the last order in the UVES 860 nm standard setting of a few bright, solar-metallicity stars taken from the Paranal Observatory Project dataset (Bagnulo et al., 2003). Except for the Sun, the abundances obtained from the different lines of S i are in agreement.
Takada-Hidai et al. (2002) derived sulphur abundances in six giants and 61 dwarfs, in the range , using Mult. 6, and found a linear increase of [S/Fe] versus [Fe/H] with decreasing metallicity.
Takada-Hidai et al. (2005) analysed Multiplets 6 and 1 in 21 metal-poor stars. They find a good agreement of A(S) from the two multiplets for [Fe/H], while for the most metal-poor stars the abundances from Mult. 6 are larger than from Mult. 1. In their analysis [S/Fe] as a function of the metallicity forms a plateau.
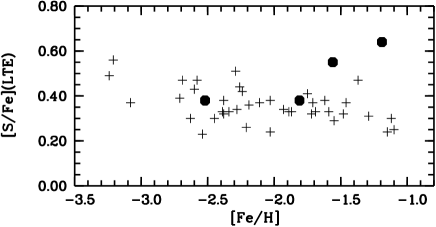
Nissen et al. (2007) observed Mult. 3 of G 29-23, using CRIRES science verification data, and obtained a good agreement of the LTE sulphur abundance with the result obtained from the other lines. In Fig. 3 the sample of Nissen et al. (2007), scaled by 0.04 dex for the difference in the solar sulphur between the two analysis, is compared to our results. The two most metal-rich stars we studied show a [S/Fe] larger than the values in Nissen et al. (2007) for similar metallicity, while the other two stars fall on the average. A scatter of about 0.3 dex in [S/Fe] for metal-poor stars is comparable to the scatter in [Mg/Fe] available in Gratton et al. (2003) for a similar range in metallicity and in Andrievsky et al. (2010) for more metal-poor stars.
5 Conclusions
We did an analysis on the S i lines of Mult. 3 for four metal-poor dwarfs stars of the sample of Caffau et al. (2005). The results of three out of the four candidates are consistent with the previous analysis within errors, and for these three stars the previous analysis relied on Mult. 1. We have to notice that for three stars the sulphur abundance we obtain from the lines of Mult. 3 is lower with respect to the previous analysis based on Mult. 1. For HD 181743, whose previous analysis was based on Mult. 6, the difference of 0.5 dex is above the expected error, and can now be explained with a contamination from the sky in the spectrum analysed by Caffau et al. (2005).
From the results of this small sample we cannot confirm the existence of a plateau in the [S/H],[Fe/H] plane. The scatter is larger with respect to the estimated uncertainties, but a similar scatter is present in [Mg/Fe] versus [Fe/H] in the analysis of Gratton et al. (2003). The systematic error related to the oscillator strength of the lines of Mult. 1 can be neglected because it acts in the same way for the complete sample of stars. One has to take into account the uncertainties related to the temperature, but these error cannot remove the great scatter in [S/Fe]. In fact for the cooler star a change of 100 K in the effective temperature is translated in a change of 0.10 dex in the sulphur abundance, while for the hotter star the same difference in temperature would produce only 0.04 dex change in A(S).
An analysis on Mult. 3 in an extended sample of stars would be useful to investigate the behaviour of [S/Fe] at low metallicity.
Acknowledgements.
We acknowledge use of the supercomputing centre CINECA, which has granted us time to compute part of the hydrodynamical models used in this investigation, through the INAF-CINECA agreement 2006,2007,2008.References
- Anders & Grevesse (1989) Anders, E. & Grevesse, N. 1989, Geochim. Cosmochim. Acta 53, 197
- Andrievsky et al. (2010) Andrievsky, S. M., Spite, M., Korotin, S. A., Spite, F., Bonifacio, P., Cayrel, R., François, P., & Hill, V. 2010, A&A, 509, A260000
- Bagnulo et al. (2003) Bagnulo, S., Jehin, E., Ledoux, C., Cabanac, R., Melo, C., Gilmozzi, R., & The ESO Paranal Science Operations Team 2003, The Messenger, 114, 10
- Caffau et al. (2010) Caffau, E., Ludwig, H.-G., Steffen M., Freytag B., & Bonifacio P. 2010, submitted to Solar Physics
- Caffau & Ludwig (2007) Caffau, E., & Ludwig, H.-G. 2007, A&A, 467, L11
- Caffau et al. (2007) Caffau, E., Faraggiana, R., Bonifacio, P., Ludwig, H.-G., & Steffen, M. 2007, A&A, 470, 699
- Caffau et al. (2005) Caffau, E., Bonifacio, P., Faraggiana, R., François, P., Gratton, R. G., & Barbieri, M. 2005, A&A, 441, 533
- Castelli (2005) Castelli, F. 2005, Memorie della Societa Astronomica Italiana Supplement, 8, 44
- Chen et al. (2002) Chen, Y. Q., Nissen, P. E., Zhao, G., & Asplund, M. 2002, A&A, 390, 225
- Clegg, Tomkin, & Lambert (1981) Clegg, R. E. S., Tomkin, J., & Lambert, D. L. 1981, ApJ, 250, 262
- Ecuvillon et al. (2004) Ecuvillon, A., Israelian, G., Santos, N. C., Mayor, M., Villar, V., & Bihain, G. 2004, A&A, 426, 619
- François (1987) François P. 1987, A&A 176, 294
- François (1988) François P. 1988, A&A 195, 226
- Freytag, Steffen, & Dorch (2002) Freytag, B., Steffen, M., & Dorch, B. 2002, Astronomische Nachrichten, 323, 213
- Gratton et al. (2003) Gratton, R. G., Carretta, E., Claudi, R., Lucatello, S., & Barbieri, M. 2003, A&A, 404, 187
- Israelian & Rebolo (2001) Israelian G.,& Rebolo R. 2001, A&A 557, L43
- Kaeufl et al. (2004) Kaeufl, H.-U., et al. 2004, proc. SPIE, 5492, 1218
- Kurucz (1993) Kurucz, R. 1993a, ATLAS9 Stellar Atmosphere Programs and 2 km/s grid. Kurucz CD-ROM No. 13. Cambridge, Mass.: Smithsonian Astrophysical Observatory, 1993., 13
- Kurucz (2005) Kurucz, R. L. 2005, Memorie della Societa Astronomica Italiana Supplement, 8, 14
- Ludwig et al. (2009) Ludwig, H.-G., Caffau, E., Steffen, M., Freytag, B., Bonifacio, P., & Kučinskas, A. 2009, Memorie della Società Astronomica Italiana, 80, 711
- Nissen et al. (2004) Nissen, P. E., Chen, Y. Q., Asplund, M., & Pettini, M. 2004, A&A, 415, 993
- Nissen et al. (2007) Nissen, P. E., Akerman, C., Asplund, M., Fabbian, D., Kerber, F., Kaufl, H. U., & Pettini, M. 2007, A&A, 469, 319
- Ryde & Lambert (2004) Ryde, N. & Lambert, D. L. 2004, A&A, 415, 559
- Ryde (2006) Ryde, N. 2006, A&A, 455, L13
- Sbordone et al. (2004) Sbordone, L., Bonifacio, P., Castelli, F., & Kurucz, R. L. 2004, Memorie della Società Astronomica Italiana Supplementi, 5, 93
- Takada-Hidai et al. (2002) Takada-Hidai, M., et al. 2002, ApJ, 573, 614
- Takada-Hidai et al. (2005) Takada-Hidai, M., Saito, Y.-J., Takeda, Y., Honda, S., Sadakane, K., Masuda, S., & Izumiura, H. 2005, PASJ, 57, 525
- Takeda et al. (2005) Takeda, Y., Hashimoto, O., Taguchi, H., Yoshioka, K., Takada-Hidai, M., Saito, Y., & Honda, S. 2005, PASJ, 57, 751
- Wallerstein & Conti (1964) Wallerstein, G., & Conti, P. 1964, ApJ, 140, 858
- Wedemeyer et al. (2003) Wedemeyer, S., Freytag, B., Steffen, M., Ludwig, H.-G., & Holweger, H. 2003, Astronomische Nachrichten, 324, 410