Magnetic Order in TbCo2Zn20 and TbFe2Zn20
Abstract
We report neutron diffraction studies of TbCo2Zn20 and TbFe2Zn20, two isostructural compounds which exhibit dramatically different magnetic behavior. In the case of TbCo2Zn20, magnetic Bragg peaks corresponding to antiferromagnetic order are observed below 2.5 K with a propagation vector of (0.5 0.5 0.5). On the other hand, TbFe2Zn20 undergoes a ferromagnetic transition at temperatures as high as 66 K which shows a high sensitivity to sample-to-sample variations. Two samples of TbFe2Zn20 with the same nominal compositions but with substantially different magnetic ordering temperatures ( 51 and 66 K) were measured by single crystal neutron diffraction. Structural refinements of the neutron diffraction data find no direct signature of atomic site disorder between the two TbFe2Zn20 samples except for subtle differences in the anisotropic thermal parameters. The differences in the anisotropic thermal parameters between the two samples is likely due to very small amounts of disorder. This provides further evidence for the extreme sensitivity of the magnetic properties of TbFe2Zn20 to small sample variations, even small amounts of disorder.
pacs:
valid numbers to be inserted hereI Introduction
The RT2Zn20 (R = Rare Earth and T = Transition metal) family of materials exhibit diverse magnetic properties nature-physics-2007 ; Torikachvili-2006 ; Jia-2007 ; Jia-2008 ; Jia-2009 . For example, nearly ferromagnetic Fermi liquid behaviour was observed in YFe2Zn20 nature-physics-2007 and LuFe2Zn20 Jia-2009 . Subsequently it was shown that by substituting a small amount of Y by Gd the GdxY1-xFe2Zn20 system becomes ferromagnetic for 0.02 Jia-2007 and a remarkably high ferromagnetic ordering temperature of = 86 K is found for GdFe2Zn20 nature-physics-2007 . Moreover, six closely related Yb-based heavy fermion compounds were discovered in YbT2Zn20 for T = Fe, Ru, Os, Co, Rh and Ir Torikachvili-2006 that significantly increase the total number of Yb-based heavy fermion materials. The exotic magnetic properties discovered in recent studies have generated great interest in the RT2Zn20 compounds.
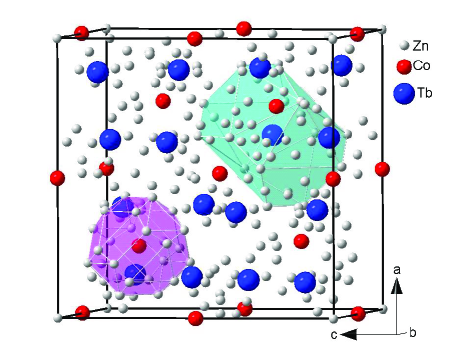
The RT2Zn20 materials crystallize in the cubic CeCr2Al20 type structure (Fdm space group). The R and T ions each occupy an unique crystallographic site, 8a and 16d respectively, whereas the Zn ions have three distinct crystallographic sites, 96g, 48f and 16c Verena-1998 ; Moze-1998 . Even though these materials are comprised of more than 85 Zn, they are highly tunable and ideal for fundamental research such as magnetism for two reasons. (1) As illustrated in Fig. 1, the R and T ions are surrounded exclusively by Zn atoms and there are no R-R, R-T, and T-T nearest neighbors in the system; (2) Due to the very low R concentrations in these compounds (less than 5 at.), the local environment of the R site is only weakly affected by the changing of T. Thus by substituting on either the rare-earth site or the transition metal site, these isostructural compounds can serve as model systems for a variety of physical phenomenon.
Among the RT2Zn20 compounds, GdFe2Zn20 and GdCo2Zn20 have attracted special attention due to the distinct magnetic properties exhibited by each materialnature-physics-2007 . GdFe2Zn20 is a ferromagnet with a remarkably high ordering temperature of = 86 K. However, upon substitution of Co for Fe, ferromagnetism is rapidly suppressedJia-2008 culminating in antiferromagnetic order at = 5.7 K in GdCo2Zn20. Band structure calculations suggest that the enhanced magnetic ordering temperature in GdFe2Zn20 is due to a large d-electron contribution to the electronic density of states when compared to GdCo2Zn20. In addition to sensitivity to transition metal substitution, GdFe2Zn20 exhibits sensitivity to small sample-to-sample variations. Similar behavior has also been observed in Sc3In and ZrZn2, materials on the ferromagnetic side just over the Stoner limit Moriya-1985 ; Brommer-1990 ; Zellermann-2004 .
To provide further information concerning the microscopic origin of the magnetic behavior in the RT2Zn20 family we have performed neutron scattering measurements on TbFe2Zn20 and TbCo2Zn20. TbFe2Zn20 and TbCo2Zn20 are ideal for neutron scattering studies as these materials exhibit similar magnetic behavior to GdFe2Zn20 and GdCo2Zn20, but do not possess the strong neutron absorption cross-section of gadolinium. We have studied single crystalline and polycrystalline samples of TbCo2Zn20 and find antiferromagnetic order below 2.5 K with a propagation vector of (0.5 0.5 0.5). Refinements of the magnetic structure indicate an ordered moment of 7.46 at 1.4 K. In the case of ferromagnetic TbFe2Zn20 we investigated two single crystals prepared by slightly different methods that resulted in a 15 K difference in ordering temperatures. No obvious signs of site disorder were detected in structural refinements of the neutron data, highlighting the extreme sensitivity to small sample variations. However, there are small differences in the refinements which suggest that the sample with the higher transition temperature is more highly ordered. The neutron scattering data are consistent with a picture of the RFe2Zn20 family where the high rare earth ordering temperatures are associated with the highly polarizable Fe lattice and are extremely sensitive to disorder.
II Experimental Details
TbFe2Zn20 and TbCo2Zn20 single crystals were grown from a Zn-rich self flux nature-physics-2007 ; Canfield-1992 in the novel materials and ground states group at Ames Laboratory. Two methods, denoted method 1 and 2 were used to grow crystals of TbFe2Zn20: s1 and s2, respectively. The primary difference between methods 1 and 2 is that the initial molar ratios of the starting elements (Tb:Fe:Zn) were 2:5:95 and 2:3:93 respectively. The resulting single crystals have identical morphology and size to single crystals grown from the molar ratio of the starting elements R:T:Zn = 2:4:94 in Ref. nature-physics-2007, . Although the magnetic ordering temperatures of the TbFe2Zn20 samples synthesized by methods 1 and 2 are different by 15 K (see Fig. LABEL:fig:FeBulk below), single crystal x-ray diffraction measurements cannot fully resolve possible variations of occupancy of Fe and Zn sites, due to their similar atomic numbers.tfexray The TbCo2Zn20 crystals were grown from the molar ratio of the starting elements Tb:Co:Zn = 2:4:94. The magnetic susceptibility of TbCo2Zn20 and TbFe2Zn20 were measured using a Quantum Design MPMS units whereas transport measurements on TbFe2Zn20 were made using Quantum Design PPMS.
| Atom | site | T(K) | |||
| Tb | 8 | 10 | 0.125 | 0.125 | 0.125 |
| Co | 16 | 10 | 0.5 | 0.5 | 0.5 |
| Zn1 | 16 | 10 | 0 | 0 | 0 |
| Zn2 | 48 | 10 | 0.4916(6) | 0.125 | 0.125 |
| Zn3 | 96 | 10 | 0.0608(3) | 0.0608 | 0.3245(5) |
| Lattice and Reliability factors | 10 | ===14.0358(3) Å; =2765.104(8) Å3; RBragg=5.28 %; Rp=5.0 %; Rwp=6.4 %; =1.4; | |||
| 1.4 | ===14.0290(2) Å; =2761.09(8) Å3; RBragg=8.35%; | ||||
| Rmag=13.86 %; Rp=13.8 %; Rwp=15.5%; =12.8; | |||||
Neutron diffraction measurements of TbCo2Zn20 were performed on a 1.7 gram single crystal and 2 gram powder using the HB1A triple axis spectrometer at the High Flux Isotope Reactor (HFIR) at the Oak Ridge National Laboratory (ORNL). The HB1A spectrometer operates with a fixed incident energy of 14.64 meV using a double pyrolitic graphite (PG) monochromator system. The second-order contamination in the beam was removed ( 10-4) by placing two PG filters located before and after the second monochromator. The TbCo2Zn20 single crystal was mounted on a aluminum plate and oriented in the (hhl) scattering plane. For low temperature measurements, both samples were sealed in an aluminum can under Helium atmosphere and cooled using a closed-cycle Helium refrigerator. A collimation of 48’-48’-sample-40’-68’ from reactor to detector was used throughout the measurements and all results shown have been normalized to a beam monitor count.
Two TbFe2Zn20 single crystals with the same nominal compositions hereafter denoted s1 and s2 were selected for neutron scattering measurements. The crystals were cut to 333 mm3 with sample masses of 0.213 g (s1) and 0.210 g (s2). The samples were mounted on aluminum pins with epoxy and attached to the cold finger of a standard closed cycle refrigerator. Neutron diffraction patterns were collected in a standard configuration of the SCD single-crystal neutron Laue Diffractometer at the Intense Pulsed Neutron Source (IPNS) at Argonne National LaboratorySCD . 10 crystal settings were selected to cover an octant of reciprocal space for each sample resulting in around 3600 reflections per sample. A counting time of 3 hours per crystal setting was used. Data were reduced with the ISAW package ISAW and corrected for neutron absorption. Structural refinements were done with the General Structural Analysis System (GSAS) software packagegsas . Equivalent reflections have not been averaged since the extinction correction applied during the structural refinements is strongly wavelength dependent.
III Results
III.1 TbCo2Zn20
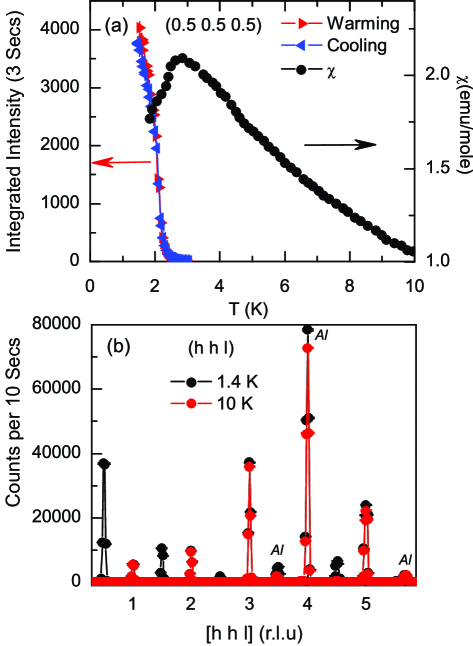
Figure 2(a) shows the magnetic susceptibility (right axis) of TbCo2Zn20 measured at = 0.1 T with . A peak observed at K with a maximal value of ()/ found for 2.5 K Jia-2009 suggests a magnetic, long-range order (LRO) transition near 2.5 K. To examine this low temperature phase, single crystal neutron diffraction measurements were carried out at temperatures above and below K. Fig. 2 (b) compares two wave vector scans measured along the (hhl) direction at T = 1.4 K and 10 K. At T = 1.4 K, ( , are odd integers) type reflections were detected. The absence of these reflections at T = 10 K indicate they are magnetic in origin. To verify the observed magnetic reflections at 1.4 K are indeed associated with the K phase transition, order parameter measurements were carried out by monitoring the strong (0.5 0.5 0.5) magnetic peak as a function of temperature between K and K. As shown in Fig. 2 (a), the integrated intensity of (0.5 0.5 0.5) (right axis) increases rapidly at the transition temperature K in good agreement with the magnetic susceptibility Jia-2009 . The single crystal measurements confirm that TbCo2Zn20 is a long-range ordered antiferromagnet.
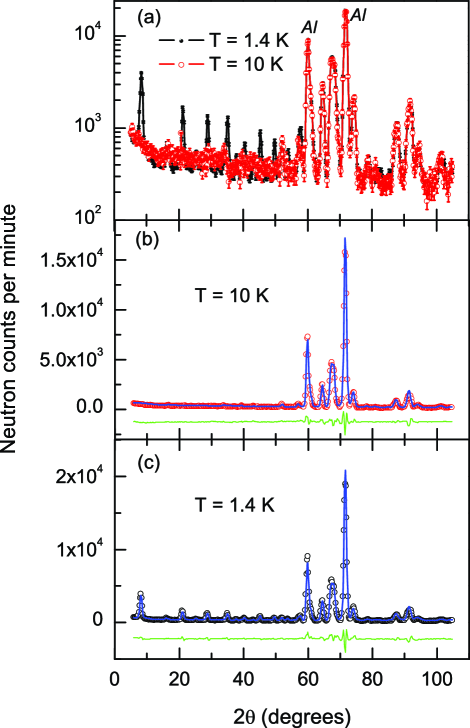
To study the low temperature magnetic structure of TbCo2Zn20, 2 grams powder were prepared by grinding single crystals. Powder diffraction data were collected over the range of 5 with a step size of 0.02∘ at 1.4 K 10 K. As illustrated in Fig. 3 (a), multiple magnetic peaks were observed below TN associated with the antiferromagnetic long range ordered phase. Consistent with the single crystal measurements, the observed magnetic peaks can be indexed as (, , are odd integers) suggesting the doubling of the magnetic unit cell along all three principle axis directions.
We carried out Rietveld refinements of the neutron data using the FULLPROF program Carvajal-1993 . The T = 10 K neutron powder data was first refined to check the nuclear crystal structure of TbCo2Zn20. The refinement results show (Fig. 3 (b)) that the crystal structure of TbCo2Zn20 belongs to the cubic Fdm space group consistent with earlier studies. The refined lattice constants and atomic positions are given in Table II. To refine the T = 1.4 K low temperature data, the representation analysis technique representation-tech , program SARAH sarah and BasIreps (Rodriguez-Carvajal, 2004) were used as a tool to generate magnetic structures that are compatible with the TbCo2Zn20 crystal structure. There are four possible irreducible representations associated with the Fdm space group as listed in table 2. The labeling of the propagation vector and the irreducible representations in table 2 follows the scheme used by Kovalev Kovalev-1993 . Refinements of the T = 1.4 K data using FULLPROF indicates that the magnetic structure of TbCo2Zn20 can only be described by the irreducible representation . Figure 3(c) shows the refinement results considering both the magnetic and crystal structure unit cell. At T = 1.4 K, the refined magnetic moment of Tb3+ ion is 7.46 . We note that the moment has not yet saturated by 1.4 K thus the ordered moment at T = 0 K is probably somewhat closer to the full moment value of K 9.5 . Some reduction in the ordered moment is expected due to crystal field level splitting. Preliminary inelastic neutron scattering work suggests the crystal field level splitting of the Tb ground state multiplet in TbCo2Zn20 is less than 1.5 meV.
| IR | BV | Atom | BV components | |||||
| 1 | 1 | 1 | 1 | 0 | 0 | 0 | ||
| 2 | 1 | 1 | 1 | 0 | 0 | 0 | ||
| 1 | 1 | 1 | 1 | 0 | 0 | 0 | ||
| 2 | -1 | -1 | -1 | 0 | 0 | 0 | ||
| 1 | 1 | -0.5 | -0.5 | 0 | 0 | 0 | ||
| 2 | -1 | 0.5 | 0.5 | 0 | 0 | 0 | ||
| 1 | 0 | 0.866 | -0.866 | 0 | 0 | 0 | ||
| 2 | 0 | -0.866 | 0.866 | 0 | 0 | 0 | ||
| 1 | 1 | -0.5 | -0.5 | 0 | 0 | 0 | ||
| 2 | 1 | -0.5 | -0.5 | 0 | 0 | 0 | ||
| 1 | 0 | 0.866 | -0.866 | 0 | 0 | 0 | ||
| 2 | 0 | 0.866 | -0.866 | 0 | 0 | 0 | ||
III.2 TbFe2Zn20
Acknowledgments We would like to thank V. O. Garlea for helping with the TbCo2Zn20 magnetic structure refinement. Ames Laboratory is operated for the U.S. Department of Energy by Iowa State University under Contract No. DE-AC02-07CH111358. Work at ORNL was supported by the Scientific User Facility Division, office of Basic Energy Science, DOE. Work at Argonne National Laboratory was supported by the U.S. Department of Energy, Office of Science, Office of Basic Energy Sciences, under contract DE-AC02-06CH11357.
References
- (1) S. Jia, S. L. Bud’ko, G. D. Samolyuk, and P. C. Canfield, Nature Physics 3, 334-338 (2007)
- (2) M. S. Torikachvili, S. Jia, E. D. Mun, S. T. Hannahs, R. C. Black, W. K. Neils, Dinesh Martien, S. L. Bud’ko, and P. C. Canfield, PNAS 104, 9960-9963 (2007). www.pnas.org/cgi/doi/10.1073/pnas.0702757104
- (3) S. Jia, Ni Ni, S. L. Bud’ko, and P. C. Canfield, Phys. Rev B 76, 184410 (2007).
- (4) S. Jia, Ni Ni, G. D. Samolyuk, A. Safa-Safat, K. Dennis, Hyunjin Ko, G. J. Miller, S. L. Bud’ko, and P. C. Canfield, Phys. Rev B 77, 104408 (2008).
- (5) S. Jia, Ni Ni, S. L. Bud’ko, and P. C. Canfield, Phys. Rev B 80, 104403 (2009).
- (6) Verena M. T. Thiede, Wolfgang Jeitschko, Sabine Niemann, and Thomas Ebel, Journal of Alloys and Compounds 267, 23-31 (1998).
- (7) O. Moze, L. D. Tung, J. J. M. Franse, and K. H. J. Buschow, Journal of Alloys and Compounds 268, 39-41 (1998).
- (8) Moriya, T. Spin Fluctuations in Itinerant Electron Magnetism (Springer, Berlin, 1985).
- (9) Brommer, P. E. Franse, J. J. M. in Ferromagnetic Materials Vol. 5 (eds Buschow, K. H. J. Wohlfarth, E. P.) 224 (Elsevier, Amsterdam, 1990).
- (10) Zellermann, B., Paintner, A. Voitlnder, J.,J. Phys. Condens. Matter 16, 919 (2004).
- (11) P. C. Canfield and Z. Fisk, Philosophical Magazine Part B 65, 1117 (1992).
- (12) H. Ko, A. Safa-Sefat, S. Jia, S. L. Bud’ko, P. C. Canfield, and G. J. Miller, G. J. (2008). unpublished
- (13) A. J. Schultz, P. M. De Lurgio, J. P. Hammonds, D. J. Mikkelson, R. L. Mikkelson, M. E. Miller, I. Naday, P. F. Peterson, R. R. Porter, and T. G. Worlton, Physica B 385-386, 1059 (2006).
- (14) ftp://ftp.sns.gov/ISAW/
- (15) A. C. Larson and R. B. Von Dreele, General Structural Analysis System (GSAS), Los Alamos National Laboratory Report LAUR 86-748 (2004).
- (16) J. Rodriguez-Carvajal, Physica B 192, 55 (1993).
- (17) E. F. Bertaut, J. Appl. Phys. 33, 1138 (1962); E. F. Bertaut, Acta. Cryst. A24, 217 (1968); E. F. Bertaut, J. Magn. Magn. Mater. 24, 267 (1981).
- (18) A. Wills, Physica B 276-278, 680 (2000).
- (19) O. V. Kovalev, Representations of the Crystallographic Space Groups Edition 2 (Gordon and Breach Science Publishers, Switzerland, 1993).
- (20) T. Nasch, W. Jeitschko, and U. Ch. Rodewald, Naturforsch. B 52, 1023 (1997).
- (21) J. J. M. Franse and R. J. Radwanski, in Handbook of Magnetic Materials, edited by K. H. J. Buschow (Elsevier, Amsterdam, 1993), Vol. 7, pp. 307 501.
- (22) A. Szytula and J. Leciejewicz, Handbook of Crystal Structures and Magnetic Properties of Rare Earth Intermetallics (CRC, Boca Raton, 1994).
- (23) P. G. de Gennes, J. Phys. Radium 23, 510 (1962).
- (24) I. A. Campbell, J. Phys. F: Met. Phys. 2, L47 (1972).