Critical Core Masses for Gas Giant Formation with Grain-Free Envelopes
Abstract
We investigate the critical core mass and the envelope growth timescale, assuming grain-free envelopes, to examine how small cores are allowed to form gas giants in the framework of the core accretion model. This is motivated by a theoretical dilemma concerning Jupiter formation: Modelings of Jupiter’s interior suggest that it contains a small core of , while many core accretion models of Jupiter formation require a large core of to finish its formation by the time of disk dissipation. Reduction of opacity in the accreting envelope is known to hasten gas giant formation. Almost all the previous studies assumed grain-dominated opacity in the envelope. Instead, we examine cases of grain-free envelopes in this study. Our numerical simulations show that an isolated core of as small as is able to capture disk gas to form a gas giant on a timescale of million years, if the accreting envelope is grain-free; that value decreases to , if the envelope is metal-free, namely, composed purely of hydrogen and helium. It is also shown that alkali atoms, which are known to be one of the dominant opacity sources near in the atmospheres of hot Jupiters, have little contribution to determine the critical core mass. Our results confirm that sedimentation and coagulation of grains in the accreting envelope is a key to resolve the dilemma about Jupiter formation.
1 Introduction
Core masses provide clues to unveiling the origins of gas giants. In the core accretion scenario for gas giant formation, a forming solid protoplanet (i.e., a proto-core) experiences a rapid gas capture from a protoplanetary disk to form a massive gas envelope, when its mass exceeds a critical mass (Mizuno, 1980; Bodenheimer & Pollack, 1986). That critical core mass must be reached within the lifetime of the disk gas of several million years (e.g. Haisch et al., 2001), which places a limit on the core mass of a formed gas giant. Because of the slow increase in the critical core mass with core accretion rate (Stevenson, 1982; Ikoma et al., 2000), faster formation in general results in larger core mass. Indeed, in many core-accretion models that are successful in forming Jupiter within several Myr (Pollack et al., 1996; Inaba et al., 2003; Alibert et al., 2005, etc.), the resultant core mass is as large as or more.
In contrast, the mass of Jupiter’s present core is inferred to be small. Saumon & Guillot (2004) made an extensive investigation of the interior structure of Jupiter, finding successful models that are consistent with the observed values of its gravitational moments and equatorial radius by using a variety of equations of state (EOSs) for hydrogen and helium. They demonstrated that the possible core mass of Jupiter is smaller than . This is also supported by recent calculations with an ab initio EOS derived in the first-principle approach (Nettelmann et al., 2008). While a more massive core of is reported by Militzer et al. (2008) who used their own EOS of hydrogen-helium mixtures based on density functional molecular dynamics, Fortney & Nettelmann (2009) pointed out the difference in the mass fraction of helium used by the two groups is responsible for this discrepancy in the derived value of Jupiter’s core mass. Although this pending problem about Jupiter’s core may arise from the uncertainty of EOS, the core mass suggested by interior modeling is, on an average, smaller than that derived by formation theories. This fact motivates us to know how small a core can start the rapid gas accretion to form a massive envelope within several Myr.
Reduction of opacity in the protoplanet’s envelope has the potential to make a small core possible. As the opacity becomes small, the critical core mass decreases and the post-critical-mass gas accretion becomes fast, because low opacity in the envelope makes it difficult to maintain the envelope’s hydrostatic structure without gravitational energy released by contraction of the envelope (Mizuno, 1980; Stevenson, 1982; Ikoma et al., 2000). Since the opacity sources are dust grains and gaseous components in the envelope, a minimum critical core mass is achieved in the case of grain-free envelopes. All the previous studies except one calculation done by Mizuno (1980) (see Section 2) assumed grain-dominated opacity in the outer envelope. Thus, in this paper, we consider grain-free envelopes and make an extensive investigation of the critical core mass and timescale for gas accretion.
Results from the recent works by Podolak and his colleagues (Podolak, 2003; Movshovitz & Podolak, 2008) are encouraging. They have directly simulated the dynamical behavior of dust grains to determine their size distribution, and then calculated grain opacity in the accreting envelope. Their numerical simulations revealed that grain opacities in the envelope can be much lower than those in the protoplanetary disk. The reason is that small grains initially suspended in the outer envelope quickly grow large in size and then settle down into the deep envelope where temperature is high enough that grains evaporate.
In the following section, the details of the gas opacity used in this study are described. Our numerical calculations and results for the critical core mass and the timescale of gas accretion are shown in Sections 3 and 4, respectively. We discuss a possibility of Jupiter formation with a small core in Section 5.
2 Gas Opacity
The opacity of the envelope gas is lowest when the envelope contains only hydrogen and helium. In this study, we first consider such a metal-free case111In the community of astrophysics, the word ‘metal’ represents elements heavier than helium.. We compute chemical equilibrium between , H, , , , , and , and then calculate the opacity that includes the bound-free and free-free absorptions by , Rayleigh scatterings by , H, and He, Thomson scattering by , and the collision-induced absorptions (CIA) due to , , , and . Values of quantities relevant to those calculations are given in Lenzuni et al. (1991) and references therein. The CIA opacities are computed by using the latest programs and tables available on Borysow’s web page222http://www.astro.ku.dk/ aborysow/programs/index.html (Borysow et al., 1985; Borysow & Frommhold, 1990; Borysow, 1991, 1992; Zhen & Borysow, 1995; Birnbaum et al., 1996; Borysow et al., 1997, 2000; Borysow, 2002).
Metal-containing envelopes with no grains are also considered in this study. It is uncertain what fraction of metals in protoplanetary disks are incorporated in dust grains and what faction remains in their gaseous forms. For example, the amount of water adsorbed onto grain surfaces depends strongly on the thermal state of the protoplanetary disk. Water is adsorbed onto grain surfaces in a relatively cold disk, while it remains in the gas phase in a relatively hot disk (Markwick et al., 2002; Woods & Willacy, 2009). Adsorption rates of water are also sensitive to the abundances and sizes of dust grains in the disk (Aikawa & Nomura, 2006), but such dust properties remain poorly known. Alkali atoms may be important: They are known to be one of the dominant gas opacity sources near K in the outer atmospheres of brown dwarfs and giant planets (Guillot et al., 1994; Burrows et al., 2000), though alkali atoms have a tendency to reside onto grain surfaces in protoplanetary disks (Hasegawa & Herbst, 1993). Therefore, we consider two cases in addition to the metal-free case: In one case called the alkali case hereafter, alkali atoms are all in the gas phase; in another case called the no-alkali case, they are absent in the gas.
In the alkali case, we use the gas-opacity data provided by Freedman et al. (2008), which incorporate the revised solar abundances and alkali atoms. The solar abundances have been recently revised by re-analyses of two forbidden lines of neutral oxygen and carbon from the solar photosphere under the assumption of the local thermodynamic equilibrium, although their values should still require scrutiny because of uncertainties in 3-D hydrodynamical models for the solar atmosphere (Allende Prieto et al., 2001, 2002; Lodders, 2003). Opacity data without alkali atoms are kindly provided by Dr. Freedman (in personal communication). In practice, we use the up-to-date opacity data of Freedman et al. (2008), which cover the wider ranges of temperature and pressure compared to the published ones and include the latest HITRAN spectroscopic data and an additional opacity source, (in personal communication).
3 Critical Core Mass
The spherically-symmetric hydrostatic structure of a protoplanet is simulated in a manner similar to previous studies (e.g. Mizuno, 1980). The protoplanet consists of a solid core and a gaseous envelope. The core has a constant density of and its structure is not computed. The envelope is assumed to be in purely hydrostatic equilibrium and have a uniform chemical composition. While the composition depends on the case, the abundance ratios of elements taken into account are always solar (Lodders, 2003). All simulations are computed with spline-interpolated SCVH EOS tables for hydrogen and helium provided by Saumon et al. (1995) , contributions from heavy elements being ignored. The inner boundary conditions are applied at the core surface. At the outer boundary, the temperature and density are equal to the midplane values of a protoplanetary disk at the protoplanet’s orbit, and , because the envelope is assumed to be in equilibrium with the disk gas at the outer edge. The outer radius of the protoplanet is defined by the smaller of the accretion radius and the tidal radius. Note that our results are insensitive to the outer boundary conditions. We handle the accretion rate of planetesimals, , as a free parameter in this study. We follow the same procedure as Mizuno (1980) to determine the critical core mass, (please see Mizuno (1980) in detail). Table 1 summarizes input parameters and their values used in this study.
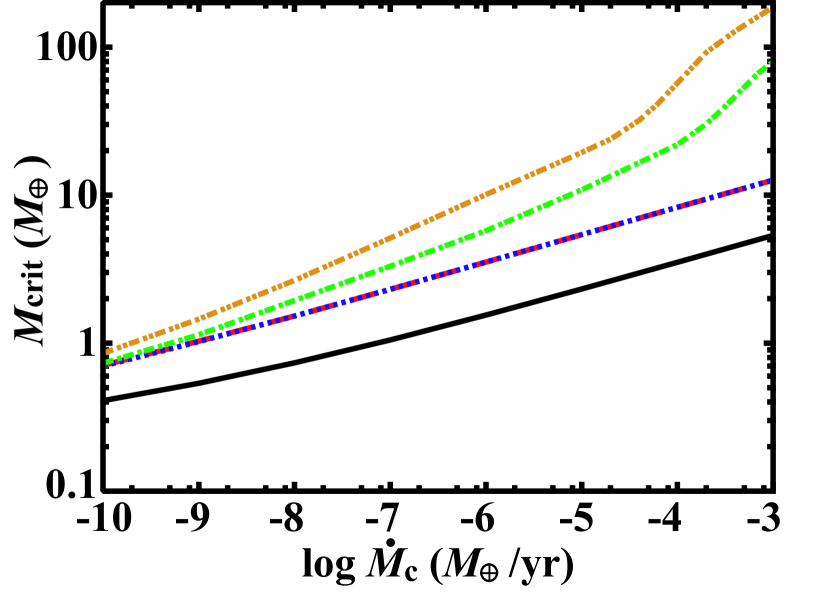
Figure 1 shows as a function of for the three cases. For comparison, we plot results for additional two cases in which the envelope contains both grains and gas as opacity sources. We assume that the grain opacity takes times values of the grain opacity given by Pollack et al. (1985); their calculations assumed a nearly interstellar size distribution of dust grains.
Reduced opacity results in small , as shown in Figure 1. For instance, we now focus on results for . In the case of (double dot-dashed line), which is often adopted in core accretion models (e.g. Hubickyj et al., 2005), . Removal of grains lowers to a few ; for the alkali case (dashed line) and for the metal-free case (solid line).
Compared to the alkali case, the metal-free case always produces smaller . This is because molecules composed of oxygen and/or carbon such as and are effective opacity sources as for determination of . In contrast, comparison between the results for the alkali (dashed line) and no-alkali cases (dotted line) demonstrates that alkali atoms have little contribution to determine . The reason is that convection governs heat transfer in deep, hot parts of the envelope where alkali atoms have a great contribution to the opacity.
Figure 1 also demonstrates that all the lines except one for the metal-free case are converging, as decreases. In the case of low , namely, low luminosity, the outermost isothermal layer extends deep in the envelope. In that isothermal layer, the density increases rapidly to keep the pressure gradient needed for supporting the core’s gravity. Thus, because of high densities, the opacity from and dominates the grain opacity in the deep radiative envelope in spite of low temperature.
Finally it is worth mentioning differences from previous studies. Mizuno (1980) calculated in the metal-free case for only one value of core accretion rate, , and derived . While the CIA opacities at high temperatures have been revised thanks to progresses of quantum mechanical models and improvement of experimental data in the 1990s, Mizuno’s (1980) value of is in good agreement with our result for the same parameters. Ikoma et al. (2000) investigated cases with low grain opacity. Our calculations for and yield larger than those from Ikoma et al. (2000), because they assumed relatively small grain opacities compared to those used in this study.
4 Envelope Growth Timescale
The critical core mass decreases as the core accretion rate decreases, as shown in Fig.1. Therefore, the case of (i.e., isothermal envelope) yields the absolute minimum of (Sasaki, 1989; Pečnik & Wuchterl, 2005). However, for smaller , it takes longer for the core to capture disk gas (Ikoma et al., 2000; Ikoma & Genda, 2006). Because there are time constraints on gas giant formation such as the disk’s lifetime (Haisch et al., 2001), a practical minimum of is determined in this respect. It is necessary to estimate how long it takes for a protoplanet with a given core mass, , to capture disk gas.
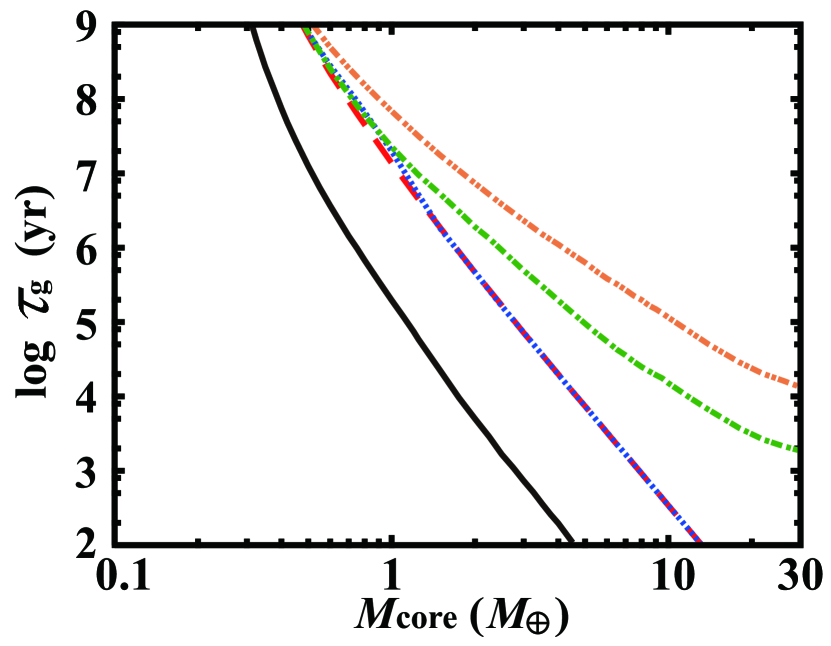
We consider an isolated protoplanet, namely, accumulation of the envelope after planetesimal accretion is halted. The isolated protoplanet always experiences contraction of its envelope and captures disk gas, because of no energy supply due to planetesimal accretion. We simulate the quasi-static evolution of the envelope with a given after planetesimal accretion is halted and evaluate the growth timescale of the envelope. As the growth timescale of the envelope, we present values of the characteristic growth time, , that is defined by Ikoma et al. (2000).
Figure 2 plots as functions of . For comparison, the results for and are also shown. The growth time is found to be much shorter in the case of the grain-free opacities than for the grain-dominated opacities. For example, when , in the metal-free case (solid line) and in the alkali case (dashed line), while for (double dot-dashed line). The envelope growth is regulated by the Kelvin-Helmholtz contraction of the envelope; that is, is proportional to (Ikoma et al., 2000), where is the luminosity at the envelope’s outer edge. Since a change in opacity compensates that in luminosity, being an averaged opacity, should be proportional to . In the case of the grain-dominated opacities, the dependence is simple, namely, , as shown in Ikoma et al. (2000) and Ikoma & Genda (2006). Figure 2, however, demonstrates that such a simple scaling is inappropriate in low cases. The curves for grain-free cases are steeper than those for grain-dominated cases; the reason has been already described in the previous section.
In any case, we have found that the envelope growth time is significant shorter in the case of the grain-free opacities. Based on this fact, we discuss the minimum critical core mass from the viewpoint of gas giant formation, and the possibility of Jupiter formation with a small core in the following section.
5 Discussion
There is a theoretical dilemma concerning Jupiter formation, as described in Introduction. Modelings of Jupiter’s interior suggest that Jupiter has a small core of (e.g., Saumon & Guillot, 2004), while many core-accretion models of Jupiter formation require a large core of to finish its formation by the time of disk dissipation (Pollack et al., 1996; Alibert et al., 2004, 2005; Fortier et al., 2007, 2009). The disk instability scenario has been revisited as an alternative scenario of their formation (e.g. Boss, 2000; Mayer et al., 2002).
In this study, we have demonstrated that reduced opacities in the protoplanet’s envelope have the potential to resolve this dilemma. From Fig. 2, one finds that for 1 Myr in the metal-free case; even in the alkali case. Given observed lifetimes of protoplanetary disks of several Myr, the fact above indicates the reduction of opacity allows Jupiter to have a small core that is consistent with interior modelings in principle. The feasibility of such minimum depends on opacities in the protoplanet’s envelope, while this does not change our conclusion that the minimum obtained here provides the lowest limit to core masses of gas giants to which the core accretion model can apply. We need more extensive investigation of gas giant formation into which sedimentation and coagulation of grains in the accreting envelope are incorporated, although reduction of opacity was already pronounced (Podolak, 2003; Movshovitz & Podolak, 2008).
Our results also shed light upon growth of solid cores. Many core accretion models assumed the presence of a single protoplanet (e.g. Pollack et al., 1996). However, a gas giant is in practice thought of as being formed in a system of multiple protoplanets embedded in a protoplanetary disk. Compared to cases of a single protoplanet, the final mass of a core should be small in the case of a multiple-protoplanet system. According to Kokubo & Ida (1998, 2000), the isolation mass is a few around AU. Even such a small core is enough for a gas giant to capture disk gas within several Myr, as demonstrated in this study. We need to perform comprehensive simulations on gas giant formation in multiple-protoplanet systems, which incorporate adequate models of planetary accretion such as fragmentation of planetesimals and -damping due to gas drag (e.g. Duncan et al., 2009). These calculations will be our future work.
References
- Aikawa & Nomura (2006) Aikawa, Y., & Nomura, H. 2006, ApJ, 642, 1152
- Alibert et al. (2004) Alibert, Y., Mordasini, C., & Benz, W. 2004, A&A, 417, L25
- Alibert et al. (2005) Alibert, Y., Mordasini, C., Benz, W., & Winisdoerffer, C. 2005, A&A, 434, 343
- Allende Prieto et al. (2001) Allende Prieto, C., Lambert, D. L., & Asplund, M. 2001, ApJ, 556, L63
- Allende Prieto et al. (2002) Allende Prieto, C., Lambert, D. L., & Asplund, M. 2002, ApJ, 573, L137
- Birnbaum et al. (1996) Birnbaum, G., Borysow, A., & Orton, G. S. 1996, Icarus, 123, 4
- Bodenheimer & Pollack (1986) Bodenheimer, P., & Pollack, J. B. 1986, Icarus, 67, 391
- Borysow (1991) Borysow, A. 1991, Icarus, 92, 273
- Borysow (1992) Borysow, A. 1992, Icarus, 96, 169
- Borysow (2002) Borysow, A. 2002, A&A, 390, 779
- Borysow et al. (2000) Borysow, A., Borysow, J., & Fu, Y. 2000, Icarus, 145, 601
- Borysow & Frommhold (1990) Borysow, A., & Frommhold, L. 1990, ApJ, 348, L41
- Borysow et al. (1997) Borysow, A., Jorgensen, U. G., & Zheng, C. 1997, A&A, 324, 185
- Borysow et al. (1985) Borysow, J., Trafton, L., Frommhold, L., & Birnbaum, G. 1985, ApJ, 296, 644
- Boss (2000) Boss, A. P. 2000, ApJ, 536 L101
- Burrows et al. (2000) Burrows, A., Marley, M. S., & Sharp, C. M. 2000, ApJ, 531, 438
- Fortney & Nettelmann (2009) Fortney, J. J. & Nettelmann, N. 2009, Space Sci. Rev., 115
- Fortier et al. (2007) Fortier, A., Benvenuto, O. G., & Brunini, A. 2007, A&A, 473, 311
- Fortier et al. (2009) Fortier, A., Benvenuto, O. G., & Brunini, A. 2009, A&A, 500, 1249
- Duncan et al. (2009) Duncan, H. F., Levison, E., Thommes, M. J. 2009, arXiv:0912.3144
- Freedman et al. (2008) Freedman, R. S., Marley, M. S., & Lodders, K. 2008, ApJS, 174, 504
- Guillot et al. (1994) Guillot, T., Gautier, D., Chabrier, G., & Mosser, B. 1994, Icarus, 112, 337
- Haisch et al. (2001) Haisch, K. E. Jr., Lada, E. A., & Lada, C. J. 2001, ApJ, 553, L153
- Hasegawa & Herbst (1993) Hasegawa, T. I., & Herbst, E. 1993, MNRAS, 263, 589
- Hubickyj et al. (2005) Hubickyj, O., Bodenheimer, P., & Lissauer, J. J. 2005 Icarus, 179, 415
- Inaba et al. (2003) Inaba, S., Wetherill, G. W., & Ikoma, M. 2003, Icarus, 166, 46
- Ikoma & Genda (2006) Ikoma, M., & Genda, H. 2006, ApJ, 648, 696
- Ikoma et al. (2000) Ikoma, M., Nakazawa, K., & Emori, H. 2000, ApJ, 537, 1013
- Lodders (2003) Lodders, K. 2003, ApJ, 591, 1220
- Kokubo & Ida (1998) Kokubo, E. & Ida, S. 1998, Icarus, 131, 171
- Kokubo & Ida (2000) Kokubo, E. & Ida, S. 2000, Icarus, 143, 15 Lodders, K. 2003, ApJ, 591, 1220
- Lenzuni et al. (1991) Lenzuni, P., Chernoff, D. F. & Salpeter, E. E. 1991, ApJ, 76, 759
- Markwick et al. (2002) Markwick, A. J., Ilgner, M., Millar, T. J., & Henning, Th. 2002, A&A, 385, 632
- Mayer et al. (2002) Mayer, L., Quinn, T., Wadsley, J., & Stadel, J. 2002, Science, 298, 1756
- Militzer et al. (2008) Militzer, B., Hubbard, W. B., Vorberger, J., Tamblyn, I., & Bonev, S. A. 2008, ApJ, 688, L45
- Mizuno (1980) Mizuno, H. 1980, Prog. Theor. Phys., 64, 544
- Movshovitz & Podolak (2008) Movshovitz, N., & Podolak, M. 2008, Icarus, 194, 368
- Nettelmann et al. (2008) Nettelmann, N., Holst, B., Kietzmann, A., French, M., Redmer, R., & Blaschke, D. 2008, ApJ, 683, 1217
- Pečnik & Wuchterl (2005) Pečnik, B., & Wuchterl, G. 2005, A&A, 440, 1183
- Podolak (2003) Podolak, M. 2003, Icarus, 165, 428
- Pollack et al. (1985) Pollack, J. B., McKey, C. P., & Christofferson, B. M. 1985, Icarus, 64, 471
- Pollack et al. (1996) Pollack, J. B., Hubickyj, O., Bodenheimer, P., & Lissauer, J. J. 1996, Icarus, 124, 62
- Sasaki (1989) Sasaki, S. 1989, A&A, 215, 177
- Saumon et al. (1995) Saumon, D., Chabrier, G., & Van Horn, H. M. 1995, ApJS, 99, 713
- Saumon & Guillot (2004) Saumon, D., & Guillot, T. 2004, ApJ, 609, 1170
- Stevenson (1982) Stevenson, D. J. 1982, Planet. Space Sci., 30, 755
- Woods & Willacy (2009) Woods, P. M., & Willacy, K. 2009, ApJ, 693, 1360
- Zhen & Borysow (1995) Zheng, C., & Borysow, A. 1995, ApJ, 441, 960
| Parameter | Value | |
|---|---|---|
| semimajor axis, | 5.2 AU | |
| core density | ||
| disk temperature, | ||
| disk density, | ||
| planetesimal accretion rate, | to |