A new condition for the transition from runaway to oligarchic growth
Abstract
Accretion among macroscopic bodies of km size or larger is enhanced significantly due to gravitational focusing. Two regimes can be distinguished. Initially, the system experiences runaway growth, in which the gravitational focusing factors increase, and bodies at the high-mass tail of the distribution grow fastest. However, at some point the runaway body dynamically heats its environment, gravitational focusing factors decrease, and runaway growth passes into oligarchic growth. Based on the results of recent simulations, we reconsider the runaway growth-oligarchy transition. In contrast to oligarchy, we find that runaway growth cannot be approximated with a two component model (of small and large bodies) and that the criterion of Ida & Makino (1993), which is frequently adopted as the start of oligarchy, is not a sufficient condition to signify the transition. Instead, we propose a new criterion based on timescale arguments. We then find a larger value for the runaway growth-oligarchy transition: from several hundreds of km in the inner disk regions up to 103 km for the outer disk. These findings are consistent with the view that runaway growth has been responsible for the size distribution of the present day Kuiper belt objects. Our finding furthermore outline the proper initial conditions at the start of the oligarchy stage.
Subject headings:
planets and satellites: formation — Kuiper belt: general — protoplanetary disks — methods: statistical1. Introduction
In planet formation theory, the process through which km or larger bodies are formed is still not well understood, since a straightforward formation mechanism is lacking (Blum & Wurm, 2008; Chiang & Youdin, 2009). However, once these bodies appear gravity takes over the accretion process, fulfilling both the role as a sticking agent as well as an important accelerator for growth: the gravitational cross section between two bodies can become much larger than their geometrical cross section. This phenomenon is better known as gravitational focusing and the gravitational enhancement factor in this regime is given by , where is the (mutual) escape velocity and the velocity dispersion of bodies. Initially, gravitational focusing factors for the biggest bodies increase rapidly, and the system experiences runaway growth: increases much faster than . However, at a certain point the stirring capabilities of the biggest body will cause to increase rapidly. Gravitational focusing factors decrease and the growth becomes self-regulated since the stirring rate of small bodies is determined by the same big body that accretes them. Runaway growth has passed into oligarchy (Kokubo & Ida, 1998).
Ida & Makino (1993) have argued that the runaway growth-oligarchy transition takes place at the point where the stirring power of big bodies first exceeds that of the small bodies, i.e.,
| (1) |
where is the surface density of big bodies of mass and that of the small bodies. Equation (1) can be transformed into a radius, , indicating the turnover from runaway growth into oligarchy (see below, eq. [4]). Many works have adopted equation (1) as the start of their oligarchic calculations (e.g., Thommes et al., 2003; Ida & Lin, 2004; Chambers, 2006, 2008; Fortier et al., 2007; Brunini & Benvenuto, 2008; Miguel & Brunini, 2008; Mordasini et al., 2009).
In this letter, we will refine the criterion of Ida & Makino (1993) and present a new expression for (eq. [13]). In runaway growth the column density spectrum evolves into a power law, , where (Wetherill & Stewart, 1993; Kokubo & Ida, 1996, 2000; Barnes et al., 2009, Fig. 1a). However, for a index, the stirring power lies at the high-mass end of the population; that is, during runaway growth the stirring power is already moving away from the initial mass (). Despite the stirring, the system continues in its runaway (fast) growth mode. The point is that equation (1) implicitly assumes that stirring occurs fast and outpaces the accretion, which is true for oligarchy but not for runaway growth. In other words, equation (1) is a necessary condition for oligarchy but not a sufficient one. Instead, we will argue that the condition for the start of oligarchy is met when the stirring timescale in the two component approximation (, see below) drops below the accretion timescale that characterizes the runaway regime, .
In § 2 we first introduce key definitions and obtain the stirring timescale and the accretion timescale for a two component system. In § 3 we present the results of our runaway growth simulations in terms of , the accretion timescale during runaway growth, which follows from our simulations. § 4 then presents the new transition radius by equating the timescale expressions. We discusses a few implications and summarize in § 5.
2. Key definitions and timescales
The Hill radius and Hill velocity of a single body of mass and radius are given by
| (2) |
with the disk radius (semi major axis), the mass of the star, and the orbital frequency at semi major axis . The escape velocity is defined where is Newton’s gravitational constant. Using these definitions one can show that , where the dimensionless is given by (cf. Goldreich et al., 2004)
| (3) |
where we used with the internal density of the bodies. When discussing interactions one should use combined masses and radii in the above definitions (i.e., and ) but this leaves equation (3) and the relation unaffected.
In the following we assume a two component model where a single big body of mass and radius interacts with smaller bodies of radius and mass that dominate the solids surface density, . The velocity dispersion of the smaller bodies also dominates the relative velocity and we assume that , where and correspond to, respectively, the Hill and escape velocity of the big body. This is the dispersion dominated regime and these assumptions are typical for oligarchy. Using with the width of the heating region and an order-of-unity factor, one finds that the runaway growth-oligarchy transition according to equation (1) lies at a radius of (cf. Thommes et al. 2003)
| (4) | |||||
In the dispersion-dominated regime inclinations are related to eccentricities as (Ida et al., 1993). The accretion rate of the big bodies then becomes
| (5) |
(Ida & Makino, 1993) where is the rms-eccentricity of the small bodies, which is related to as . Furthermore, is a factor of order unity that takes into account the increased accretion rate under a distribution of velocities. With the above definitions we transform equation (5) into Hill units
| (6) |
and define the accretion timescale in the 2-component approximation as
| (7) | |||||
where we defined the dimensionless .
The timescale for viscous stirring of the small bodies is given by (Ida & Makino, 1993):
| (8) |
where is a Coulomb factor and the number density of perturbers. This latter quantity is obtained from the assumption that each small bodies ‘sees’ one oligarch. The volume traversed by the small bodies is the product of (their circumference), (the width in the radial direction), and (the vertical excursion). Here, represents the corresponding vertical velocities as given by the inclinations (=) of the bodies. Thus, the effective number density of the single oligarch is . Then, equation (8) transforms into
| (9) | |||||
with .
3. The timescale for runaway growth,
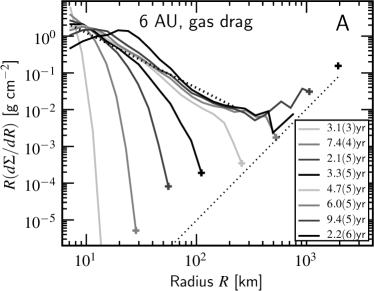
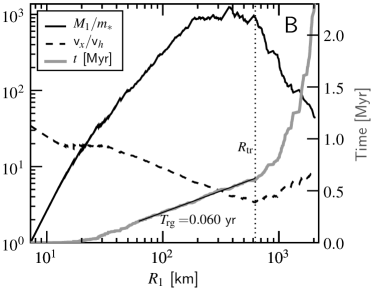
Figure 1 presents an example of the runaway growth parameter study we have recently conducted (Ormel et al., 2010). These are the results of statistical simulations that include key physical processes like dynamical friction, viscous stirring, gas drag, and resolve the semi-major axis of the bodies (cf. Weidenschilling et al., 1997; Bromley & Kenyon, 2006). In Fig. 1a the mass spectrum is shown at several times during the simulation run. After the radius of the most massive body, , has increased by a factor 2 a new curve is plotted; the corresponding times are indicated in the legend. It is seen that the number density spectrum evolves into a power law, with . Near the end of the simulation bodies have separated: the oligarchs.
In Fig. 1b additional information for this run is presented as function of the evolutionary parameter . The black curve shows the ratio of the most massive particle () and , which is the mass-weighed average of the distribution, . For a two component model should increase if the system is in runaway growth (Lee, 2000; Ormel & Spaans, 2008). It can be seen, however, that this ratio flattens near km and decreases after 600 km. The fluctuations in this curve are caused by merging of bodies of similar size. Also plotted is , the ratio of the largest random velocity of the smallest bodies over the Hill velocity of . It first decreases (gravitational focusing increases) until km, where reaches a minimum. This radius is denoted the transition radius, , indicated by the vertical dotted line. Time is plotted by the grey curve on the second, linear, y-axis. After has reached its minimum this curve noticeably steepens. Only from this point onwards does dynamical heating win over the increase of through accretion, and the accretion timescale increases. Bodies in other zones, spatially separated from , then find the chance to catch up.
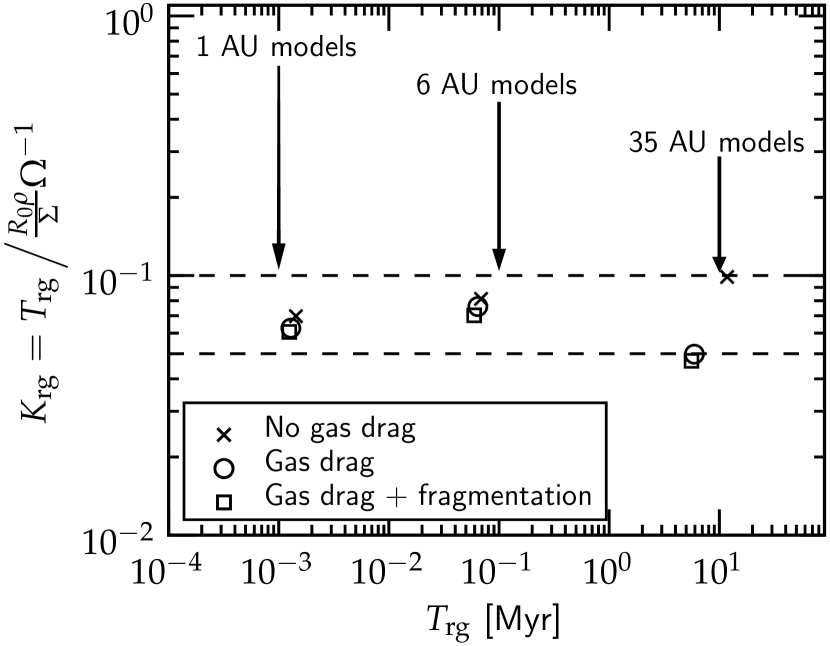
The simulations show that during the runaway growth stage grows exponentially with time ( is linear on a semilog plot) and an exponential fit is appropriate, with the runaway growth timescale (see Fig. 1b, thin solid line). In Fig. 2 this quantity has been plotted for several runs performed at 1, 6, and 35 AU. We express in terms of the fiducial timescale and derive the dimensionless ,
| (10) |
During the initial evolution (eq. [7]) and also (eq. [9]). We find that the size and velocity spectrum that develops during runaway growth enables the biggest body to accrete particles from all masses, i.e., also intermediate mass bodies (Ormel et al., 2010), which decreases compared to its 2-component estimate. Similarly, despite the fact that random velocities () increase during runaway growth, the stirring by a single biggest body is simply insignificant to shape the dynamical evolution of the smaller bodies. Instead it is the ensemble of large and intermediate mass bodies that produces the stirring. A two component approximation is just too simple a picture for the runaway growth phase.
4. The runaway growth/Oligarchy transition
Although initially and , during the runaway growth phase decreases and both and (especially) rapidly converge on . At the point where the runaway body starts to dynamically heat its environment at a rate faster than its previous accretion rate. Thus, from this point the runaway growth can no longer ‘outpace’ the stirring. A single body dominates its neighborhood in terms of both velocity evolution and accretion, meaning a much slower growth rate because accretion now becomes self-regulated. This is of course the key characteristic of oligarchy. Conversely, we may suspect that the condition heralds the end of the runaway growth stage and the transition to oligarchy.
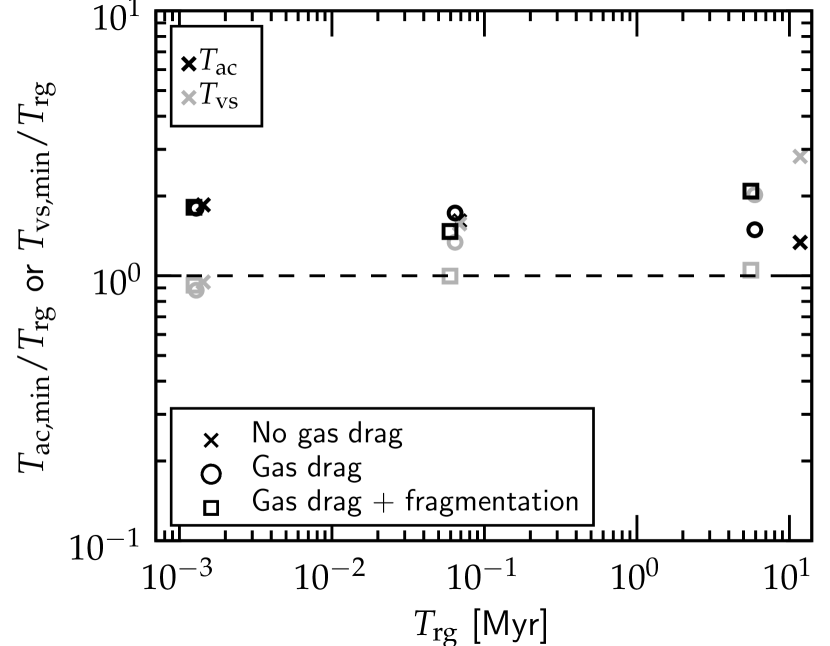
In Fig. 3 we have plotted the ratio of these timescales over at the point where is at its minimum (i.e., at ). In evaluating and we have taken (Greenzweig & Lissauer 1992; ) and (Stewart & Ida 2000, ). Because the vs. curve (Fig. 1b) differs from simulation to simulation (e.g., when including gas drag and fragmentation) the timescales and also evolve differently. However, from Fig. 3 it is clear that at all the relevant timescales are similar: , irrespective of the simulation. Thus, the 2-component model becomes first applicable at the point where gravitational focusing reaches its maximum. This is the start of oligarchy. From now on, loses its meaning (runaway growth ceases), increases, and accretion timescales are given by (which also increases).
Equating the relevant timescales, i.e., equations (7), (9), and (10), we solve for both and
| (11) | |||||
| (12) |
Equation (11) supersedes of equation (4) as the new criterion between the runaway growth and oligarchy accretion phases. Using the above expressions for and and inserting equation (3) for we find that equation (11) transforms into
| (13) | |||||
where the prefactor is 3 times larger than equation (4). Any order-of-unity uncertainty in the relation can be regarded as an uncertainty in the -factors, but this affects the prefactor only marginally. More fundamentally, equation (13) shows different dependencies on , , and, especially, . If is large, e.g., km, and give approximately the same values at 1 AU. A large is the favored outcome of recent numerical simulations involving a turbulent layer of densely packed boulders (Johansen et al., 2007, 2009). Then, the domain of runaway growth is rather limited (a factor three in size); but it still produces 103 km objects.
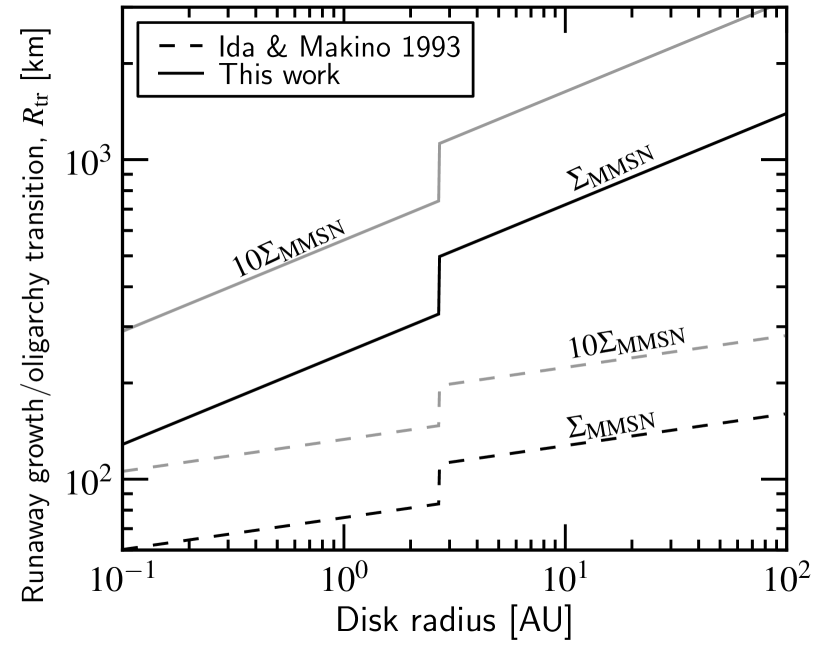
In Fig. 4 we illustrate the runaway growth/oligarchy turnover point of Ida & Makino (1993) (eq. [4], dashed lines) and equation (13) (solid lines) as function of distance for an initial planetesimal radius of and an internal density of . For we adopt a Minimum Mass Solar Nebula (MMSN) profile (Weidenschilling, 1977) (black lines) and a profile ten times larger than this (grey lines). In Figure 4 it can be seen that the difference between the two criteria becomes largest in the outer disk ( AU): whereas according to the Ida & Makino (1993) prescription the transition takes place at radii of 100 km, the new criterion shifts it upwards to 103 km.
5. Discussion
According to our findings, the transition between the runaway growth and oligarchic growth phases is characterized by the following properties:
-
•
A power-law size distribution of mass index , extending from the initial size to the transition size as given by equation (13);
-
•
The random velocity of the planetesimal bodies (of size ), via equation (12);
-
•
The timescale, via equation (10). Here, must be multiplied by a term to account for the several e-foldings of enjoyed growth. Then we obtain for the time until the transition. It is remarkable that this short timescale depends on the initial conditions only, a result that is unique to the runaway growth phase.
We assess the implications of these findings for the broader context of planet formation. First, we do not expect the final timescales of core formation to be much influenced by the new transition radius, since these are set by the much slower oligarchy stage that supersedes runaway growth. Indeed, semi-analytical studies of oligarchic growth required additional mechanisms like gas damping, fragmentation, or migration to produce embryos on reasonable timescales (e.g., Brunini & Benvenuto, 2008; Chambers, 2008). On the other hand, gap formation (Rafikov, 2003) will increase formation timescales.
Recently, Levison et al. (2010) investigate core-formation scenarios using -body techniques. The aim of that study was to understand how efficient planetesimal accretion proceeds during the phase where an Earth-size planetary embryo has to grow to a mass of to be able to accrete the nebula gas and become a gas giant. They recognize the importance of processes like planetesimal scattering, planetesimal orbital decay due to gas drag (both processes quench the growth), and planetesimal-driven embryo migration (which is conducive to growth). The outcome of these simulations, furthermore, is found to depend on the initial setup of the simulation, i.e., the size distribution of the planetesimals. Given the significance that is attached to the wholesale redistribution of matter, it would also be of interest to assess the importance of these effects for the early oligarchy stage, e.g., to perform body simulations with embryos radii starting at the transition mass .
The second implication of our study concerns the Kuiper belt. Our results strongly suggest that the Kuiper Belt is primarily the product of the runaway growth phase. First, assuming that the initial surface density is approximately MMSN or larger (), the biggest 103 km bodies (plutinos) can be produced by runaway growth. Second, the observed mass distribution for the largest Kuiper belt objects (KBOs) obeys a power-law with . Recent studies find a power-law size index (as in ) of (; Fraser & Kavelaars 2009) and (; Fuentes & Holman 2008). (The size distribution of the Kuiper belt’s smallest bodies is collisionally dominated, though, and is much lower.) The large , together with the fact that the KBO size distribution is continuous rather than bimodal as in the end stage of Fig. 1a, argue that it has evolved only very little since runaway growth and has not been significantly shaped by oligarchic growth.
In order to produce the KBOs in a sufficiently short time span, Kuiper Belt formation scenarios (e.g., Kenyon & Luu, 1998; Chiang et al., 2007) assume that the initial belt contained much more mass than the () that is present today (Bernstein et al., 2004). Neptune formation and/or another dynamical shakeup event (as in the Nice model) subsequently depleted 99% of its mass (Ford & Chiang, 2007; Levison et al., 2008). Using our results, we can verify these findings. Assuming AU, we find
| (14) | |||||
| (15) |
which readily shows the need for an enhanced surface density over the current one: for either becomes too low or too long. Thus, we conclude that the KBO size distribution as seen today is consistent with a scenario of being a leftover product of the initial runaway growth phase and has since been depleted. These findings are in line with the simulations of Kenyon & Bromley (2008, 2009), where growth also stalls after km bodies have been formed. Further growth is impeded since oligarchic accretion timescales become too long, even at enhanced surface densities.
References
- Barnes et al. (2009) Barnes, R., Quinn, T. R., Lissauer, J. J., & Richardson, D. C. 2009, Icarus, 203, 626
- Bernstein et al. (2004) Bernstein, G. M., Trilling, D. E., Allen, R. L., Brown, M. E., Holman, M., Malhotra, R., 2004, AJ 128, 1364–1390.
- Blum & Wurm (2008) Blum, J. & Wurm, G. 2008, ARA&A, 46, 21
- Bromley & Kenyon (2006) Bromley, B. C. & Kenyon, S. J. 2006, AJ, 131, 2737
- Brunini & Benvenuto (2008) Brunini, A. & Benvenuto, O. G. 2008, Icarus, 194, 800
- Chambers (2006) Chambers, J. 2006, Icarus, 180, 496
- Chambers (2008) Chambers, J. 2008, Icarus, 198, 256
- Chiang & Youdin (2009) Chiang, E. & Youdin, A. 2009, ArXiv e-prints
- Chiang et al. (2007) Chiang, E., Lithwick, Y., Murray-Clay, R., Buie, M., Grundy, W., Holman, M., 2007. In: B. Reipurth, D. Jewitt, & K. Keil (Ed.), Protostars and Planets V, pp. 895–911.
- Fortier et al. (2007) Fortier, A., Benvenuto, O. G., & Brunini, A. 2007, A&A, 473, 311
- Fraser & Kavelaars (2009) Fraser, W. C., Kavelaars, J. J., 2009, AJ, 137, 72
- Ford & Chiang (2007) Ford, E. B., Chiang, E. I., 2007, ApJ 661, 602–615.
- Fuentes & Holman (2008) Fuentes, C. I., Holman, M. J., 2008, AJ, 136, 83
- Goldreich et al. (2004) Goldreich, P., Lithwick, Y., & Sari, R. 2004, ARA&A, 42, 549
- Greenzweig & Lissauer (1992) Greenzweig, Y. & Lissauer, J. J. 1992, Icarus, 100, 440
- Ida & Makino (1993) Ida, S. & Makino, J. 1993, Icarus, 106, 210
- Ida et al. (1993) Ida, S., Kokubo, E., & Makino, J. 1993, MNRAS, 263, 875
- Ida & Lin (2004) Ida, S., Lin, D. N. C., 2004, ApJ 604, 388.
- Johansen et al. (2007) Johansen, A., Oishi, J. S., Low, M., Klahr, H., Henning, T., Youdin, A., 2007, Nature 448, 1022–1025.
- Johansen et al. (2009) Johansen, A., Youdin, A., Mac Low, M., 2009, ApJ 704, L75–L79.
- Kenyon & Bromley (2008) Kenyon, S. J. & Bromley, B. C. 2008, ApJS, 179, 451
- Kenyon & Bromley (2009) Kenyon, S. J., Bromley, B. C., 2009, ArXiv e-prints.
- Kenyon & Luu (1998) Kenyon, S. J., Luu, J. X., 1998, AJ 115, 2136–2160.
- Kokubo & Ida (1996) Kokubo, E. & Ida, S. 1996, Icarus, 123, 180
- Kokubo & Ida (1998) Kokubo, E., Ida, S., 1998, Icarus 131, 171–178.
- Kokubo & Ida (2000) Kokubo, E. & Ida, S. 2000, Icarus, 143, 15
- Lee (2000) Lee, M. H. 2000, Icarus, 143, 74
- Levison et al. (2008) Levison, H. F., Morbidelli, A., Vanlaerhoven, C., Gomes, R., Tsiganis, K., 2008, Icarus 196, 258–273.
- Levison et al. (2010) Levison, H. F., Thommes, E., Duncan, M. J., 2010, AJ 139, 1297–1314.
- Miguel & Brunini (2008) Miguel, Y., Brunini, A., 2008, MNRAS 387, 463–468.
- Mordasini et al. (2009) Mordasini, C., Alibert, Y., Benz, W., 2009, A&A 501, 1139
- Nakagawa et al. (1986) Nakagawa, Y., Sekiya, M., Hayashi, C., 1986, Icarus 67, 375–390.
- Ormel & Spaans (2008) Ormel, C. W. & Spaans, M. 2008, ApJ, 684, 1291
- Ormel et al. (2010) Ormel, C. W., Dullemond, C. P., & Spaans, M. 2010, Icarus, submitted
- Rafikov (2003) Rafikov, R. R. 2003, AJ, 125, 942
- Stewart & Ida (2000) Stewart, G. R. & Ida, S. 2000, Icarus, 143, 28
- Thommes et al. (2003) Thommes, E. W., Duncan, M. J., & Levison, H. F. 2003, Icarus, 161, 431
- Weidenschilling (1977) Weidenschilling, S. J. 1977, MNRAS, 180, 57
- Weidenschilling et al. (1997) Weidenschilling, S. J., Spaute, D., Davis, D. R., Marzari, F., & Ohtsuki, K. 1997, Icarus, 128, 429
- Wetherill & Stewart (1993) Wetherill, G. W. & Stewart, G. R. 1993, Icarus, 106, 190