22institutetext: Departament d’Astronomia i Meteorologia, Universitat de Barcelone, Mariti i Franquès 1, E–08028, Barcelona, Spain
POLLUX: a database of synthetic stellar spectra
Abstract
Aims. Synthetic spectra are needed to determine fundamental stellar and wind parameters of all types of stars. They are also used for the construction of theoretical spectral libraries helpful for stellar population synthesis. Therefore, a database of theoretical spectra is required to allow rapid and quantitative comparisons to spectroscopic data. We provide such a database offering an unprecedented coverage of the entire Hertzsprung-Russell diagram.
Methods. We present the POLLUX database of synthetic stellar spectra. For objects with T 6 000 K, MARCS atmosphere models are computed and the program TURBOSPECTRUM provides the synthetic spectra. ATLAS12 models are computed for stars with 7 000 K 15 000 K. SYNSPEC gives the corresponding spectra. Finally, the code CMFGEN provides atmosphere models for the hottest stars ( 25 000 K). Their spectra are computed with CMF_FLUX. Both high resolution (R150 000) optical spectra in the range 3 000 to 12 000 Å and spectral energy distributions extending from the UV to near–IR ranges are presented. These spectra cover the HR diagram at solar metallicity.
Results. We propose a wide variety of synthetic spectra for various types of stars in a format that is compliant with th Virtual Observatory standards. A user–friendly web interface allows an easy selection of spectra and data retrieval. Upcoming developments will include an extension to a large range of metallicities and to the near–IR high resolution spectra, as well as a better coverage of the HR diagram, with the inclusion of models for Wolf-Rayet stars and large datasets for cool stars. The POLLUX database is accessible at http://pollux.graal.univ-montp2.fr/ and through the Virtual Observatory.
Key Words.:
Astronomical data bases: Atlases – Stars: general – Techniques: spectroscopic1 Presentation and aim of the database
POLLUX is a database of synthetic stellar spectra developed at the GRAAL Laboratory (Université Montpellier II - CNRS). Its aim is to provide a comprehensive library of theoretical stellar spectra with a broad coverage of the atmospheric parameters (effective temperature Teff, gravity and metallicity [Fe/H]). Both high resolution optical spectra and spectral energy distributions are provided for O to M stars.
POLLUX spectra are expected to be useful to astrophysicists for stellar or
(extra–)galactic applications in several respects: accurate determination
of fundamental properties of stars, abundance determinations, radial
velocities and stellar dynamics, tests of the current state-of-the-art
model atmospheres, stellar population synthesis. POLLUX spectra can also be
used for teaching purposes oriented toward spectroscopy and model
atmospheres.
In a framework where various grids of model atmospheres,
SEDs and synthetic spectra computed with the MARCS111http://www.marcs.astro.uu.se/, ATLAS9222http://www.mpa-garching.mpg.de/PUBLICATIONS/DATA/SYNTHSTELLIB/synthetic_stellar_spectra.html and CMFGEN333http://kookaburra.phyast.pitt.edu/hillier/web/CMFGEN.htm codes
respectively are available on the internet, the originality of the POLLUX
database is manyfold. It is an evolutive interface that combines synthetic
spectra and spectral energy distributions based
on these three codes using the
same nomenclature, the same description and a common access
interface that is in compliance with the Virtual Observatory
standards. Among the
added values are the possibility of selective retrieval, an option that is
not commonly proposed, and that allows for the user to pre-select the data
needed, and the possibility to visualize prior to any download the spectra and their attached header files. Finally, the POLLUX database
is the only one providing CMFGEN based High Resolution Synthetic Spectra for O-type stars and soon also for Wolf-Rayet
stars.
In Sect. 2 we describe the content of the database. Then, in Sect. 3, we present briefly the atmosphere codes (MARCS, ATLAS12 and CMFGEN) used to produce the synthetic spectra. Sect. 4 describes the web interface to handle and retrieve the synthetic spectra. Finally, the orientation of the POLLUX database towards the Virtual Observatory is presented in Sect. 5 and future developments are listed in Sect. 6.
2 The database content
The database includes two types of spectra:
-
High Resolution Synthetic Spectra (HRSS data): they cover the optical range, from 3 000 to 12 000 Å. Their resolution – – is model-dependent, but always 150 000. In practice, CMFGEN spectra have =150 000, and MARCS/ATLAS spectra have a constant wavelength step of 0.02 Å leading to 150 000. POLLUX provides both absolute fluxes and spectra normalized to the theoretical continuum. The typical size of a HRSS ASCII file is 5.7 MB (CMFGEN), 15.4 MB (MARCS) or 14 MB (ATLAS).
-
Spectral Energy Distributions (SED data): covering the wavelength range 910 – 200 000 Å (50 – 200 000 Å for the hottest stars), they have a resolution of 20 000. The typical size of a SED ASCII file is 3.4 MB (CMFGEN), 3.2 MB (MARCS) or 1.6 MB (ATLAS).
A header file is attached to each data set (HRSS or SED). It contains a set of descriptors characterising stellar spectra (file structure and curation444Curation includes all information concerning the data sets that ensures they are available for discovery and re-use in the future. Number version of the code, data producer, date of production are part of the curation information. information). Also included in the header is specific information on the synthetic data (code, input physics, physical parameters characterising the spectrum and SED). This header file is designed to be useful within the framework of the Virtual Observatory (see Sect. 5).
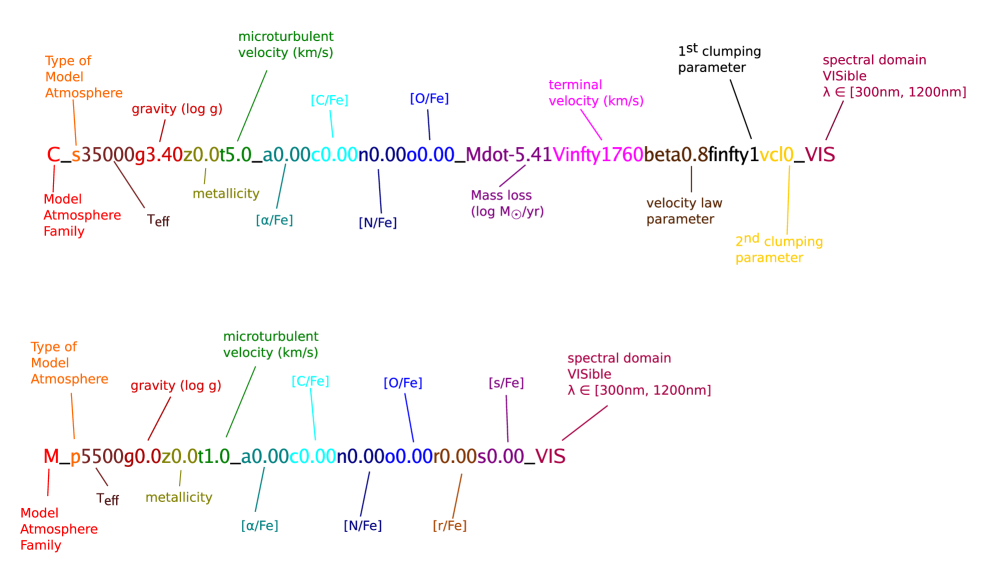
The nomenclature adopted to label the filenames is
presented in Fig.1. It is composed of the main parameters involved in
the spectrum computation (model and data types, stellar parameters,
specific abundances) and/or of parameters necessary to access the
spectrum in the database through the POLLUX request form (see
Section 4).
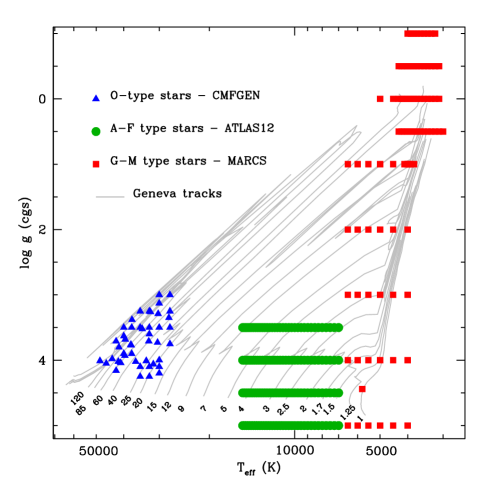
The current (Winter 2009/2010) version of the POLLUX database contains synthetic spectra (HRSS and SED) at solar metallicity ([Fe/H] = 0.0555The absolute solar metallicity (in mass fraction) depends on the adopted solar chemical composition and may vary among the data provided in the POLLUX database. This information is however accessible through the header attached to each data file.) representative of all the parts of the HR, with different refinement of the -Teff plane coverage according to the spectral type:
-
•
For G to M spectral types, the HRSS and SED based on MARCS model atmospheres span the domains Teff [3000 ; 6000 ] and [-1; 5] with steps of 500 and 1.0 dex respectively. The M spectral type is present in the database through data representative of red supergiants (luminosity class I and M spectral type; see Fig. 2 for current coverage).
-
•
For late B, A and F spectral types, the HRSS and SED based on ATLAS12 model atmospheres are provided in the domains Teff [7000 ; 15000 ] and [3.5; 5] with a refinement of 250 in Teff step and of 0.5 dex in step.
-
•
For O spectral type, the HRSS and SED based on CMFGEN model atmospheres have an irregular coverage of the (,Teff) plane with Teff ranging from 27500 to 49091 and [3.0; 4.250] (see Fig.2 for current coverage). These data partly follow evolutionary tracks and have been computed for the analysis of specific real stars.
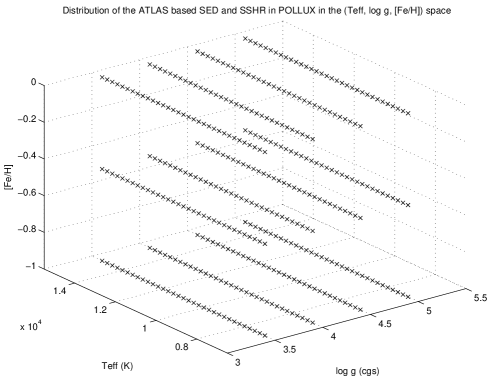
In addition to this, for late-B, A and F type stars, data based on the ATLAS12 model atmospheres are
also provided at [Fe/H] = -0.5 and [Fe/H] = -1.0 with the same coverage of
the (,Teff) plane as at [Fe/H] = 0.0 (see
Fig.3). Some additional data with non-solar [C/Fe],
[N/Fe] and [O/Fe] are also included for O stars, based on CMFGEN model
atmospheres, and for G and K stars based on MARCS model atmospheres.
The content will evolve in the near future, with the aim to fully cover the HR diagram in a very wide metallicity range.
3 Atmosphere codes and synthetic spectra
Our goal is to provide the best synthetic spectra across the entire HR diagram. To do so, we have selected three different atmosphere codes: MARCS, ATLAS12, and CMFGEN. These codes are best suited to model G to M, S and C stars, late B, A and F stars, and O and Wolf-Rayet stars respectively. To date there is no overlap in the POLLUX database between the temperature domain covered by each code (see previous section and Fig. 2). In particular there are no spectra available for B-type stars, the modeling of the atmospheres of these objects requiring different physics than those incorporated in the three aforementionned codes. Each code computes the atmospheric structure from which a formal solution of the radiation transfer is made using secondary tools: TURBOSPECTRUM, SYNSPEC and CMF_FLUX. Below, we give a short description of the assumptions and specificities of each code. We also present the scientific use that may be made of the spectra present in the database.
3.1 MARCS and TURBOSPECTRUM
For stars cooler than 6 000 K, models were computed with the atmosphere code MARCS (Gustafsson et al. 1975). The most recent version is described in Gustafsson et al. (2008). MARCS provides LTE plane–parallel or spherical models including line–blanketing and convection. The hydrostatic structure takes into account gas, radiation and turbulent pressure. It assumes a constant turbulent velocity. For the models used to generate the spectra available in POLLUX, a value of 1 km s-1 was used for all the models except those for red supergiants, for which the adopted value was 2 km s-1. The total flux is the sum of the radiative and convective fluxes. Convection is treated using the mixing length formalism (hereafter MLT) developed by Henyey et al. (1965). A value of 1.5 was chosen for the MLT parameter (where is the pressure scale height and the mixing length). All atomic and molecular level populations are computed under the assumption of LTE.
Line–blanketing is introduced using the Opacity Sampling formalism (Peytremann 1974; Sneden et al. 1976). Opacities come from various sources (Kurucz, TOPbase, VALD) or were computed by the MARCS team. They are listed in Sect. 4 of Gustafsson et al. (2008). In addition, molecular line lists are constantly added in order to improve the quality of the models and to solve problems related to specific stars and spectroscopic features.
The final synthetic spectra were computed with the code TURBOSPECTRUM. It is an enhanced version of the “Spectrum” package developed at Uppsala observatory and is widely based on the MARCS routines (Plez et al. 1993; Alvarez & Plez 1998). TURBOSPECTRUM uses MARCS models as input from which it computes a formal solution of the radiative transfer equation. Microturbulence is introduced to correctly reproduce line profiles, and is the same as that used in the associated MARCS model atmosphere, although this consistency is not critical (see in Gustafsson et al. 2008 the effect of microturbulence on the thermal structure of the models).
3.2 ATLAS12 and SYNSPEC
In the range of 7 000 K Teff 15 000 K, we have used ATLAS12 model atmospheres (Kurucz 2005a). This new version of the ATLAS LTE blanketed model atmospheres handles line opacity in stellar atmosphere using the Opacity Sampling technique. The models assume a plane parallel geometry, hydrostatic and radiative equilibrium, and LTE. Models from ATLAS12 can be generated for whichever individual abundances and microturbulent velocity. Convection in ATLAS12 also relies on the MLT formalism. Specifically, we have adopted Smalley’s prescriptions (Smalley 2004) for the values of the ratio of the mixing length to the pressure scale height (, see above). We have fixed the microturbulent velocity (constant with depth) to 2 km s-1 for all the models.
Continuous opacities are the same as in ATLAS9 and they are mainly: HI, H-, H, He I, He II, He- and a number of metallic absorbers such as C I-IV, Mg I-II, Al I, Si I-II,Fe I, Ca II, N II-V, O II-VI, Ne I-VI. Electron scattering, H-Rayleigh scattering, H2 Rayleigh scattering and He I Rayleigh scattering are also included.
The line opacity is computed starting from all the atomic and molecular
lines of line lists from Kurucz’s CD-ROMs.
The synthetic spectra are finally computed using the SYNSPEC tool.
SYNSPEC (Hubeny & Lanz 1992) is a general LTE spectrum synthesis program that reads
an ATLAS model atmosphere and a general line list and dynamically selects
lines which contribute to the total opacity, based on physical parameters
of the actual model atmosphere. SYNSPEC then solves the radiative transfer
equation, wavelength by wavelength, in a specified wavelength range, and
with a specified wavelength resolution. The microturbulence velocity was
fixed at 2 km s-1.
For the computation of a HRSS, the line list used in SYNSPEC is the same as the one used in TURBOSPECTRUM for cool stars. On the other hand, in case of the SEDs, we used Kurucz’s gfall.dat666http://kurucz.harvard.edu/LINELISTS/GFALL/ list, from which we selected the lines between 9 00 and 20 000 Å.
3.3 CMFGEN and CMF_FLUX
Synthetic spectra of stars hotter than 25 000 K are computed using the codes CMFGEN and CMF_FLUX. CMFGEN is developped by John Hillier at the University of Pittsburgh. An exhaustive description can be found in Hillier & Miller (1998). A web page (http://kookaburra.phyast.pitt.edu/hillier/web/CMFGEN.htm) provides further information and regular updates.
CMFGEN allows the computation of non–LTE, line–blanketed atmospheres models including stellar winds. It solves, in 1D, the statistical and radiative transfer equations assuming spherical geometry. A co–moving frame is used. CMFGEN is not a hydrodynamic code: the density structure must be specified as an input. In practice, the pseudo–photospheric structure resulting from TLUSTY models (Lanz & Hubeny 2003) is used and is connected to a so–called –velocity law (e.g. Lamers & Cassinelli 1999) to give the input velocity structure. The density structure directly follows from mass conservation. The –velocity law has been shown to be a good approximation of the outer structure of the winds of hot massive stars (Castor et al. 1975; Pauldrach et al. 1986). Sixty depth points are usually included for a good sampling of the input structure. Recently, a partial iteration of the hydrodynamic structure in the inner atmosphere has been implemented (see a brief description in Martins et al. 2009). This is especially relevant for Wolf-Rayet stars for which SED and SSHR data will be soon included in the database.
CMFGEN allows the inclusion of clumping with the following formalism. A volume filling factor is assumed to vary monotonically with depth, starting from a value of 1 at the photosphere and reaching a maximum value at the outer boundary of the atmosphere. In practice, is parametrized as a function of the local wind velocity
| (1) |
where is a parameter fixing the velocity at which clumping starts to become significant. Values for vary between 30 and 200 km s-1. The filling factor given in the POLLUX header is and is classically close to 0.1 (Hillier 1991; Hillier et al. 2003a; Bouret et al. 2005; Martins et al. 2009).
Line–blanketing is included using the super–level approximation: levels of similar energies are grouped into a single super–level which is used to compute the statistical and radiative transfer equations. Within a super–level, the populations of individual levels are assumed to follow LTE conditions. Models without any super–level (i.e. all levels are treated individually) can in principle be computed, but the amount of RAM necessary is prohibitive. In practice, standard models currently include: H, He, C, N, O, Si, S, Fe. Other elements such as Ar, Ca, Ne, Ni are sometimes included for a better treatment of line–blanketing. However, line–blanketing effects are mainly due to Fe (e.g. Martins et al. 2002). Typical models include 2 000 to 5 000 levels grouped in about 1 000 to 2 000 super–levels, requiring 1 to 3 Gb of RAM.
For the computation of the atmospheric structure, Doppler line profiles are used. Broadening by a microturbulent velocity can be added. This velocity is fixed within the atmosphere. Values of 5 to 50 are chosen depending on the type of star. Atomic data are mainly taken from the Opacity Project database (Badnell et al. 2005; Seaton 2005) and are occasionally complemented by specific line lists.
Once obtained, the atmosphere structure is held fixed and a formal solution of the radiative transfer equation in the observer’s frame is performed to yield the final synthetic spectrum. The code CMF_FLUX is used (Hillier & Miller 1998). Voigt line profile including Stark broadening are specified for individual lines. A depth–variable microturbulent velocity can be used, starting from a minimum value at the photosphere (5 to 50 km s-1) and increasing linearly to a maximum value (usually 10% of the maximum wind velocity). The detailed spectrum and the theoretical continuum can be computed separately, allowing the production of normalized spectra. In the case of CMFGEN/CMF_FLUX models, both the HRSS and the SED data result from CMF_FLUX computations.
3.4 Science with POLLUX data
The spectra (and SED) computed with the codes described above allow at
present a partial coverage of the HR diagram as can be seen on
Fig. 2. The database does not include spectra nor SED
for early B type stars. This gap should partly be filled in forthcoming
releases for B-type supergiants with spectra based on CMFGEN models. On the
other hand, main sequence B-type stars fall at the lower (upper)
temperature limit of the validity of CMFGEN (ATLAS) models, and neither
codes are really adapted to provide spectra for these objects. Concerning
the transition between G and F-type stars, we do not include any overlap
between the warm models based on ATLAS atmospheres and the cool models
based on MARCS atmospheres. The lack of overlap in the present version of
the database denotes the limits of full validity of the model atmospheres
that have been used so far to generate the spectra in POLLUX. Actually, a
series of works based on ATLAS9 model atmospheres have been published in
the last decade providing SEDs and synthetic spectra down to low
temperatures (Munari & Tomasella 1999; Munari & Castelli 2000; Castelli & Munari 2001; Bertone et al. 2008) with
reasonable success. However, the use of ATLAS models to analyze stars with
temperatures lower than 7000 K is hampered by the incomplete treatment of
molecules, as parlty discussed by Kurucz (2005b). This is the main reason
why in the POLLUX database, the ATLAS code has been used only for effective
temperature larger than 7000 K, ensuring that molecules can be
neglected.
The data (SEDs and HRSS) available in the POLLUX database
have been designed to serve several purposes, from population synthesis to
fundamental parameters determinations. The physics used in the model
atmospheres and the spectral synthesis codes have been validated by direct
comparison to observed spectra in each range of temperature:
-
•
CMFGEN/CMF_FLUX models have been repeatedly and successfully compared to observed spectra to derive wind properties and stellar parameters for O-type and Wolf-Rayet stars (Hillier et al. 2003b; Bouret et al. 2003; Martins et al. 2005; Bouret et al. 2008; Martins et al. 2009). Part of the CMFGEN SEDs included in the POLLUX database have been used by Martins & Plez (2006) to build the most recent calibration of the photometry of O stars. Two systems have been adopted: Johnson-Cousins for the optical range (UBV) and Johnson-Glass for the near-infrared (JHK). The resulting calibrations provides a set of magnitudes and colors as well as bolometric corrections for a given spectral type. These calibrations are widely used in massive stars studies to infer luminosities of newborn, embedded massive stars and bona-fide O stars (e.g. Zavagno et al. 2007; Deharveng et al. 2009).
-
•
The version ATLAS9 of the ATLAS/Kurucz code for model atmospheres has been compared to observed spectra and combined with the SYNSPEC or the SYNTHE spectral synthesis modules to determine fundamental parameters and chemical abundances (Castelli et al. 1997; Castelli 1999; Gebran et al. 2008; Gebran & Monier 2008). It has also been used to compute synthetic colors successfully confronted to the colors of real stars (Castelli 1999). On the other hand, there are only a few works published using the newer ATLAS12 version of ATLAS, where major modification of the treatment of opacities have been implemented. We may however cite Castelli et al. (2009); Hubrig et al. (2009), who have used ATLAS12/SYNTHE for abundance and stellar parameters determinations in chemically peculiar B-type stars. As shown by Gebran (2007) and Gebran et al. (2008), the atmospheric structure of plan-parallel LTE models computed for A and F type stars with ATLAS9 and ATLAS12 codes are in very good agreement.
-
•
MARCS model atmospheres and synthetic spectra computed with TURBOSPECTRUM have been widely used to derive fundamental parameters and abundances of late-type stars (in particular G and later types) . The comparison to observed spectra has shown the ability of these models to reproduce both SEDs and high-resolution spectra (Alvarez & Plez 1998; Edvardsson 2008; Plez 2008). Synthetic photometry has been calculated for stars ranging from dwarfs to giants by Bessell et al. (1998) and Buzzoni et al. (2010) for Johnson-Cousins passbands, or by Önehag et al. (2009) for Strömgren filters, that successfully match observations. Detailed spectrophotometric fits could be obtained for red supergiants in the Galaxy, the Magellanic Clouds, and M31 by Levesque et al. (2005, 2006, 2007) and by Massey et al. (2008, 2009). Red supergiants parameters derived from these calculations lead to evolutionary sequences matching observations. A very large number of contributions to studies of nucleosynthesis and chemical evolution have used MARCS model spectra. They include the derivation of abundances for large samples of Galactic stars (e.g. Edvardsson et al. 1993), of very metal-poor stars (e.g. Bonifacio et al. 2009, and references therein), and of carbon stars (e.g. Wahlin et al. 2006) and AGB stars (García-Hernández et al. 2007).
4 The POLLUX web site
The POLLUX database is accessible via the URL: http://pollux.graal.univ-montp2.fr. Below, we describe how to use the web interface to browse through the database and retrieve data.
The web page and the database have been elaborated using Plone and Python languages. The web page is designed to be user friendly, and to allow inexperienced users to easily access, visualise and retrieve the data. The homepage contains a documented user’s guide and a link labelled Access to the POLLUX Database that leads to the POLLUX query form.
4.1 Query Interface
The POLLUX query form is divided into two parts. On the left side, a tree selection area allows to define the general database parameters, by choosing :
-
–
the Type of Data (high resolution spectrum, SED or both)
-
–
the Model Atmosphere the data are based on (MARCS, CMFGEN, ATLAS or all)
-
–
the Type of Model Atmosphere (plane-parallel, spherical or both).
This first query is hierarchical. The default query concerns the entire database (SED+HRSS from MARCS, ATLAS12 and CMFGEN, for both plane-parallel and spherical model atmospheres).
Once the choice of the general database parameters has been made, the user must specify the spectrum parameters. The allowed query depends on the Model Atmosphere Family that has been chosen from the tree query section, and then some irrelevant fields may automatically appear as frozen. At that stage, the different spectrum parameters that can be selected are :
-
–
effective temperature
-
–
log g
-
–
mass (irrelevant for data derived from MARCS and ATLAS plane-parallel model atmospheres)
-
–
luminosity (irrelevant for data derived from MARCS and ATLAS plane-parallel model atmospheres)
-
–
microturbulent velocity
-
–
metallicity [Fe/H]
The user must either choose a value interval or choose an exact value, for at least one of these spectrum parameters. If the exact value requested is not available in the database, an error message will be returned. The lowest and highest authorized values are indicated along the query zones.
A third optional query block is also available, which enables the user to choose data sets with specific abundances such as Carbon, Nitrogen, Oxygen, -, - and - elements.
A final block indicates the Cart Status (the designed facility to download files, see Section 4.3). The possibility to clear cart is proposed at that stage.
4.2 Result of Request
The result of the request consists of a table (dispatched on several pages if needed) containing three main parts : Display , Data Characteristics and Cart.
4.2.1 Display
Four columns are ordered as follows:
-
1.
Selection zone allowing (through the OVERPLOT command) the graphical display of one to three spectra in a popup window,
-
2.
Clickable icon allowing the graphical display of the spectrum in a popup window,
-
3.
Clickable icon allowing the graphical display of the spectrum normalised to the continuum if relevant in a popup window,
-
4.
Clickable icon allowing the display of the ASCII header file in a popup window.
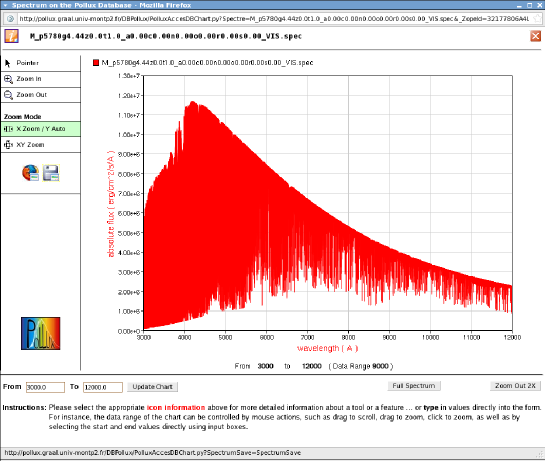
The graphical tool that allows the visualisation of the SED and spectrum integrates a pointer and different zoom facilities. It also includes a help button. Fig. 4 shows a snaphshot of a representative window.The image displayed in this window can be saved in a png format. The overplot tool displays simultaneously one to three spectra, in absolute flux or flux relative to continuum. It offers the same functionality (pointer, zoom, …) as the basic graphical tool.
4.2.2 Data Characteristics
Columns 5 to 19 of the table present the data characteristics,
-
5.
Data Type (of model atmosphere)
-
6.
Model (atmosphere family)
-
7.
Type (of model atmosphere)
-
8.
Teff
-
9.
log g
-
10.
M / M⊙
-
11.
log L/L⊙
-
12.
microturbulent velocity
-
13.
[Fe/H]
-
14.
[-elements/H]
-
15.
[C/H]
-
16.
[O/H]
-
17.
[N/H]
-
18.
[-elements/H]
-
19.
[-elements/H]
4.2.3 Cart
The last two columns of the table allow
-
20.
either to directly download a gzipped tar archive filename.tgz containing the pair spectrum (or SED) + associated header in ASCII format
-
21.
or to select various rows and fill a cart with the data that the user wishes to download.
The column with the cart ends with a cart icon that, when clicked, leads to the retrieval page.
4.3 Cart and Retrieval
This last page is divided into two parts. In its central section, a table lists the data stored in the cart. The columns are ordered as follows :
-
1.
Select or unselect the file which will actually be included in the downloadable archive.
-
2.
Icon to remove the data set from the cart.
-
3.
Filename (as explicitly described in Fig. 1).
-
4.
Type of data (Spectral Energy Distribution or High Resolution Synthetic Spectrum).
-
5.
Size of the compressed archive file that will be retrieved (this file contains the data set and the associated ASCII header file).
On the left side of the page, the user can choose the file and archive type. As of December 2009, the available formats for the data are Flat Table (ASCII), XML VOTable (including binary XML VOTable), and FITS. The archive can either be a tar file or a zip file. The total size of the archive is also given. In the Flat Table format (ASCII files), the user will retrieve a pair of files for each data set, namely the actual data file and its associated header, the name of which is the same except for the final extension.
5 Orientation towards the Virtual Observatory
The evolution of POLLUX towards a Virtual Observatory (VO) compliant service has recently started and is still under promising development. The POLLUX data can now be retrieved in various formats, including VOTable and FITS compatible with the standards of the VO. Files in format XML VOTable, XML Binary VOTable and FITS have been generated using the TOPCAT tool (Tool for OPerations on Catalogues And Tables777http://www.star.bristol.ac.uk/ mbt/topcat/).
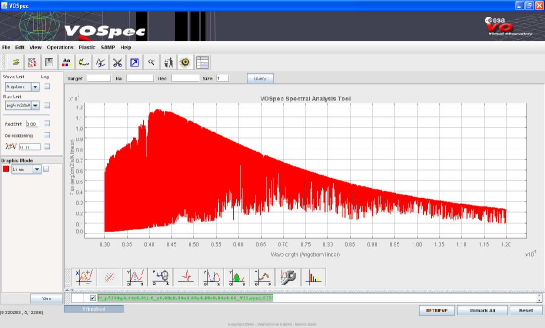
The POLLUX spectra can already be handled through some services of the Virtual Observatory, such as VOSpec888http://esavo.esa.int/vospec/ (see Fig. 5) or Aladin999http://aladin.u-strasbg.fr/aladin.gml. POLLUX is registered in the different registries101010In particular in the EURO-VO registry (http://registry.euro-vo.org/) and the NVO registry (http://nvo.stsci.edu/vor10/index.aspx). as a service using the Simple Spectra Access Protocol (SSAP, Tody et al. 2008) and the Theoretical Spectra Access Protocol (TSAP). The SSAP defines a uniform interface to track and access 1-D spectra. However, being originally designed to access observational data, it cannot be used directly to query the POLLUX database. A way to work around the impossibility to locate (with coordinates on the sky) the synthetic spectra is to use the FORMAT=METADATA mechanism to query theoretical data in the context of the SSAP. This corresponds to the TSAP, that has been included in the SSAP as a use case111111see Appendix A in http://www.ivoa.net/Documents/ latest/SSA.html, and that allows to make a query and visualize data from the POLLUX database using the VOSpec tool as shown in Fig. 5 for the POLLUX MARCS solar spectrum in units of absolute flux versus wavelength.
All the relevant characteristics of the data, appearing in the POLLUX query forms, as well as those listed in the header files coming with any POLLUX spectra, have been associated to an Unified Content Descriptor (UCD121212http://www.ivoa.net/Documents/latest/UCD.html, Derriere et al. 2005) that ensures the data interoperability within the VO context.
Finally, the Pollux database has been registered as a VO service providing theoretical spectra that can be handled, through VO tools, within the framework of Science Cases. In particular two scientific applications are already in progress :
-
1.
The connexion to spectroscopic or spectropolarimetric instruments archives, such as the Castor project131313http://magics.bagn.obs-mip.fr/indexCastor.html, the legacy database of spectropolarimetric observations collected with the ESPaDOnS and NARVAL instruments. The link between these two databases (providing respectively theoretical and observed ressources) will be insured with the help of the MATISSE algorithm (Recio-Blanco et al. 2006). Using a selection of theoretical POLLUX spectra as reference, this automated algorithm will derive stellar atmospheric parameters and chemical abundances (Teff, , global metallicity and ) for each Castor spectrum.
-
2.
An application with the Meudon PDR code141414http://pdr.obspm.fr/PDRcode.html (Le Petit et al. 2006). This code will compute the atomic and molecular structure of interstellar clouds, using a theoretical POLLUX SED to light up the stellar formation region. In a second step, a coupling of the PDR code to theoretical POLLUX spectra and to observed FUSE data is foreseen. Through several VO tasks, the aim is to simulate a complete line of sight, from the stellar luminous source to the absorbing diffuse medium, and to compare it to available FUSE observations.
6 Upcoming developments
At present non-solar metallicity data are only available in POLLUX for late B, A and F spectral types (7000 Teff ). Data at sub-solar metallicities for cool stars (G to M types) should be made available in a forthcoming release. A large dataset of HRSS based on the latest generation of MARCS model atmospheres produced for scientific purposes increasing the HR diagram coverage could be included shortly. In particular, new SED and HRSS data sets derived from the MARCS model atmospheres will be added at [Fe/H] = -1.0, -2.0, -3.0, -4.0 and -5.0. Additional data with non-solar CNO abundances will also be made available for cool stars. Data with enhanced [C/Fe] are already available in the effective temperature range Teff [4000 ; 6000 ].
Concerning hot and massive stars, additional data (HRSS and SED) related to B-type supergiants and Wolf-Rayet stars will be derived from CMFGEN model atmospheres and progressively included in the database. The introduction of Wolf-Rayet spectra requires a modification of the query interface and the creation of specific header files due to the importance of parameters that describe exclusively these kind of objects. This modification has already been done anticipating this development.
In a second time, high resolution synthetic spectra covering the infrared domain will be progressively made available. However, this step still requires improvements in the production of atomic and molecular line lists.
Acknowledgements.
We warmly thank D.J. Hillier for making his code CMFGEN available to the community. The POLLUX team warmly thanks P. Maeght for his help in the process of including POLLUX in the Virtual Observatory. We acknowledge financial support from ”Programme National de Physique Stellaire” (PNPS) and ”Action Spécifique Observatoire Virtuel” (ASOV) of CNRS/INSU, France.References
- Alvarez & Plez (1998) Alvarez, R. & Plez, B. 1998, A&A, 330, 1109
- Badnell et al. (2005) Badnell, N. R., Bautista, M. A., Butler, K., et al. 2005, MNRAS, 360, 458
- Bertone et al. (2008) Bertone, E., Buzzoni, A., Chávez, M., & Rodríguez-Merino, L. H. 2008, A&A, 485, 823
- Bessell et al. (1998) Bessell, M. S., Castelli, F., & Plez, B. 1998, A&A, 333, 231
- Bonifacio et al. (2009) Bonifacio, P., Spite, M., Cayrel, R., et al. 2009, A&A, 501, 519
- Bouret et al. (2008) Bouret, J., Donati, J., Martins, F., et al. 2008, MNRAS, 389, 75
- Bouret et al. (2003) Bouret, J., Lanz, T., Hillier, D. J., et al. 2003, ApJ, 595, 1182
- Bouret et al. (2005) Bouret, J.-C., Lanz, T., & Hillier, D. J. 2005, A&A, 438, 301
- Buzzoni et al. (2010) Buzzoni, A., Patelli, L., Bellazzini, M., Pecci, F. F., & Oliva, E. 2010, MNRAS, 213
- Castelli (1999) Castelli, F. 1999, A&A, 346, 564
- Castelli et al. (1997) Castelli, F., Gratton, R. G., & Kurucz, R. L. 1997, A&A, 318, 841
- Castelli et al. (2009) Castelli, F., Kurucz, R., & Hubrig, S. 2009, A&A, 508, 401
- Castelli & Munari (2001) Castelli, F. & Munari, U. 2001, A&A, 366, 1003
- Castor et al. (1975) Castor, J. I., Abbott, D. C., & Klein, R. I. 1975, ApJ, 195, 157
- Deharveng et al. (2009) Deharveng, L., Zavagno, A., Schuller, F., et al. 2009, A&A, 496, 177
- Derriere et al. (2005) Derriere, S., Gray, N., Preite Martinez, A., et al. 2005, in IVOA Recommendation : An IVOA Standard for Unified Content Descriptors, Version 1.10, ed. S. Derriere, A. Preite Martinez, & R. Williams
- Edvardsson (2008) Edvardsson, B. 2008, Physica Scripta Volume T, 133, 014011
- Edvardsson et al. (1993) Edvardsson, B., Andersen, J., Gustafsson, B., et al. 1993, A&A, 275, 101
- García-Hernández et al. (2007) García-Hernández, D. A., García-Lario, P., Plez, B., et al. 2007, A&A, 462, 711
- Gebran (2007) Gebran, M. 2007, PhD thesis, Université Montpellier II
- Gebran & Monier (2008) Gebran, M. & Monier, R. 2008, A&A, 483, 567
- Gebran et al. (2008) Gebran, M., Monier, R., & Richard, O. 2008, A&A, 479, 189
- Gustafsson et al. (1975) Gustafsson, B., Bell, R. A., Eriksson, K., & Nordlund, A. 1975, A&A, 42, 407
- Gustafsson et al. (2008) Gustafsson, B., Edvardsson, B., Eriksson, K., et al. 2008, A&A, 486, 951
- Henyey et al. (1965) Henyey, L., Vardya, M. S., & Bodenheimer, P. 1965, ApJ, 142, 841
- Hillier (1991) Hillier, D. J. 1991, A&A, 247, 455
- Hillier et al. (2003a) Hillier, D. J., Lanz, T., Heap, S. R., et al. 2003a, ApJ, 588, 1039
- Hillier et al. (2003b) Hillier, D. J., Lanz, T., Heap, S. R., et al. 2003b, ApJ, 588, 1039
- Hillier & Miller (1998) Hillier, D. J. & Miller, D. L. 1998, ApJ, 496, 407
- Hubeny & Lanz (1992) Hubeny, I. & Lanz, T. 1992, A&A, 262, 501
- Hubrig et al. (2009) Hubrig, S., Castelli, F., de Silva, G., et al. 2009, A&A, 499, 865
- Kurucz (2005a) Kurucz, R. L. 2005a, Memorie della Societa Astronomica Italiana Supplement, 8, 189
- Kurucz (2005b) Kurucz, R. L. 2005b, Memorie della Societa Astronomica Italiana Supplement, 8, 73
- Lamers & Cassinelli (1999) Lamers, H. J. G. L. M. & Cassinelli, J. P. 1999, Introduction to Stellar Winds, ed. H. J. G. L. M. Lamers & J. P. Cassinelli
- Lanz & Hubeny (2003) Lanz, T. & Hubeny, I. 2003, ApJS, 146, 417
- Le Petit et al. (2006) Le Petit, F., Nehmé, C., Le Bourlot, J., & Roueff, E. 2006, ApJS, 164, 506
- Levesque et al. (2007) Levesque, E. M., Massey, P., Olsen, K. A. G., & Plez, B. 2007, ApJ, 667, 202
- Levesque et al. (2005) Levesque, E. M., Massey, P., Olsen, K. A. G., et al. 2005, ApJ, 628, 973
- Levesque et al. (2006) Levesque, E. M., Massey, P., Olsen, K. A. G., et al. 2006, ApJ, 645, 1102
- Martins et al. (2009) Martins, F., Hillier, D. J., Bouret, J. C., et al. 2009, A&A, 495, 257
- Martins & Plez (2006) Martins, F. & Plez, B. 2006, A&A, 457, 637
- Martins et al. (2002) Martins, F., Schaerer, D., & Hillier, D. J. 2002, A&A, 382, 999
- Martins et al. (2005) Martins, F., Schaerer, D., Hillier, D. J., et al. 2005, A&A, 441, 735
- Massey et al. (2008) Massey, P., Levesque, E. M., Plez, B., & Olsen, K. A. G. 2008, in IAU Symposium, Vol. 250, IAU Symposium, ed. F. Bresolin, P. A. Crowther, & J. Puls, 97–110
- Massey et al. (2009) Massey, P., Silva, D. R., Levesque, E. M., et al. 2009, ApJ, 703, 420
- Munari & Castelli (2000) Munari, U. & Castelli, F. 2000, A&AS, 141, 141
- Munari & Tomasella (1999) Munari, U. & Tomasella, L. 1999, A&AS, 137, 521
- Önehag et al. (2009) Önehag, A., Gustafsson, B., Eriksson, K., & Edvardsson, B. 2009, A&A, 498, 527
- Pauldrach et al. (1986) Pauldrach, A., Puls, J., & Kudritzki, R. P. 1986, A&A, 164, 86
- Peytremann (1974) Peytremann, E. 1974, A&AS, 18, 81
- Plez (2008) Plez, B. 2008, Physica Scripta Volume T, 133, 014003
- Plez et al. (1993) Plez, B., Smith, V. V., & Lambert, D. L. 1993, ApJ, 418, 812
- Recio-Blanco et al. (2006) Recio-Blanco, A., Bijaoui, A., & de Laverny, P. 2006, MNRAS, 370, 141
- Seaton (2005) Seaton, M. J. 2005, MNRAS, 362, L1
- Smalley (2004) Smalley, B. 2004, in IAU Symposium, Vol. 224, The A-Star Puzzle, ed. J. Zverko, J. Ziznovsky, S. J. Adelman, & W. W. Weiss, 131–138
- Sneden et al. (1976) Sneden, C., Johnson, H. R., & Krupp, B. M. 1976, ApJ, 204, 281
- Tody et al. (2008) Tody, D., Dolensky, M., McDowell, J., et al. 2008, in IVOA Recommendation : Simple Spectral Access Protocol, Version 1.04, ed. D. Tody & M. Dolensky
- Wahlin et al. (2006) Wahlin, R., Eriksson, K., Gustafsson, B., et al. 2006, Memorie della Societa Astronomica Italiana, 77, 955
- Zavagno et al. (2007) Zavagno, A., Pomarès, M., Deharveng, L., et al. 2007, A&A, 472, 835