Aspiration of biological viscoelastic drops
Abstract
Spherical cellular aggregates are in vitro systems to study the physical and biophysical properties of tissues. We present a novel approach to characterize the mechanical properties of cellular aggregates using micropipette aspiration technique. We observe an aspiration in two distinct regimes, a fast elastic deformation followed by a viscous flow. We develop a model based on this viscoelastic behavior to deduce the surface tension, viscosity, and elastic modulus. A major result is the increase of the surface tension with the applied force, interpreted as an effect of cellular mechanosensing.
pacs:
87.18.R, 87.18.Ed, 87.18.FxEmbryonic morphogenesis, wound healing, cancer growth and metastasis are a few examples where the physical laws play an important role along with genetic cues in the functioning of a tissue. An aggregate of living cells, used as a model tissue, behaves like a viscoelastic liquid. Spreading and sorting are signatures of liquid-like behavior of embryonic tissues Gordon:72p43 ; Foty:1994p1001 . Moreover, cellular aggregates in solution round up to form “spheroids” in order to minimize their surface energy, similar to oil drops in water. This is a manifestation of surface tension, which has been related to intercellular adhesion energy Foty2005255 . In the past, the simple analogy between liquids and tissues has lead to valuable findings about the mechanics of embryonic mutual envelopment Foty:1996p967 , tissue spreading Ryan:2001p969 , and cancer propagation Foty:cancer . A knowledge of the surface tension of tissues has also been essential for organ printing in tissue engineering Jakab:2008p413 .
To measure the surface tension of cellular aggregates and investigate the role of surface tension in cell sorting, Steinberg and coworkers Foty:1994p1001 introduced the parallel plate compression apparatus, which has since been used by other groups Norotte:2008p1000 ; Mgharbel:2009p952 . In this method, an aggregate is subjected to an imposed deformation and the surface tension is inferred from the relaxation force, while the viscosity of the tissue is obtained from the shape relaxation Mombach:2005p1003 . Difficulties in the evaluation of the principal radii of a compressed aggregate and the contact angle between the aggregate and the plate make this technique rather delicate. Deformation of aggregates under centrifugal forces is an alternative way that has been used to classify aggregates of various cell types phil69 . Recently this technique has been combined with Axisymmetric drop shape analysis (ASDA) for measuring the surface tension of embryonic tissue Kalantarian:2009p1161 .
In this letter, we propose the use of micropipette aspiration technique to study the surface tension and the mechanical properties of cellular aggregates. This technique has previously been used to evaluate the viscoelastic properties of single cells Sato:1990p1004 ; Evans:1989p200 and the stiffness of tissues Aoki:1997p985 ; Butcher:2007p1002 ; ToshiroOhashi:2005p1160 at small deformations. For a Newtonian fluid, the aspiration dynamics is governed by the Washburn law, , where is the advancement of the liquid inside the pipette wash . For a tissue, a completely different behavior is observed due to its viscoelastic properties. Under applied stress , a tissue responds like an elastic solid at times shorter than a characteristic time Chu:1975p984 , and like a fluid for . This behavior can be described by , where is the strain; the viscosity , of the material is related to its elastic modulus , through landau . In the case of parallel plate compression, is constant and the stress relaxes to equilibrium, whereas for the case of aspiration, stays constant and the tissue flows.
Spherical cellular aggregates are useful systems to study the mechanical properties of tissues since the adhesion energy between the subunits (cells) can be controlled. We have used murin sarcoma (S180) cell lines transfected to express various levels of E-cadherin molecules at the surface of the cells Chu:2004p968 , thereby controlling the intercellular adhesion energy. Here, we focus on the most adhesive cell lines. Cells were cultured under 5 air/ 5 CO2 atmosphere in DMEM enriched with 10 calf serum (culture medium) and prepared for aggregation following a procedure similar to Ryan et al.’s Ryan:2001p969 . Aggregates ranging from 250 m to 400 m in diameter were obtained from 5 ml of cell suspension in CO2-equilibrated culture medium at a concentration of cells per ml in 25 ml erlenmeyer flasks, and placed in a gyratory shaker at 75 rpm at 37∘C for 24 hours. The flasks were pretreated with 2 dimethylchlorosilane in chloroform and coated with silicon to prevent adhesion of cells to the glass surface. We performed the aspiration of the aggregates using pipettes with diameters 3-5 times that of a single cell (40-70 m). The pipettes were fabricated by pulling borosilicate capillaries ( mm/ mm O/I diameter) with a laser-based puller (P-2000, Sutter Inst. Co, Novato, CA ), and sized to the desired diameter by using a quartz tile. To prevent adhesion of the cells to the micropipette walls, the pipettes were incubated in 0.1 mg/ml PolyEthyleneGlycol-PolyLysin (PLL(20)-g[3.5]-PEG(2), Surface Solution, Dubendorf Switzerland) in HEPES solution (pH 7.3) for one hour. The observation chamber consisted of a thick U-shaped Parafilm spacer (2 cm2 cm5 mm), sandwiched in between two microscope slides by gentle heating. Aggregates were then suspended in CO2 equilibrated culture medium and the pipette was introduced into the chamber. To prevent evaporation, the open end was sealed with mineral oil. A large range of pressures ( kPa) was attained by vertically displacing a water reservoir, connected to the pipette, with respect to the observation chamber. Aspirated aggregates were visualized on an inverted microscope (Zeiss Axiovert 100) equipped with a 20 air objective (NA 0.45). Movies of the advancement of the aggregates inside the pipette were recorded with a CCD camera (Luca-R, Andor, Belfast UK) with a 5-30 second interval. Cell viability in aspirated aggregates was checked using trypan blue exclusion test. After 3 hours of aspiration, trypan blue was added to the experimental chamber to a final concentartion of . A small number of dead cell were present at the core of the aggregate, comparable to the aggregates at rest, but no significant cell death was seen in the aspirated tongue.
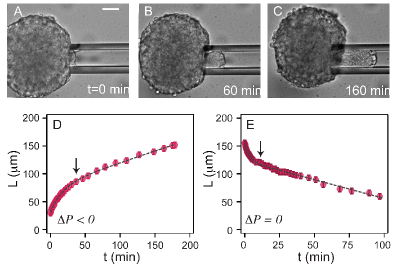
Fig.1(A)-(C) shows snapshots of the aspiration of an aggregate inside a pipette at a constant pressure. The advancement of the aggregate inside the pipette is characterized by tracking the displacement of the front of the tongue with respect to the pipette tip, represented by in Fig. 2(A). As a first approach, steps of were applied at a time interval of 2-3 hours, in order to determine the dynamics of aspiration as a function of . However, we observed a degradation of the cells when aggregates stayed under aspiration for over 6 hours, limiting the number of steps. Consequently, we modified the procedure and applied cycles of pressure as shown in Fig. 1(D)-(E). After each aspiration at constant pressure, the pressure was set to zero and the retraction of the tongue was monitored. In general, we performed one aspiration-retraction cycle on each aggregate to maintain the same initial conditions. Both aspiration and retraction curves show a fast initial deformation, followed by a slow flow with constant velocity ; the transition between the two regimes is marked by an arrow. This creep behavior is a signature of viscoelastic materials. We proceeded by considering these cell aggregates as viscoelastic liquid drops with a surface tension .
The total energy of a drop aspirated inside a non-adhesive pipette, “zero” wetting, is given by degennes:2004 , where and are the radii of the drop and the pipette respectively, and is the applied pressure, as shown schematically in Fig. 2(A). Considering volume conservation, the aspiration force is , where the critical pressure to aspirate, , relates to the surface tension through the Laplace law: . Note that is not constant, but can be approximated by for .
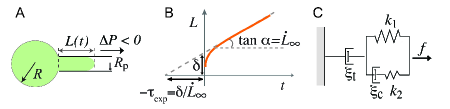
From scaling laws the aspiration force and the elastic deformation at short time, , are related by , where , is the elastic modulus, and is a geometrical factor for our experimental conditions Aoki:1997p985 , leading to . At long times, is balanced by the friction force due to the viscous flow into the orifice Dagan:1982p1007 and the slippage of the advancing tongue on the wall as: , where is the viscosity of the tissue, and is the wall-tissue friction coefficient. We define as a characteristic length associated to the wall friction. In the limit of we have , whereas for we find , where . We have estimated N.s/m2 from the advancement velocity of a completely aspirated aggregate, leading to mm (see below for ). Therefore we can ignore the wall friction. To combine the elastic and viscous regimes, we use the modified Maxwell model depicted in Fig. 2(C). The total displacement is given by:
| (1) |
where , and . The first term characterizes the elastic regime with being the raising time of the elastic deformation , and the second term characterizes the flow at constant velocity . The tissue relaxation time separating the elastic and viscous regimes is given by .
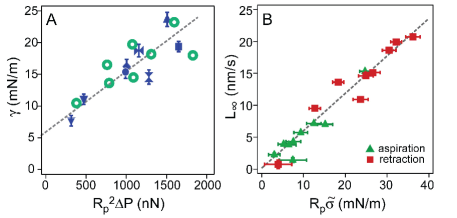
The dashed lines in Fig. 1(D)-(E) are the adjustment of Eq. 1 to the data with four fitting parameters: , , , and . The critical pressure is deduced from , where and are the aspiration and the retraction flow rates, respectively. Using the values for , the surface tension, , is derived from the Laplace law. Fig. 3(A) shows an increase in as the applied force is increased. By extrapolation, we obtain the surface tension of the aggregate at rest, mN/m, comparable to previously obtained values for similar tissue types Foty:1994p1001 ; Forgacs:1998p958 ; Mgharbel:2009p952 . We also measured directly a lower bound for by finding the maximum pressure ( Pa for m) at which the aggregate does not penetrate into the pipette, leading to mN/m. The flow velocities of aggregates during aspiration and retraction are shown in Fig. 3(B) as a function of the applied stress, , where for aspiration, and for retraction. The observed linear relationship between and shows that stays constant and no shear thinning effect is observed in the range of pressures (1-3 kPa) applied in our experiments. The slope of the fitted line gives Pa.s, comparable to the values previously reported for aggregates of mouse embryonal carcinoma F9 cell lines ( Pa.s) Mgharbel:2009p952 ; Marmottant:2009p1005 and various chicken embryonic tissues ( Pa.s) Forgacs:1998p958 ; Jakab:2008p953 . Preliminary results on aggregates of the same cell lines with less intercellular cohesion have shown a similar but much faster aspiration dynamics, indicating a smaller viscosity for these aggregates (data not shown). In our analysis we have assumed that does not relax in the time scale of our experiment when . This assumption is justified, since the slopes of the fast retraction curves stay constant as seen in Fig. 1(E).
As mentioned above, the relaxation time for a viscoelastic material to flow is . This characteristic time can experimentally be evaluated from the creep curve as (Fig. 2(B)). However, as can be seen from the curves on Fig. 1(D)-(E), the retraction of the tongue has a much faster dynamics, resulting in . This is due to increasing from (elastic regime) to (viscous regime) during the slow aspiration and not relaxing during the fast retraction. Taking these corrections into account, , leading to , and . Taking mN/m we obtain min., and min., resulting in an average value of min. We estimate an elastic modulus of Pa for these aggregates, comparable to values reported for embryonic liver tissue Forgacs:1998p958 . The elastic local cell’s relaxation time, , is one order of magnitude smaller than the tissue relaxation times. We systematically find , showing that pre-stressed tissue has a faster elastic response.
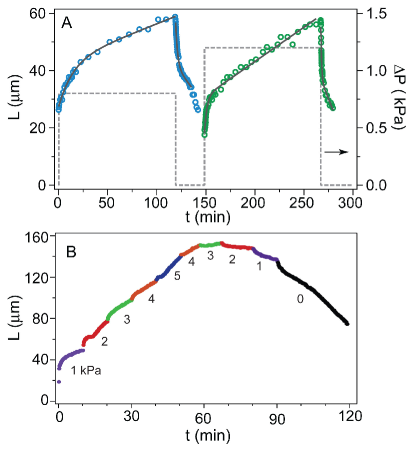
We have characterized mechanical properties of tissue such as their surface tension, viscosity and elasticity using micropipette aspiration technique. We have found that the surface tension of the aggregate is stress-dependent, suggesting that upon the application of a permanent external force, tissue cohesion is reinforced. Successive aspiration on the same aggregate validates our finding. As shown in Fig.4(A), the elastic deformation of the second aspiration in smaller, indicating a larger initial . Another direct manifestation of the reinforcement of is shown in Fig.4(B), when is decreased to a few times , the aggregate relaxes instead of flowing.
The reinforcement of is a signature of an active response of the cells to mechanical forces Cai200947 ; Janmey2004364 leading to cytoskeletal remodeling nborghi2009 , which may involve stretch-activated membrane channels Sbrana:2008p1199 , stress fiber polymerization and tensening by Myosin II motors Chaudhuri:2009p1201 ; Desprat:2005p1203 , and clustering of cadherins DelanoeAyari:2004p1200 . At the tissue level, it has also been shown that application of an external force to the tissue using a 20 m micro-needle increases the tissue tension, leading to morphogenetic movements Pouille04142009 . Protein labeling and cytoskeleton modifying drugs have to be used to better understand the reinforcement mechanism at a the cellular level. This novel method brings complementary features to the classical parallel plate compression technique, since instead of relaxing to equilibrium, the cells flowing into the pipette are continuously stretched. Moreover, this technique allows us to reach much higher stresses, up to hundred times the aggregate’s Laplace pressure.
How the surface tension and the viscoelastic properties of an aggregate depend on the properties of the subunits and on their interconnection remains an open question. Previous studies have measured the surface tension of aggregates as a function of the level of expression of intercellular binders (cadherin molecules) Foty2005255 . However, the relationship between the adhesion energy and the surface tension is still debated. We anticipate using the micropipette aspiration technique to relate the surface tension of aggregates to the cell-cell adhesion energy, which has been previously measured by one of us Chu:2004p968 .
Complete aspiration of aggregates inside a pipette can also be used to apply high pressures () to cancerous tissue and thus investigate the validity of the homeostatic pressure model, which predicts that metastatic cells can only grow if the internal pressure of the aggregate is below a critical “homeostatic pressure” Basan:2009p1006 . Combined with confocal microscopy, tissue relaxation under stress can be studied at microscopic level by probing the cellular rearrangements inside an aspirated aggregate. Compared to more conventional methods, the micropipette aspiration technique is easy to set up and can be applied to in-vivo examination of biological systems, such as living tissue or drug treated tumors, and to other complex fluids, such as viscous pastes and foams.
We would like to thank D. Cuvelier for his help with the experimental setup, C. Clanet for useful discussions, and J. Elgeti and D. Gonzalez-Rodriguez for their critical reading of the manuscript. F. B. W. and S. D. would like to thank Curie PIC program for funding. The group belongs to the CNRS consortium CellTiss.
References
- (1) R. Gordon et al., J. Theor. Biol. 37, 43 (1972)
- (2) R. A. Foty et al., Phys. Rev. Lett. 72, 2298 (1994)
- (3) R. A. Foty and M. S. Steinberg, Dev. Biol. 278, 255 (2005)
- (4) R. A. Foty et al., Development 122, 1611 (1996)
- (5) P. L. Ryan et al., Proc. Natl. Acad. Sci. USA 98, 4327 (2001)
- (6) R. A. Foty and M. S. Steinberg, Int. J. Dev. Biol. 48, 397 (2004)
- (7) K. Jakab et al., Tissue Eng. Part A 14, 413 (2008)
- (8) C. Norotte et al., Europhys. Lett. 81, 46003 (2008)
- (9) A. Mgharbel et al., HFSP Journal 3, 213 (2009)
- (10) J. Mombach et al., Physica A: Statistical Mechanics and its Applications 352, 525 (2005)
- (11) H. M. Phillips and M. S. Steinberg, Biophys. J. 64, 121 (1969)
- (12) A. Kalantarian et al., Biophys. J. 96, 1606 (2009)
- (13) M. Sato et al., J. Biomech. Eng. 112, 263 (1990)
- (14) E. Evans et al., Biophys. J. 56, 151 (1989)
- (15) T. Aoki et al., Ann. Biomed. Eng. 25, 581 (1997)
- (16) J. T. Butcher et al., Circ. Res. 100, 1503 (2007)
- (17) T. Ohashi et al., J. Biomech 38, 2248 (2005)
- (18) E. Washburn, Phys. Rev. 17, 273 (1921)
- (19) Y. S. Chu et al., Phys. Rev. Lett. 94, 028102 (2005)
- (20) L. D. Landau and E. M. Lifshitz, Course of Theoretical Physics, 3rd ed., Vol. 7: Theory of Elasticity (Elsevier Science, 1984)
- (21) Y. S. Chu et al., J. Cell Biol. 167, 1183 (2004)
- (22) P. G. de Gennes et al., Capillarity and Wetting Phenomena: Drops, Bubbles, Pearls, Waves (Springer, 2004)
- (23) Z. Dagan et al., J. Fluid Mech. 115, 505 (1982)
- (24) G. Forgacs et al., Biophys. J. 74, 2227 (1998)
- (25) P. Marmottant et al., Proc. Natl. Acad. Sci. USA 106, 17271 (2009)
- (26) K. Jakab et al., Dev. Dyn. 237, 2438 (2008)
- (27) Y. Caia et al., Curr. Opin. Cell Biol. 21, 47 (2009)
- (28) P. A. Janmey and D. A. Weitz, Trends Biochem. Sci. 29, 364 (2004)
- (29) N. Borghi and W. J. Nelson, Curr. Top. Dev. Biol. 89, 1 (2009)
- (30) F. Sbrana et al., Am. J. Physiol., Cell Physiol. 295, C160 (2008)
- (31) O. Chaudhuri et al., Nat Meth. 6, 383 (2009)
- (32) N. Desprat et al., Biophys. J. 88, 2224 (2005)
- (33) H. Delanoë-Ayari et al., Proc. Natl. Acad. Sci. USA 101, 2229 (2004)
- (34) P. A. Pouille et al., Sci. Signal. 2, ra16 (2009)
- (35) M. Basan et al., HFSP Journal 3, 265 (2009)