Dynamical Formation of Millisecond Pulsars in Globular Clusters
Abstract
The cumulative luminosity distribution functions (CLFs) of radio millisecond pulsars (MSPs) in globular clusters (GCs) and in the Galactic field at a frequency of 1.4 GHz have been examined. Assuming a functional form, where is the number of MSPs and is the luminosity at 1.4 GHz, it is found that the CLFs significantly differ with a steeper slope, , in GCs than in the Galactic field (), suggesting a different formation or evolutionary history of MSPs in these two regions of the Galaxy. To probe the production mechanism of MSPs in clusters, a search of the possible relationships between the MSP population and cluster properties was carried out. The results of an investigation of 9 GCs indicate positive correlations between the MSP population and the stellar encounter rate and metallicity. This provides additional evidence suggesting that stellar dynamical interactions are important in the formation of the MSP population in GCs.
1 INTRODUCTION
It is well known that the formation rate per unit mass of low-mass X-ray binaries (LMXBs) is orders of magnitude greater in globular clusters (GCs) than in the Galactic field (Katz 1975; Clark 1975). The high formation rate of LMXBs in GCs is attributed to the frequent dynamical interactions in the dense stellar environment. As an additional formation channel, the binaries in a GC can also be a result of a standard evolutionary path identified for MSP formation in the Galactic field. This has stimulated many theoretical and observational studies to investigate the relative contribution of these two formation processes of compact binaries in the population of GCs (e.g. Fregeau 2008; Pooley et al. 2003; Pooley & Hut 2006).
With the superior sub-arcsecond spatial resolution of the Chandra X-Ray Observatory, remarkable progress has been made in the understanding of the formation processes of close binaries in GCs. For example, Pooley et al. (2003) found a positive correlation between the number of close X-ray binaries in GCs and the stellar encounter rate, . Specifically, Pooley et al. (2003) found an approximately linear relationship between the number of LMXBs and , indicating a dependence on the properties of GCs. A similar relationship has also been reported by Gendre et al. (2003) and taken together with the results of Pooley et al. (2003) provide evidence for the dynamical origin of LMXBs in GCs.
Since millisecond pulsars (MSPs) have long been proposed as the descendants of LMXBs, they are also expected to have a dynamical origin in GCs. Due to the existence of extensive pulsar surveys, 140 MSPs have been detected in 26 different clusters and a statistical study of their relationship to cluster parameters is desirable. 111For updated statistics, please refer to http://www2.naic.edu/pfreire/GCpsr.html However, previous studies were not successful in finding evidence for the dynamical origin of MSPs in the clusters due to the lack of a relation between the pulsar population and in the GCs (e.g. Ransom 2008). This can be ascribed to the observational bias in the pulsar searches. As the distance of the GCs spans a rather wide range (cf. Harris 1996), the sensitivity of the observations can differ in the searches toward different clusters and hence induce selection effects in the observed sample (Ransom 2008). Therefore, the observed number of MSPs is not representative of an unbiased sample for the analysis.
In this paper, we present a method to alleviate the aforementioned problem and investigate the possible relationship between the number of MSPs and the cluster properties. In §2, an investigation of the cumulative luminosity distribution functions of MSPs in a number of selected GCs is carried out. We subsequently use the obtained results in a correlation analysis in §3 and discuss the physical implications of the possible correlation in §4.
2 CUMULATIVE RADIO LUMINOSITY FUNCTIONS
Among the GCs, nine contain more than three MSPs for which their radio flux densities are reported. This enables one to create the cumulative luminosity distribution functions (CLFs) of MSPs for these clusters and to estimate their logarithmic slopes by a power law fit. The physical properties of these nine selected GCs are summarized in Table 1. As the observations for an individual cluster were conducted at different frequencies, we convert all flux densities to the values at 1.4 GHz by assuming a spectral index of , which is the mean value reported by Maron et al. (2000).
We model the CLFs with a form of , where represents the number of MSPs with the pseudo radio luminosity 1 mJy kpc2 at 1.4 GHz. Since no obvious turn-off is observed from the distribution of individual cluster, we have taken the entire sample into account. Following Hessels et al. (2007), we adopt the square root of as the uncertainties in the analysis and fit versus with a linear regression analysis that take the uncertainties into account. The best-fit parameters are tabulated in Table 2. It can be seen that the best-fit values of lie in a range to with the steepest slope inferred for the MSPs in M 3. In this analysis, we have also taken the uncertainties associated with the cluster distance determination into account. In reviewing different methods in determining the distances to GCs, it has been concluded that these various methods imply an uncertainty of in the cluster distance (Krauss & Chaboyer 2003; Chaboyer 2008). Adopting the uncertainty of distance in constructing the CLFs, this results in an additional error in the normalization beyond the statistical error from the fits.222We adopted confidence intervals in all the reported analysis. Both errors are combined in quadrature which are quoted in Table 2 and adopted in subsequent analysis in §3.
By using the best-fit CLFs for extrapolation, we estimate the number of MSPs in each cluster with mJy kpc2. Almost all the MSPs in GCs considered in this study have their radio luminosities above this threshold level. Since the errors of both and are considered in the extrapolation, the uncertainties of these estimates are larger than that of . These population estimates are also given in Table 2. For those clusters which have been searched deep enough that the sensitivity is close to this threshold, e.g., 47 Tuc, the population estimates based on the CLFs are close to the observed number of uncovered MSPs. On the other hand, for those clusters where pulsation searches have not yet reached this sensitivity level, our results provide predictions for their MSP populations when searches towards these clusters become sufficiently deep.
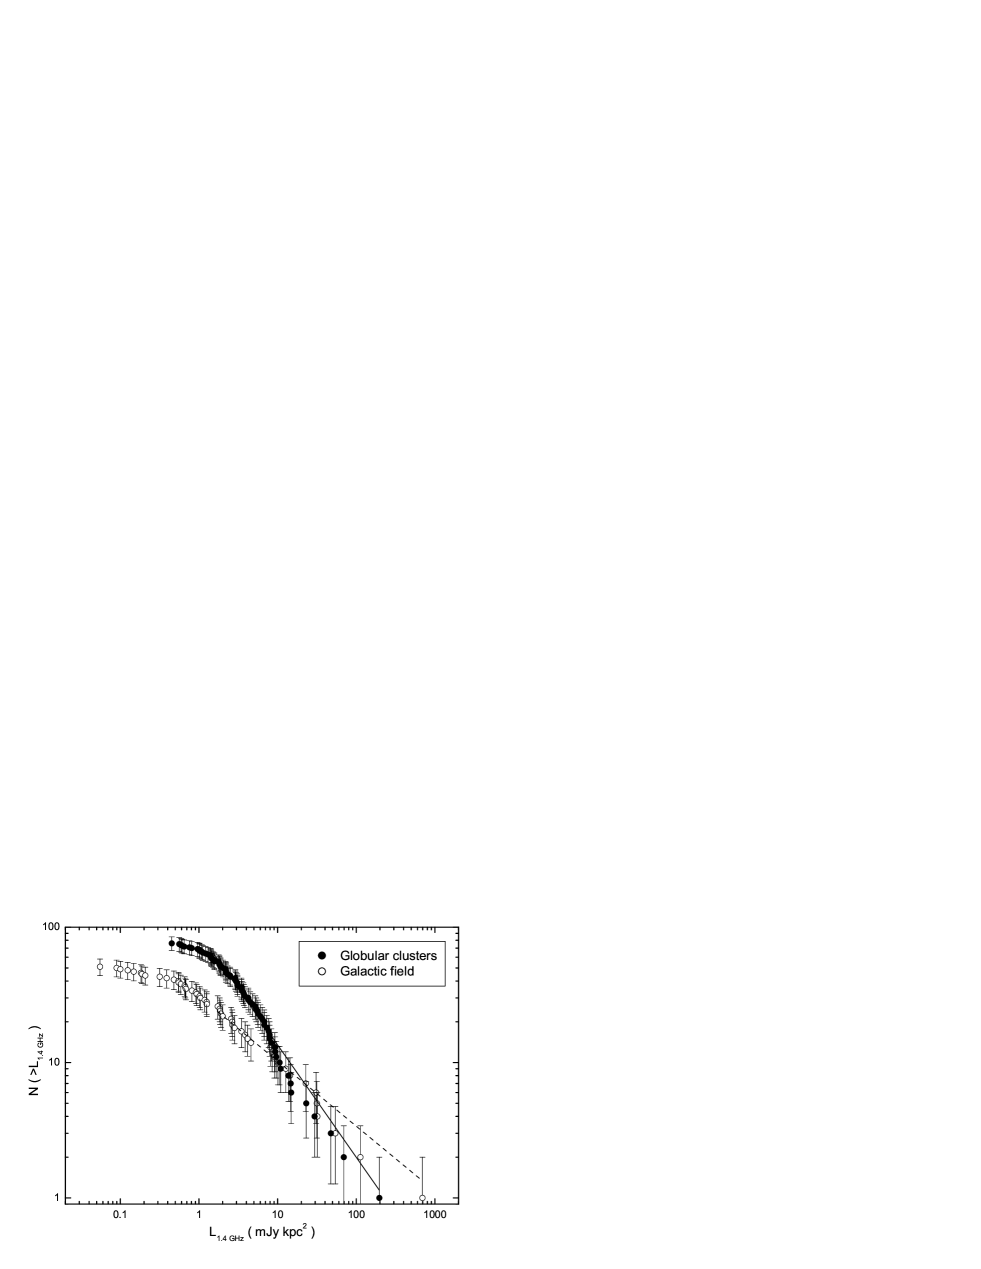
Apart from estimating the CLFs for these individual GCs, we have also constructed the luminosity function by combining all the cluster MSPs (i.e. 76 pulsars in total) used in this study. The combined CLFs of the selected cluster MSP population are displayed in Figure 1. In the combined distribution, we have observed there is a turn-off for the pseudo-luminosities smaller than mJy kpc2. Hessels et al. (2007) have also observed the same behaviour in an independent analysis. In order to compare our result with Hessels et al. (2007), we followed their procedure and used a minimum luminosity cut-off of mJy kpc2 for the fitting procedure. The results of this analysis are summarized in Table 3. The logarithmic slope inferred from this collective sample is , which is consistent with the value deduced by Hessels et al. (2007) (i.e. ) within error.
Hessels et al. (2007) have further compared the luminosity distribution of the MSP population in GCs with those of other pulsar populations. They suggested that the distribution of cluster MSPs is marginally consistent with that of the MSPs in the Galactic field reported by Corde & Chernoff (1997) and Lyne et al. (1998). However, the samples adopted in these investigations contain not more than 22 pulsars. This relative small sample size may introduce bias in the analysis and inference. Thanks to the extensive pulsar searches in the recent years, the whole pulsar population has been significantly increased. Hessels et al. (2007) have also compared their results with a more updated pulsar sample reported by Lorimer et al. (2006) which used 1008 pulsars in their study. Lorimer et al. (2006) have found a distribution of for their sample, which is very similar to that inferred from the cluster population as reported by Hessels et al. (2007) and this paper. Nevertheless, the sample used by Lorimer et al. (2006) consist of non-recycled canonical pulsars. It is more instructive to compare the CLF of the cluster MSP population and the MSPs in the Galactic field, both of which have undergone the recycling processes in binary systems. Therefore, we construct the luminosity function for the MSP population in the Galactic field with all the available data in the ATNF catalog (Manchester et al. 2005).
To do this, we specifically selected all pulsars in the Galactic field with 20 ms. In total, there are 51 MSPs with flux densities reported in the catalog, which enable us to construct the CLF. For comparison, the CLF of the Galactic population is over-plotted along with the cluster population in Figure 1. To be consistent with the analysis of the cluster population, we used a minimum luminosity cut-off of mJy kpc2 in the fitting. The inferred slope of the Galactic population is , which is found to be flatter than the value deduced from the cluster population.
To further investigate the difference between two populations, we separate each population into two sub-samples, namely the binary and the solitary MSPs. The results are summarized in Table 3. 333For PSRs J1342+2822A and J1342+2822C located in M 3, it is still uncertain whether they are binary or solitary and therefore they are omitted in the analysis of separate populations. By studying these sub-populations in GCs separately, we deduce the slopes to be and for the binary and the solitary MSPs respectively. These values are consistent with those inferred by the Hessel et al. (2007) within uncertainties. In the Galactic field, we also examine the luminosity functions separately for the binary and solitary MSPs. The slopes inferred for the binary and solitary populations are and respectively, which are rather different from those inferred from the cluster population. For completeness, we have also repeated the above analysis with all the MSPs (i.e., without excluding those with their pseudo-luminosities smaller than 1.5 mJy kpc2). The results are also tabulated in Table 3 for the sake of comparison.
3 CORRELATION ANALYSIS
We have attempted to search for correlations between the observed number of MSPs in each GC with cluster parameters. As the most promising correlation is expected with the two-body encounter rate, we begin our analysis with this parameter. The two-body encounter rate in a cluster can be estimated as , where is the central luminosity density, is the core radius and is the velocity dispersion at the cluster center. In adopting the central luminosity density as an estimate of the stellar density at the center, there is an underlying assumption that the average luminosities of the stars in the cluster centers are approximately equal to . Figure 2 shows the relation between the observed populations with . However, no obvious correlations can be identified with this observed sample. These two quantities are correlated at a confidence level of only. This conclusion is similar to that reported by Ransom (2008). Owing to the limited amount of telescope time, many clusters that host only a single pulsar have not been searched to the same sensitivity level as those of the specifically selected targets, such as 47 Tuc. Therefore, the selection effect biases the observed numbers of MSPs in different clusters.
In order to alleviate this problem, we suggest that the use of the CLFs of the investigated clusters. With the best-fits of the CLFs (see §2), we are able to estimate the number of MSP in these GCs above a given luminosity threshold and thus obtain an unbiased sample. Specifically, we take the best-fit values of in these GCs to estimate the numbers of the MSPs in these clusters with their pseudo-luminosities above mJy kpc2 and examine whether it is related to different physical quantities of the clusters. In this analysis, the possible correlation between with two-body encounter rate , metallicity [Fe/H], cluster mass , velocity dispersion and escape velocity at the cluster center are explored. All these quantities are speculated to have influence on the binary formation and hence the MSP population in a cluster.
While the two-body encounter rate is related to the binary population resulting from dynamical interactions, the metallicity [Fe/H] of a cluster can have a profound influence on the evolution of LMXBs (see Ivanova 2006 and the discussion in §4). On the other hand, if stellar encounters were not the major channel of the binary formation, one would expect the binary population to be correlated with the cluster mass . Assuming a constant mass-to-light ratio, can be estimated from the absolute visual magnitude : . We have also tested the correlation with and which may possibly be related to the retention of the neutron stars in a cluster.
Without a priori knowledge of the distributions of the tested quantities, a nonparametric correlation analysis is adopted. The computed Spearman rank correlation coefficients between and the various quantities are tabulated in Table 4. Among all the tested quantities, the strongest correlation is found between and . The corresponding Spearman correlation is 0.78 with a chance correlation probability of 0.0125. The plot of is displayed in Fig. 3a. The correlation between and [Fe/H] with a Spearman correlation=0.72 has also been found to be significant with a chance correlation probability=0.0298, which is plotted in Figure 3b. By taking the errors of as the weight in the linear regression analysis, the logarithmic slopes of the and [Fe/H] relations are found to be and respectively. For the other tested quantities, there are marginal correlations of versus and at a confidence level , though it is not sufficiently significant to secure the relations. It is not surprising to note that the rank correlation coefficients are the same for these two quantities, as Gnedin et al. (2002) have found that the ratio of to has a narrow range between . Among all the tested quantities, the weakest correlation is found for the relation which has a chance correlation probability over .
As this choice of luminosity threshold is arbitrary, we further check the robustness of the correlation analysis results by repeating the investigation with different thresholds. We have repeated the analysis by adopting in Table 2, which provide the estimates for the number of MSPs with mJy kpc2. Almost all the MSPs in GCs considered in this investigation have their radio luminosities above this threshold. With these new values, the correlations of the MSP number versus , [Fe/H], , and (or ) are found at the confidence levels of , , and respectively.
For a further test of the robustness, by using the best-fit CLFs in Table 2, we have also repeated the analysis for a minimum luminosity cut-off of mJy kpc2. In this case, the correlations with , [Fe/H], , and (or ) are confident at the levels of , , and respectively. Therefore, the degrees of correlation for the tested quantities are found to be insensitive to the choice of the threshold. We conclude that the correlation between and the MSP number is the most robust among all the tested quanities, which have a confidence level regardless of the chosen threshold.
4 SUMMARY & DISCUSSION
The CLFs of nine GCs, each containing a population of MSPs has been examined. Upon comparison of the MSP population in GCs with that in the Galactic field, it has been found that the slopes of the CLFs inferred in these two populations significantly differ. It is natural to speculate that the CLF is somehow related to the magnetic field and spin of the MSPs. Wang, Jiang & Cheng (2005) have compared the distributions of the spin period and the dipolar surface magnetic field for both cluster and disk populations (cf. Fig. 2 and Fig. 3 in their paper). Despite the broader distribution for the disk population, their mean values are not dissimilar in both populations and therefore cannot solely explain the difference of CLFs.
Apart from the radio luminosity functions, the X-ray emission properties of the MSPs in the GCs are also found to be very different from those in the Galactic field. While the MSPs in the Galactic field generally require a hot polar cap component plus a non-thermal power-law tail to model their X-ray spectra (cf. Zavlin 2006), the X-rays from a majority of the MSPs in GCs are purely thermal in nature (see Hui et al. 2009 and the references therein for a recent review). Cheng & Taam (2003) suggest the absence of non-thermal X-ray from the cluster MSPs can be possibly related to the complicated magnetic field structure. Since the stellar interaction in GCs is much more frequent than that in the Galactic field, MSPs in the GCs can possibly change their companion several times throughout their lives. Since the orientation of the binary after each exchange can differ, the direction of the angular momentum accreted during the mass transfer phase subsequent to each exchange can vary possibly affecting the magnetic field configuration at the neutron star surface. Such an evolution could lead to a much more complicated magnetic field structure for the MSPs in the GCs than in the case in the Galactic field. In such a complicated magnetic field, Ruderman & Cheng (1988) have argued that high energy curvature photons will be emitted and subsequently converted into pairs to quench the accelerating region. This provides an explanation for the absence of non-thermal emission in the cluster MSPs. For the same reason, the complicated magnetic field structure can also possibly alter the coherent radio emission and result in a different radio luminosity of the cluster MSPs in comparison with the disk population.
Adopting the best-fit normalization inferred from the CLFs of individual cluster as an unbiased estimate of the number of MSPs, we have further examined the relationships between the pulsar population and the physical properties in GCs. We have found the positive correlations of versus as well as versus [Fe/H] at a relatively high confidence level. A marginal positive correlation between and is also suggested. Although a high escape speed implies the presence of a deeper gravitational potential well and hence a higher neutron star retention, this correlation is not sufficiently significant to warrant such an interpretation. Hence, we do not discuss this relation any further and focus on the physical implications of the and [Fe/H] relations.
Due to the different selection effects in the pulsar search surveys, it is not feasible to directly use the detected MSP populations in GCs for a statistical analysis. Instead, we alleviate the problem by taking as the estimator for the number of pulsars with pseudo radio luminosites at 1.4 GHz larger than 1 mJy kpc2. With this consideration, we have found a correlation between and at a confidence level . We have further found that the strength of this correlation is robust and independent of the choice of the luminosity cut-off by repeating the analysis with different thresholds. This provides evidence for the dynamical formation of MSPs in GCs. For a competing scenario that the MSPs have a binary origin similar to the Galactic field, one should expect the number of MSPs to scale with the cluster mass, , instead of . However, we do not find any convincing relationship between and (see Table 4). The absence of correlation with provides additional support for the dynamical formation scenario. Taken together with the difference in the X-ray luminosity functions of LMXBs in the field and in globular clusters (see Voss et al. 2009; Kim et al. 2009), it is likely that the MSPs have different origins/evolutions in globular clusters relative to the Galactic field.
We note that the logarithmic slope of the power-law fit in the relationship (i.e. ) is not dissimilar to that of the number of X-ray sources versus ( Pooley et al. 2003). This dependence on the two-body encounter rate suggests a possible relationship between the MSP population and close X-ray binaries in GCs. Apart from the whole X-ray binary population, Pooley et al. (2003) and Gendre et al. (2003) have also examined the relationship for the individual class of LMXBs which has a logarithmic slope of . Although the large uncertainty of this slope resulting from the limited sample of LMXBs precludes a definitive conclusion concerning the link between LMXBs and MSPs, it is consistent with such an interpretation.
Theoretical arguments (Verbunt & Hut 1987) suggest that the number of LMXBs is linearly proportional to the stellar encounter rate of the cluster, however direct comparison of their relationship with the current two-body encounter rate may be misleading. As the MSPs are long lived and are produced by the previous generations of LMXBs, they can have a different formation rate from the LMXB population currently observed. This point is important since the relaxation time at the cluster core is generally longer than the lifetime of LMXBs (cf. Harris 1996). Therefore, the continuous mass segregation at the cluster center can result in a evolution of the stellar collision frequency and hence a varying formation rate of compact binary systems. Nevertheless, the combination of X-ray and HST observations of Cen A (see Jordán et al. 2007) indicate that globular clusters with LMXBs are characterized by higher stellar encounter rates than those devoid of LMXBs.
In addition to the relation, we have also found a positive correlation between and the metallicity of the GCs. It has been noted that observational evidence suggests that bright LMXBs are preferably formed in metal-rich clusters in our Milky Way as well as other galaxies (e.g Bellazzini et al. 1995; Maccarone et al. 2004; Jordán et al. 2004). Ivanova (2006) proposes that the absence of the outer convective zone in metal-poor main sequence donor stars in the mass range of - , in comparison to their metal rich counterparts can be responsible, since the absence of magnetic braking in such stars precludes orbital shrinkage, thereby, significantly reducing the binary parameter space for the production of bright LMXBs. For the conventional scenario that LMXBs are the progenitors of MSPs, the positive correlation between and [Fe/H] is not unexpected since the MSP number should scale with that of their progenitors.
While the stellar encounter rate has been widely accepted as a parameter to indicate which clusters are likely to host a large MSP population, our study suggests that the metallicity can also be an important parameter. To explore this hypothesis, we suggest that pulsar searches be carried out toward metal-rich GCs, such as Liller 1 which has the highest metallicity ([Fe/H]=0.22) among all 150 GCs in the Milky Way (cf. Harris 1996). Furthermore, its two-body encounter rate is estimated to be comparable with that of 47 Tuc. Therefore, according to these parameters, it is very likely to host a considerable number of MSPs. With a dedicated search, this hidden population may be revealed.
References
- (1) Bellazzini, M., Pasquali, A., Federici, L., Ferraro, F. R., & Pecci, F. F. 1995, ApJ, 439, 687
- (2) Bégin, S. 2006, Ph.D. thesis, University of British Columbia
- (3) Camilo, F., Lorimer, D. R., Freire, P., Lyne, A. G., & Manchester, R. N. 2000, ApJ, 535, 975
- (4) Chaboyer, B. 2008, A Giant Step: from Milli- to Micro-arcsecond Astrometry, Proceedings of the International Astronomical Union, IAU Symposium, Volume 248, p. 440-442
- (5) Cheng, K. S., & Taam, R. E., 2003, ApJ, 598, 1207
- (6) Clark, G. W. 1975, ApJ, 199, L143
- (7) Cordes, J. M., & Chernoff, D. F. 1997, ApJ, 482, 971
- (8) D’Amico, N. et al. 2002, ApJ, 570, L89
- (9) Fregeau, J. M. 2008, ApJ, 673, L25
- (10) Freire, P. C. C., Ransom, S. M., Bégin, S., Stairs, I. H., Hessels, J. W. T., Frey, L. H., & Camilo, F. 2008, ApJ, 675, 670
- (11) Gendre, B., Barret, D., & Webb, N. 2003, A&A, 403, L11
- (12) Gnedin, O. Y., Zhao, H. S., Pringle, J. E., Fall, S. M., Livio, M., & Meylan, G. 2002, ApJ, 568, L23
- (13) Harris, W.E. 1996, AJ, 112, 1487 (2003 version)
- (14) Hessels, J. W. T., Ransom, S. M., Stairs, I. H., Kaspi, V. M., & Freire, P. C. C. 2007, ApJ, 670, 363
- (15) Hui, C. Y., Huang, H. H., Cheng, K. S., Taam, R. E., & Becker, W. 2009, ASPC, 404, 149
- (16) Ivanova, N. 2006, ApJ, 636, 979
- (17) Jordán, A., et al. 2004, ApJ, 613, 279
- (18) Jordán, A., et al. 2007, ApJ, 671, L117
- (19) Katz, J. I. 1975, Nature, 253, 698
- (20) Kim, D. W. et al. 2009, ApJ, 703, 829
- (21) Krauss, L. M. & Chaboyer, B. 2003, Science, 299, 65
- (22) Lorimer, D. R., et al. 2006, MNRAS, 372, 777
- (23) Lyne, A. G., et al. 1998, MNRAS, 295, 743
- (24) Maccarone, T. J., Kundu, A., & Zepf, S. E. 2004, ApJ, 606, 430
- (25) Manchester, R. N., Hobbs, G. B., Teoh, A., & Hobbs, M. 2005, AJ, 129, 1993 (for recent update, please refer to http://www.atnf.csiro.au/research/pulsar/psrcat)
- (26) Maron, O., Kijak, J., Kramer, M., & Wielebinski, R. 2000, A&AS, 147, 195
- (27) Pooley, D., & Hut, P. 2006, ApJ, 646, L143
- (28) Pooley, D., et al. 2003, ApJ, 591, L131
- (29) Ransom, S. M. 2008, 40 years of pulsars, Millisecond Pulsars, Magnetars and More. AIP Conference Proceedings, Volume 983, pp. 415-423
- (30) Ransom, S. M. et al. 2005, Science, 307, 892
- (31) Ruderman, M., & Cheng, K. S. 1988, ApJ, 335, 306
- (32) Verbunt, F. & Hut, P. 1987, in The Origin and Evolution of Neutron Stars, ed. D. J. Helfand & J.-H. Huang (Dordrecht: Reidel), 187
- (33) Voss, R. et al. 2009, ApJ, 701, 471
- (34) Wang, W., Jiang, Z. J., & Cheng, K. S. 2005, MNRAS, 358, 263
- (35) Zavlin, V. E. 2006, ApJ, 638, 951
| Cluster Name | aaLogarithm of central luminosity density | distance | core radius | [Fe/H]bbMetallicity | ccAbsolute visual magnitude | ddD velocity dispersion at the cluster center | eeD escape velocity at the cluster center | ffTwo-body encounter rate estimated by with the value scaled with that in M4 which has pc-3, pc and km/s |
|---|---|---|---|---|---|---|---|---|
| pc-3 | kpc | pc | km/s | km/s | ||||
| Terzan 5 | 5.06 | 10.3 | 0.54 | 0.00 | -7.87 | 12.7 | 50.5 | 223.8 |
| 47 Tuc | 4.81 | 4.5 | 0.52 | -0.76 | -9.42 | 16.4 | 68.8 | 49.0 |
| M 28 | 4.73 | 5.6 | 0.39 | -1.45 | -8.18 | 16.3 | 63.8 | 14.4 |
| NGC 6440 | 5.28 | 8.4 | 0.32 | -0.34 | -8.75 | 21.6 | 85.2 | 75.4 |
| NGC 6752 | 4.91 | 4.0 | 0.20 | -1.56 | -7.73 | 7.1 | 32.9 | 10.2 |
| M 5 | 3.91 | 7.5 | 0.92 | -1.27 | -8.81 | 11.8 | 47.7 | 6.0 |
| M 13 | 3.33 | 7.7 | 1.75 | -1.54 | -8.70 | 10.3 | 39.1 | 3.3 |
| M 3 | 3.51 | 10.4 | 1.66 | -1.57 | -8.93 | 9.2 | 37.2 | 7.1 |
| NGC 6441 | 5.25 | 11.7 | 0.37 | -0.53 | -9.64 | 25.2 | 102.0 | 87.1 |
.
| Cluster Name | aaEstimated number of MSPs with their pseudo-luminosities larger than mJy kpc2 by using the CLFs. | bbThe observed number of uncovered MSPs. | Reference | ||
|---|---|---|---|---|---|
| Terzan 5 | 33 | 1 | |||
| 47 Tuc | 23 | 2 | |||
| M 28 | 12 | 3 | |||
| NGC 6440 | 6 | 4 | |||
| NGC 6752 | 5 | 5 | |||
| M 5 | 5 | 6 | |||
| M 13 | 5 | 6 | |||
| M 3 | 4 | 6 | |||
| NGC 6441 | 4 | 7 |
References: (1) Ransom et al. 2005; (2) Camilo et al. 2000; (3) Bégin 2006; (4) Freire et al. 2008; (5) D’Amico et al. 2002; (6) Hessels et al. 2007; (7) Freire et al. 2008
| Sample | Sample sizeaaThe entries in these columns depend on whether the analysis has taken: only MSPs with their pseudo-luminosoties greater than 1.5 mJy kpc2 / all MSPs with their flux estimates available. | aaThe entries in these columns depend on whether the analysis has taken: only MSPs with their pseudo-luminosoties greater than 1.5 mJy kpc2 / all MSPs with their flux estimates available. | aaThe entries in these columns depend on whether the analysis has taken: only MSPs with their pseudo-luminosoties greater than 1.5 mJy kpc2 / all MSPs with their flux estimates available. |
|---|---|---|---|
| MSP population in globular clusters | |||
| Total (/All) | 58 / 76 | / | / |
| Binary (/All) | 32 / 41 | / | / |
| Isolate (/All) | 26 / 33 | / | / |
| MSP population in Galactic field | |||
| Total (/All) | 40 / 51 | / | / |
| Binary (/All) | 34 / 39 | / | / |
| Isolate (/All) | 6 / 12 | / | / |
| Parameters | Spearman rank correlation coefficient | ProbabilityaaThe probability that the correlation coefficient is different from zero. |
|---|---|---|
| With | ||
| 0.7833 | 0.9875 | |
| 0.7167 | 0.9702 | |
| -0.2000 | 0.3941 | |
| 0.5667 | 0.8884 | |
| 0.5667 | 0.8884 | |
| With | ||
| 0.8333 | 0.9947 | |
| 0.6167 | 0.9231 | |
| -0.1333 | 0.2676 | |
| 0.5167 | 0.8456 | |
| 0.5167 | 0.8456 | |
| With | ||
| 0.7628 | 0.9832 | |
| 0.7798 | 0.9868 | |
| -0.2034 | 0.4003 | |
| 0.6272 | 0.9294 | |
| 0.6272 | 0.9294 | |