Dynamic star formation in the massive DR21 filament
Abstract
Context. The formation of massive stars is a highly complex process in which it is unclear whether the star-forming gas is in global gravitational collapse or an equilibrium state supported by turbulence and/or magnetic fields.
Aims. By studying one of the most massive and dense star-forming regions in the Galaxy at a distance of less than 3 kpc, i.e. the filament containing the well-known sources DR21 and DR21(OH), we attempt to obtain observational evidence to help us to discriminate between these two views.
Methods. We use molecular line data from our 13CO 10, CS 21, and N2H+ 10 survey of the Cygnus X region obtained with the FCRAO and CO, CS, HCO+, N2H+, and H2CO data obtained with the IRAM 30m telescope.
Results. We observe a complex velocity field and velocity dispersion in the DR21 filament in which regions of the highest column-density, i.e., dense cores, have a lower velocity dispersion than the surrounding gas and velocity gradients that are not (only) due to rotation. Infall signatures in optically thick line profiles of HCO+ and 12CO are observed along and across the whole DR21 filament. By modelling the observed spectra, we obtain a typical infall speed of 0.6 km s-1 and mass accretion rates of the order of a few 10-3 M⊙ yr-1 for the two main clumps constituting the filament. These massive clumps (4900 and 3300 M⊙ at densities of around 105 cm-3 within 1 pc diameter) are both gravitationally contracting. The more massive of the clumps, DR21(OH), is connected to a sub-filament, apparently ’falling’ onto the clump. This filament runs parallel to the magnetic field.
Conclusions. All observed kinematic features in the DR21 filament (velocity field, velocity dispersion, and infall), its filamentary morphology, and the existence of (a) sub-filament(s) can be explained if the DR21 filament was formed by the convergence of flows on large scales and is now in a state of global gravitational collapse. Whether this convergence of flows originated from self-gravity on larger scales or from other processes cannot be determined by the present study. The observed velocity field and velocity dispersion are consistent with results from (magneto)-hydrodynamic simulations where the cores lie at the stagnation points of convergent turbulent flows.
Key Words.:
interstellar medium: clouds – individual objects: Cygnus X – molecules – kinematics and dynamics – Radio lines: ISM1 Introduction
Our goal in this series of papers is to investigate the generic link between the large-scale (several 10 pc) molecular-cloud spatial structure (Schneider et al. 2010), medium-scale (10 pc) dynamic fragment properties (this paper), and the occurrence of high-mass star formation on small (0.1-0.5 pc) scales (Bontemps et al. bontemps2010 (2010), Csengeri et al. csengeri2010 (2010)). To achieve this, we make use of our multiwavelength study in Cygnus X (see below). This region has already been shown to represent an excellent laboratory for studies of high-mass star formation.
Molecular clouds (MCs) are the birthplaces of low- and high-mass stars. Understanding their formation and evolution is essential to understanding in general the star formation (SF) process. There are currently two different scenarios for the evolution of MCs and stars, a dynamic and a quasi-static view.
In the dynamic context, MCs are transient, rapidly evolving entities that are not in equilibrium, and the spatial and velocity structure of the cloud is determined by compressible supersonic turbulence (see e.g., Mac Low & Klessen maclow2004 (2004) for an overview). The driving sources of turbulence can be diverse and their relative importance remains a subject of debate. Large-scale mechanisms such as supernovae explosions, should be the most importantXS, based on theoretical arguments extensively discussed by MacLow & Klessen (maclow2004 (2004)).
Turbulence may also occur during the formation process of molecular clouds (Vazquez-Semandeni et al. vaz2002 (2002), Klessen & Hennebelle klessen2010 (2010)) within large-scale colliding flows of mostly atomic gas in the galactic disk, generated by dynamic compression in the interstellar medium or other large-scale instabilities (see, e.g., Hennebelle & Audit hennebelle2007 (2007), Vazquez-Semadeni et al. vaz2008 (2008), Hennebelle et al. hennebelle2008a (2008), Banerjee et al. banerjee2009 (2009)). High velocity compressive flows form dense structures at stagnation points that may collapse to form stars/clusters (Ballesteros-Paredes et al. ball2003 (2003), Vazquez-Semadeni et al. vaz2007 (2007), vaz2009 (2009), Heitsch et al. heitsch2008 (2008)). In this case, the velocity field and velocity dispersion of molecular clumps may contain the signature of the external convergent motion and the compressive, gravitational contraction (this was already proposed by Goldreich & Kwan goldreich1974 (1974)). The star-forming core is then the dense post-shock region with a more quiescent velocity dispersion than the turbulent flow (Klessen et al. klessen2005 (2005)). This scenario is valid for both, low- and high-mass star formation. However, there is no direct observational confirmation of the existence of convergent flows. Studying the dynamics of HI and molecular gas may be a possibility (Brunt brunt2003 (2003)), though it is not clear what observational signatures are to be expected. An indirect argument for molecular cloud formation out of colliding HI flows was provided by Audit & Hennebelle (audit2009 (2009)), who showed that their models closely reproduce the observed clump mass spectra and Larson-relations. It has also been noted that the lifetime of the cloud in the gravoturbulent framework is short (one dynamical crossing time, i.e. 107 yr for giant molecular clouds) and the star formation process is rapid.
In the quasi-static view (see McKee & Ostriker mckeeostriker2007 (2007) and references therein), MCs are formed by large-scale self-gravitating instabilities such as spiral density waves. (High-mass) star formation is approached in the ’turbulent core’ model (McKee & Tan mckee2003 (2003)) in which the star-forming cores are supersonically turbulent. Turbulent magnetic and thermal pressure supports the clump against self-gravity. Because of energy injection from newly formed stars, the clumps and most of the cores may maintain their equilibrium, unless they quasistatically evolve to a gravitationally unstable state to finally form stars (if the magnetic flux diffuses out of the clump by ambipolar diffusion). In the case of low-mass stars, the collapse of a rotating cloud of gas and dust leads to the formation of an accretion disk through which matter is channeled onto a central protostar. For stars with masses higher than about 8 M⊙ this mechanism of star formation is less clear due to the strong radiation field that pushes against infalling material and may halt accretion. However, theoretical work (Yorke & Sonnhalter yorke2002 (2002); Krumholz, McKee, Klein krumholz2005 (2005); Peters et al. peters2010 (2010)) has shown that outflows lead to anisotropy in the stellar radiation field, which reduce the radiation effects experienced by gas in the infalling envelope. Thus, massive stars may therefore be able to form by a mechanism similar to that by which low mass stars form. Peters et al. (peters2010 (2010)) even show that clustered SF is a natural outcome of massive SF even in the presence of radiative feedback. However, clustered SF is also a natural result of the competitive accretion scenario (Bonnell & Bate bonnell2006 (2006)), in which the fragmentation of a turbulent cloud produces stars with masses of the order of the Jeans mass within a common gravitational potential. These stars, located close to the centre of the potential, accrete at much higher rates than isolated stars and become massive.
Both scenarios have in common that massive (10 M⊙) stars form only from the coldest, and densest, cores (size scale 0.1 pc) of molecular clouds and that high infall/accretion rates are required to overcome feedback processes (ionizing radiation, jets, outflows). In the dynamic framework, stars form as the dynamical evolution of the MC progresses with gas continuously being accreted. Individual clumps (0.1–0.5 pc) fragment into hundreds of protostars, possibly competing for mass in the central regions of the cluster (Bonnell & Bate bonnell2006 (2006)). Support from magnetic fields (Hennebelle & Teyssier hennebelle2008b (2008)) and/or radiation (Krumholz krumholz2006 (2006), Bate bate2009 (2009)) could drastically limit the level of fragmentation and channel the global infall to fewer, more massive protostars (Bontemps et al. bontemps2010 (2010)).
From the observational point of view, indications of global collapse have been detected using molecular lines. Spectral profiles of high density tracers, usually combining at least an optically thin and an optically thick line, are good probes of infalling gas (e.g. Myers et al. myers1996 (1996)). Observations in low-mass star-forming regions (e.g. Lee et al. lee2003 (2003)) contain a mixture of infall (blue-shifted emission and/or redshifted self-absorption in the optically thick line) and outflow asymmetry. This sort of line profile was also found in the high-mass star-forming region W43 (Motte et al. motte2003 (2003)). Peretto et al. (peretto2006 (2006)) proposed that a peculiar velocity discontinuity could be the result of some large-scale motion, originating from self-gravity (Peretto et al. peretto2007 (2007)). The theory of turbulent core formation, on the other hand, predicts the existence of massive pre-stellar cores that have not been detected so far, not even in sensitive and extensive dust continuum studies (e.g. Motte et al. motte2007 (2007)).
In this paper, we shortly introduce the Cygnus X region and the DR21 filament in Sect. 2 and describe the molecular line oberservations in Sect. 3 and show maps and spectra in Sect. 4. Section 5 presents an analysis of the kinematic structure and the physical properties of the DR21 filament and in Sect. 6 we use our findings to test the conditions of the different high-mass star formation and turbulence models. Section 7 summarizes the paper.
| HPBW | Tsys | |||||
| [GHz] | [K] | [km s-1] | [K] | |||
| FCRAO | ||||||
| 13CO 10 | 110.2 | 45′′ | 0.48 | 210 | 0.067 | 0.48 |
| CS 21 | 98.0 | 48′′ | 0.48 | 200 | 0.075 | 0.38 |
| N2H+ 10 | 93.2 | 48′′ | 0.48 | 200 | 0.079 | 0.38 |
| IRAM | ||||||
| 12CO 21 | 230.8 | 11′′ | 0.52 | 601 | 0.05 | 0.8 |
| H2CO 3(1,2)-2(1,1) | 225.7 | 11′′ | 0.55 | 549 | 0.05 | 0.65 |
| 13CO 21 | 220.4 | 11′′ | 0.57 | 580 | 0.03 | 0.9 |
| C34S 21 | 96.4 | 26′′ | 0.77 | 210 | 0.025 | 0.5 |
| N2H+ 10 | 93.2 | 26′′ | 0.77 | 158 | 0.03 | 0.1 |
| HCO+ 10 | 89.2 | 28′′ | 0.77 | 138 | 0.05 | 0.2 |
| H13CO+ 10 | 86.8 | 29′′ | 0.78 | 114 | 0.025 | 0.25 |
2 Cygnus X
The Cygnus X region
Cygnus X is one of the richest star-formation regions in the Galaxy,
covering an area of about 30 square degrees in the Galactic plane
around Galactic longitude 80∘ (Reipurth & Schneider
reipurth2008 (2008)). It contains a prominent OB-association, Cyg OB2,
with 100 O-stars and a total stellar mass of up to 105
M⊙ (Knödlseder knoedl2000 (2000)). From large-scale
13CO 21 (KOSMA111Cologne Observatory for
Submm-Astronomy, Schneider et al. schneider2006 (2006)) and 13CO
10 (FCRAO222Five College Radio Astronomy Observatory,
Schneider et al. schneider2007 (2007), Simon et al., in prep.)
surveys, we obtained a mass of a few 106 M⊙ for the whole
molecular cloud complex that is divided into two parts – Cygnus North
and South. These studies also showed that the majority of molecular
clouds is located at a common distance of about 1.7 kpc, i.e. the
distance of Cyg OB2.
Its proximity makes Cygnus X one of the rare laboratories where
different phases of massive star formation can be studied in detail.
More than 800 distinct HII regions, a number of Wolf-Rayet stars,
several OB associations, and at least one star of spectral type O4If
are known in Cygnus X, reflecting its record of high-mass star
formation in the past. Ongoing massive star formation is revealed by
wide-field (3 deg2) 1.2 mm continuum imaging of the densest regions
in the Cygnus X molecular clouds (Motte et al. motte2007 (2007)). More
than 100 protostellar dense-cores were detected of which 40 are
likely to be the precursors of massive OB stars. High-angular
resolution observations with the Plateau de Bure Interferometer
(Bontemps et al. bontemps2010 (2010)) have indeed confirmed that the
most massive dense cores of this sample are the sites of massive star
formation, mainly in the form of clusters.
The DR21 filament
From our 1.2 mm continuum imaging and the 13CO surveys, we
concluded that the molecular ridge containing DR21 and DR21(OH)
(Dickel, Dickel & Wilson dickeldickel1978 (1978), Wilson &
Mauersberger wilson1990 (1990), Jakob et al. jakob2007 (2007)) is the
most active, dense (average density104 cm-3), and
massive (34 000 M⊙) cloud in Cygnus X.
DR21 (Downes & Rinehart downes1966 (1966)) itself is a group of several compact HII regions (Harris et al. harris1973 (1973)) with an associated, very energetic outflow (e.g. Garden et al. 1991a , Russell et al. russell1992 (1992)), located in the southern part of the ridge. Three arcminutes further north lies DR21(OH), famous for its maser emission (H2O, Genzel & Downes genzel1977 (1977); OH, Norris et al. norris1982 (1982); CH3OH, Batrla & Menten batrla1988 (1988)). Even further north lies the massive star-forming region W75N (see Shepherd et al. shepherd2004 (2004) for a review). Very recently, the DR21 filament was again the target for a wealth of studies in various wavelengths. Infrared images at 3.6, 4.5, and 8 m from the Spitzer satellite (Marston et al. marston2004 (2004), Hora et al. hora2009 (2009)) show the complexity of the region with many IR-filaments perpendicular to the ridge that seem to be sites of star formation (Kumar et al. kumar2007 (2007)). Dust continuum studies (Vallée & Fiege vallee2006 (2006), Motte et al. motte2007 (2007)) confirmed the detection of 8 compact, dense cores in the DR21 filament (Chandler et al. chandler1993 (1993)) and found additional ones. Some of them are high mass protostars and drive outflows detected in SiO (Motte et al. motte2007 (2007)). An H2 1-0 S(1) image at 2.121 m (Davis et al. davis2007 (2007)) shows at least 50 individual outflows driven by embedded low-mass stars.

We studied this particular filament in high-angular resolution observations with the IRAM333Institut de Radio-Astronomie Millimetrique 30 m telescope in different molecular tracers (isotopomeric CO lines, CS, C34S, HCO+, H13CO+, N2H+, H2CO) to investigate the distribution of the different phases of molecular gas (cold dense cores, warm envelopes) and to uncover infall/outflow signatures. The lower angular resolution FCRAO data delineate the large-scale structure in which the DR21 filament is embedded. A more detailed analysis of the FCRAO 13CO data set is presented in Schneider et al. (schneider2007 (2007), schneider2010 (2010)) and the CS and N2H+ data will be discussed in a forthcoming paper. All molecular line data we obtained serve as a basis for a physical model of the DR21 filament, including detailed non-LTE line modelling.
3 Observations
3.1 FCRAO
We used data from a molecular line survey (13CO and C18O J=10, CS J=21, and N2H+ J=10) of the entire Cygnus X region (Simon et al., in prep., Schneider et al. schneider2007 (2007)) taken with the FCRAO 14m telescope. The data were obtained between 2003 December and 2006 January using the 32 pixel ’Second Quabbin Optical Imaging Array’ (SEQUOIA) in an On-the-Fly (OTF) observing mode. In this paper, we employ 13CO 10, CS 21, and N2H+ 10 data that cover an area of 35 square degrees in 13CO and 12 square degrees in CS/N2H+ on a 22′′.5 grid. The beamwidth of the FCRAO at 93 (110) GHz is 45′′(48′′) and the dual channel correlator was configured to obtain a velocity resolution of 0.1 km s-1. The spectra have a mean 1 rms noise level of 0.2 K on a T antenna temperature scale, i.e., not corrected for the main beam efficiency of 0.48. Pointing and calibration were checked regularly at the start of the Cygnus observing interval and after transit (no observations were performed at elevations higher than 75∘). Pointing sources were SiO masers of evolved stars, i.e., -Cyg, R-Leo and T-Cep, depending on LST-time. The calibration was checked regularly on the position of peak emission in DR21 and found to be consistent to within 10%.
3.2 IRAM
All molecular line maps444The IRAM data are available on request, contact nschneid@cea.fr. obtained with the IRAM 30m telescope in the Sierra Nevada/Spain were performed in June 2007. Table 1 gives an overview of all lines and observational parameters. In order to efficiently map an area of 410′, covering the whole DR21 filament, we observed in the ’on-the-fly’ mapping mode. The total area was divided into 7 sub-maps that were scanned horizontally. For strong lines (e.g. CO, HCO+), only one or two coverages were required while weaker lines were observed more often or with two receivers at once to obtain a sufficient signal-to-noise ratio. The resulting regridded (5′′) maps show slight smearing effects and fluctuations in the intensity calibration only in the lines of 12CO and H2CO. The center position of all maps is within 3′′ of the MM2-position given in Mangum, Wooten, and Mundy (mangum1991 (1991)): RA(2000)=20h39m00s and DEC(2000)=42∘22′44′′. As OFF-position, we used a position with offset 0′′,1800′′ from DR21(OH) where 12CO 21 emission of around 1 K is observed at velocities around –42 km s-1, separated well from the bulk emission of the DR21 filament. All data were reduced using GILDAS555http:iram.fr/IRAMFR/GILDAS.
The spectral lines were recorded simultaneously in uniform, good weather conditions (average atmospheric opacity of 0.2 at 230 GHz) prevailing over several days. We used the IRAM facility receivers and autocorrelator, which were adapted in terms of spectral resolution and bandwidth such that all lines have a similar velocity resolution between 0.03 and 0.05 km s-1. Pointing and focus were checked every 2 hours. The pointing accuracy was found to be better than 4′′ and the receivers were aligned to within 2′′.
4 Results
4.1 The DR21 filament as part of a complex network
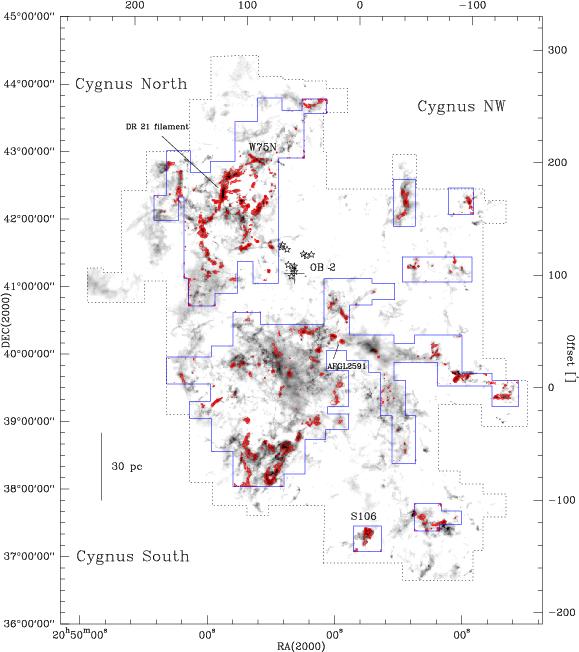
Figure 1 shows the zeroth moment map of line integrated (–10 to 20 km s-1) CS 21 emission obtained with the FCRAO overlaid on a grey scale map of 13CO 10 emission. The moment maps were constructed following the masked moment procedure described in Adler et al. (adler1992 (1992)). For CS and N2H+, we used a temperature threshold of 0.1 K, for 13CO a threshold of 0.2 K. For the CS mapping, we focussed on the high column density regions seen in 13CO. We adopt the nomenclature ’Cygnus-X North, South, and Northwest’, established in Schneider et al. (schneider2006 (2006)) for the different cloud regions.
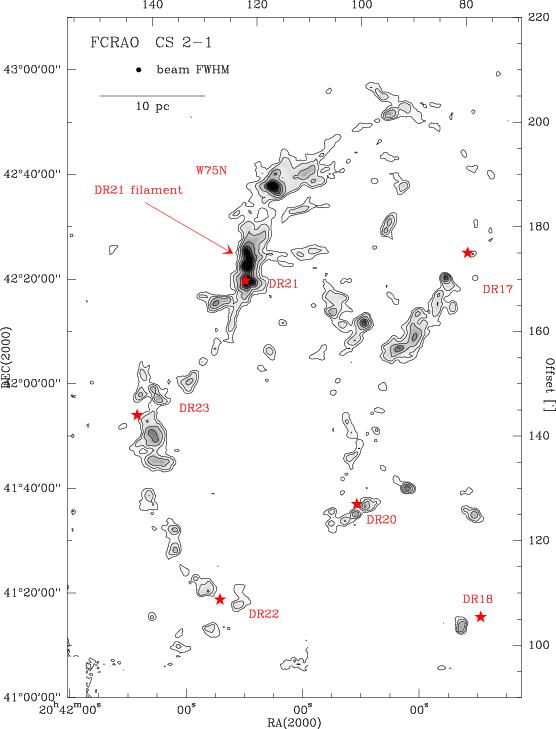
The CS emission is more compact than that of 13CO and clearly delineates the high density regions. Interestingly, regions of peak emission in 13CO do not always show up in CS. This indicates that, though the column density is high, the average density in these regions may stay below the critical density (ncr) of the CS line (a few 105 cm-3). Abundance variations caused by chemical effects probably also play a role. While in Cygnus North, and partly in its north-west region, CS clumps form a connected network of filamenatry structures, the emission distribution in Cygnus South is more dispersed with more isolated CS clumps.
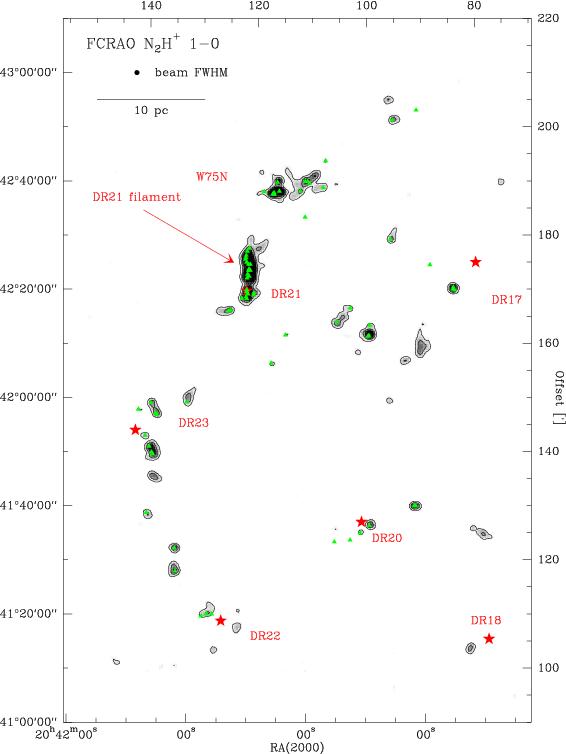
In the following, we concentrate on a discussion of the filaments in Cygnus-North. For that, we display in Fig. 2 maps of CS 21 and N2H+ 10 emission where the ’organization’ of clumps along filaments is clearly visible. Even the N2H+ map – which traces only dense (ncr=0.5–70106 cm-3) and cold gas (e.g. Tafalla et al. tafalla2002 (2002)) – shows the same arrangement of clumps. Most prominent in all maps is the filament containing the HII region DR21 (see below). The moment maps (Fig. 2) show that all evolved star formation sites in Cygnus North (indicated by the HII regions DR17 to DR23) as well as future star-forming sites (indicated by the mm-continuum sources tracing massive dense cores, Motte et al. motte2007 (2007)) lie on filamentary structures.
4.2 The DR21 filament
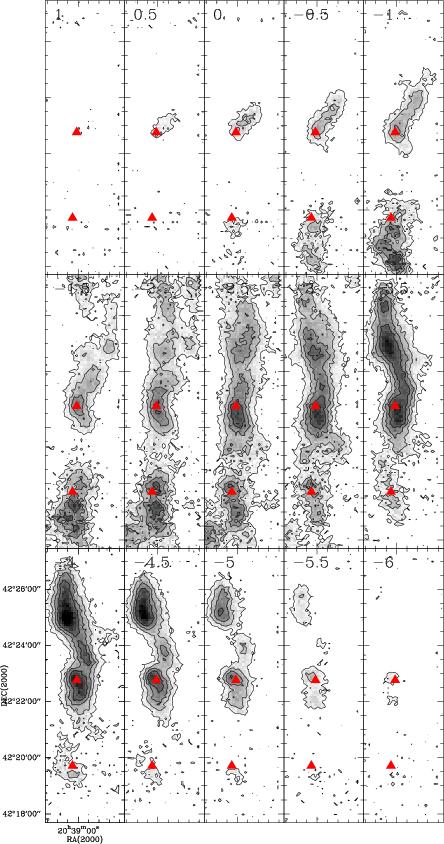
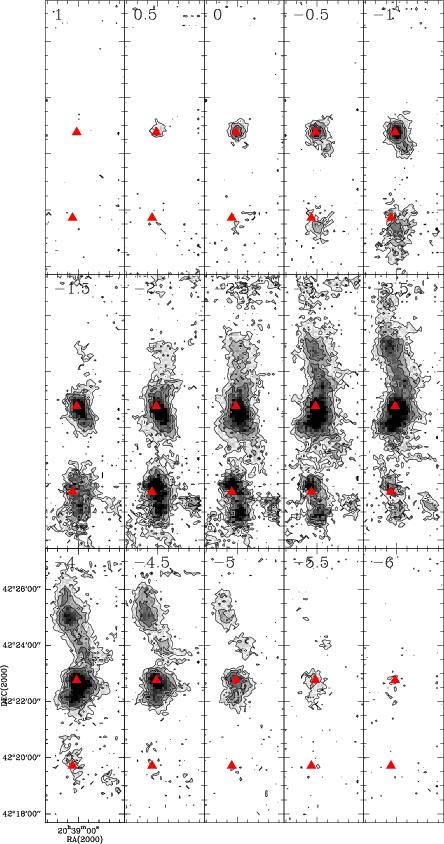
From the large-scale, medium-angular-resolution (1′) molecular line maps (Sect. 4.1) and previous studies (Sect. 1), the DR21 filament clearly appears to be the most prominent star-forming region in Cygnus X. The DR21 region in the south contains a very powerful, evolved outflow, while further north, the DR21(OH) region contains maser sources, indicative of recent star-formation activities. The mm-contiuum survey of Motte et al. (motte2007 (2007)) revealed more than 20 protostellar objects, i.e. sites of star formation. The filament is shown in more detail in channel maps of 13CO 10 emission (Fig. 3), obtained with the FCRAO. It reveals the characteristic N-S oriented ridge known from other molecular line and continuum surveys (Dickel et al. dickel1978 (1978), Wilson & Mauersberger wilson1990 (1990), Vallée & Fiege vallee2006 (2006), Motte et al. motte2007 (2007), Jakob et al. jakob2007 (2007)). What is special in these channel maps is the appearance of several E-W oriented subfilaments (indicated as F1–F3 at v=–2.6 km s-1) that are connected to the main DR21 filament and extend over several velocity channels. The most prominent one (F3) has a length of around 10′ (5 pc) and is also visible in the CS map (Fig.2) and in mm-continuum (Motte et al. motte2007 (2007)), indicating that gas of high density is present.

4.2.1 Average spectra
To study in more detail the physical properties (mass, density, temperature) and kinematics (infall and outflow signatures, velocity gradient) of the filament, we mapped the central part of the filament containing DR21 and DR21(OH) in various molecular line tracers at an angular resolution of between 12′′ and 30′′ using the IRAM 30m telescope.
To distinguish the different emission features of the filament, we produced positionally averaged spectra of five of the observed lines (Fig. 4). The averaging was performed across each map extent, i.e. covering the whole filament. The CO lines exhibit two velocity components, one centered on –3 km s-1 and one on +9 km s-1. They correspond to the molecular clouds associated with DR21 and W75N, respectively (see also Dickel et al. dickel1978 (1978)). Though the W75N region itself is not included in the mapping region, molecular gas related to this star-forming region northwest of the DR21 filament (see Fig. 2) is still present across the filament. However, the gas is more diffuse and of lower density since a line at 9 km s-1 (Fig. 4) can only be seen in the low-density tracers (12CO and 13CO). The HCO+ line reveals a narrow absorption feature at +9 km s-1 (seen also by Nyman nyman1983 (1983)), while the optically thin lines show no significant emission for the W75N component.
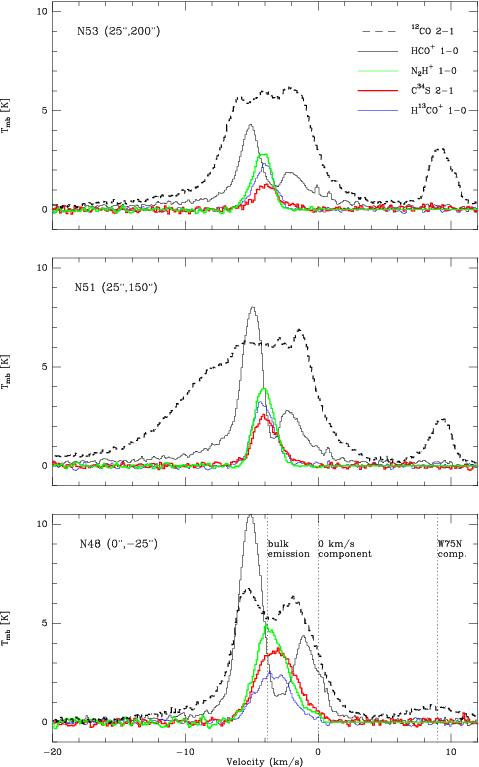
The bulk emission of the DR21 filament is found at –3 km s-1 (single Gaussian lines in C34S, H13CO+, and 13CO). The optically thick lines of 12CO and HCO+ show prominent, extended blue and red wing emission. The red wing, however, is blended with the W75N component, seen in emission in 12CO and absorption in HCO+. The wings are caused by the powerful outflow of DR21 (Garden et al. 1991a ) but also other outflow sources discussed in Sect. 4.3. The self-absorption feature at –3 km s-1 is seen in the optically thick lines of 12CO and HCO+, while optically thin lines peak at the velocity of the absorption dip. This may be a signature of inflowing gas and is discussed in more detail in Sect. 5.2.


4.2.2 The DR21 filament in velocity-integrated maps
Based on the average spectrum (Fig. 4) we produced line integrated maps of the bulk emission of the DR21 cloud (Fig. 5). Though there are differences in the detailed emission distribution, one can separate three main regions: a southern cloud with DR21, a middle emission peak with DR21(OH), and a northern extension with two secondary peaks.
While DR21 is most prominent in the HCO+ and 13CO lines, DR21(OH) is more pronounced in all optically thin lines. A small shift in the position of peak emission of DR21(OH) can be discerned by comparing C34S/H13CO+ and N2H+. For N2H+, we determined the optical depth using the hyperfine structure pattern of this line and found that remains below 1 basically everywhere in the map. The latter traces cold, dense gas that is located more south of the warmer central part of the DR21(OH) region. Mauersberger et al. (mauers1986 (1986)) report a temperature above 200 K in a small region of size 9′′ in DR21(OH), and Wilson & Mauersberger (wilson1990 (1990)) determine a rotation temperature of 34 K from NH3 observations. Mangum et al. (mangum1991 (1991),mangum1992 (1992)) interpreted their observations as a detection of a B-star within the DR21(OH) clump. The northern part of the filament is more prominent in N2H+ and H13CO+ emission and not in C34S. Wilson & Mauersberger (wilson1990 (1990)), and Wienen (wienen2008 (2008)) derive values around 20 K for this region.
Figure 6 is a position-velocity cut in 12CO and 13CO 21 and HCO+ 10 along the filament in which all data points in RA were averaged. The greyscale image of 12CO emission shows that the bulk emission of the DR21 filament at –3 km s-1 and the bulk emission of the W75N component at 9 km s-1 are apparently connected. The gas linking the two components has a low column density since it is only visible in 12CO and not in 13CO (red contours). A lack of 12CO emission exists between =0′′ and –150′′ at 8 km s-1, indicating that the (cooler) W75N cloud lies in front of the DR21 filament and causes the 12CO self-absorption. Dickel et al. (dickel1978 (1978)) and Bieging et al. (bieging1982 (1982)) came to the same conclusion following their detection of self-absorbed line profiles in H2CO and OH toward DR21. However, the situation is slightly more complicated because the W75N line component is blended in its southern part (0′′) with emission from the ’Great Cygnus rift’, which is basically not seen in 13CO emission (Schneider et al. schneider2007 (2007)). The rift is an extended, low-density gas cloud at a distance of around 600 pc. Its emission can start as low as +4 km s-1 and makes it thus difficult to disentangle the different emission features. It is, however, possible that there is a real physical connection/interaction between the DR21 filament and the W75N cloud, as proposed by Dickel et al. (dickeldickel1978 (1978)). They suggested that the ’W75N’ cloud is differentially slowed down as it passes the edge of the DR21 cloud due to the observed N-S oriented velocity gradient from +11 km s-1 to +9 km s-1 (which is clearly seen in our CO data as well).
Several outflows are identified out of which the DR21 outflow at =–200′′ is the most pronounced. However, its red flow is not clearly defined because (i) it is blended with the ’Great Rift’ emission and (ii) because it runs into an HII region (Garden et al. garden1992 (1992)). The blue flow, however, is clearly defined. Other ’flow-features’ are identified at =0′′ (DR21OH(M)) and at 180′′, both look well-defined at negative velocities and disturbed for positive velocities. The position-velocity diagram for HCO+ shows that these outflows are much less obvious than that towards DR21. We come back to outflows in Sect. 4.3 and in particular the one seen at DR21OH(M) in Sects. 4.2.3 and 5.2.
Another feature visible in Fig. 6 is a region of self-absorption in 12CO (emission regions in 13CO) at around –3 km s-1 along the whole filament (indicated by a dashed white line). This central region of self-absorption is even more clearly identified in the HCO+ map. The strongest self-absorption is found at the declination offsets of DR21 and DR21OH(M). We discuss this finding in more detail in Sect. 5.2.
4.2.3 A subfilament at 0 km/s – channel maps of optically thin lines
Figure 7 shows channel maps of H13CO+ and C34S emission between +1 and –6 km s-1. The distribution of bulk emission of the cloud between –2 and –5 km s-1 is similar in both tracers and follows the typical NS-ridge of the DR21 filament. Some emission peaks are stronger in H13CO+ than in C34S (and vice versa) due to the different density and temperature regimes. An example is seen at velocity –4 km s-1 where C34S peaks prominently at the DR21(OH) clump while H13CO+ emits more strongly in the northern part of the filament.

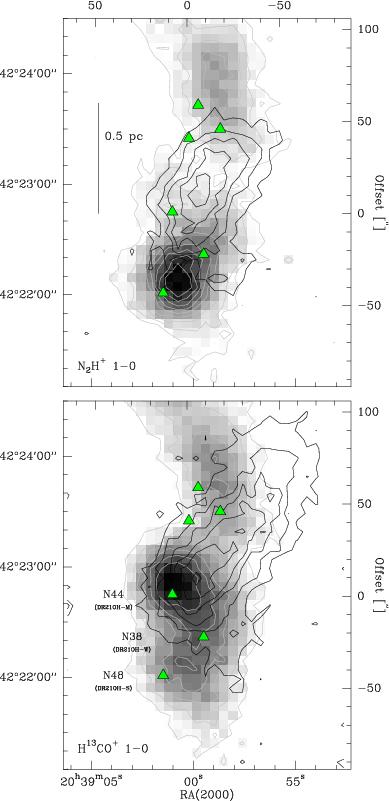
At velocities larger than –2 km s-1, we identify an extended emission component between –1 and that appears prominent in H13CO+ (and N2H+ not shown here) but not in C34S (and H2CO also not shown here) northwest of DR21(OH). In 12CO and 13CO 21, this feature is discernible as well, but largely blended with other emission components. This sub-filament is the eastern end of the large-scale filament F3 that was observed in lower-angular resolution 13CO 10 channel maps (Fig. 3). It was also seen in isotopomeric CO 32 data (Vallée & Fiege vallee2006 (2006)) and interpreted by the authors as being caused by outflow emission from DR21OH(M). An outflow is indeed detected at this position (see Sect. 4.3) but the emission in the velocity range –1 to 1 km s-1 is clearly due to an individual cloud fragment. Spectra towards a position within this fragment are shown in Fig. 8. An individual Gaussian line is seen at 0 km s-1 for all optically thin lines (at this position rather close to DR21OH(M) also for C34S). It becomes obvious that the 12CO 21 line – even at an angular resolution of 11′′ – is not useful for separating individual components since it is too sensitive to low-density emission. Figure 9 superimposes N2H+ and H13CO+ emission in the two major velocity ranges, the bulk emission between –6 to –3 km s-1 in grey scale and the fragment emission between –1 and 1 km s-1 as overlaying contours. The emission in H13CO+ for both velocity ranges peaks at the position of DR21OH-(M). A secondary weaker peak is found 50′′ further south, close to N48 (or DR21OH-(S))666In this paper, we follow the notation of mm-continuum clumps given in Motte et al. motte2007 (2007). This source list is more complete than the one from Chandler et al. chandler1993 (1993). However, for clarity, we still give the former names DR21OH(Main, South, West) on occasion., where N2H+ between –6 and –3 km s-1 has its peak emission. This supports the ’hot core’ scenario for DR21-OH(M) because the gas there is warmer and chemically richer than in the dense, cold core of DR21OH-(S). This core, however, is embedded in a warmer envelope traced by H13CO+. Even more interesting is the 0 km s-1 component. The emission distribution in H13CO+ and N2H+ suggests that this fragment ’falls’ on the densest part of the DR21OH(M) clump. The N2H+ peak is more distinct and smaller in extent and shifted with respect to H13CO+, again indicating that H13CO+ emission arises from the warm envelope.
4.3 Ouflows
Figure 10 shows in more detail the outflow features detected in Fig. 6. From the position-velocity plot and positionally averaged 12CO spectra, we can clearly define the blue emission range between –30 and –17 km s-1. The redshifted emission is more difficult to discern because at higher positive velocities, a part of the line emission in the southern part of the DR21 filament is due to the ’Great Cygnus rift’ (see Sect. 4.2.2). However, the velocity range 17 to 30 km s-1 characterizes well the red wing.
Several blue outflow sources are clearly recognized. These are all associated with mm-continuum sources, i.e. N53, N44, and N45. Source N51 shows broad line wings in 12CO and HCO+ (Fig. 14), which is most likely only the south extention of the N53 outflow. Southeast of N44 and at offsets –100′′,–140′′ are clearly defined blue sources that have no red counterparts. Sources N53, N48, and N44 show outflow emission in SiO 21 (Motte et al. motte2007 (2007)) with a prominent red wing for N53 and a blue wing for N44. They are classified as massive infrared-quiet protostellar cores (Motte et al. motte2007 (2007)) with masses of 85, 197, and 446 M⊙, respectively. N45 exhibits no SiO emission but is associated with an H2 jet (source A 3-1 in Davis et al. davis2007 (2007)), which is probably driven by a low- or intermediate-mass YSO (all H2-jets are marked with crosses in the plot). N44 is the known outflow of DR21(OH), seen in CS 54 emission (Richardson et al. richardson1994 (1994)) and indirectly traced by the spatial and kinematic distribution of maser sources (Plambeck & Menten plambeck1990 (1990)). However, no H2 emission was detected (Davis et al. davis2007 (2007)).
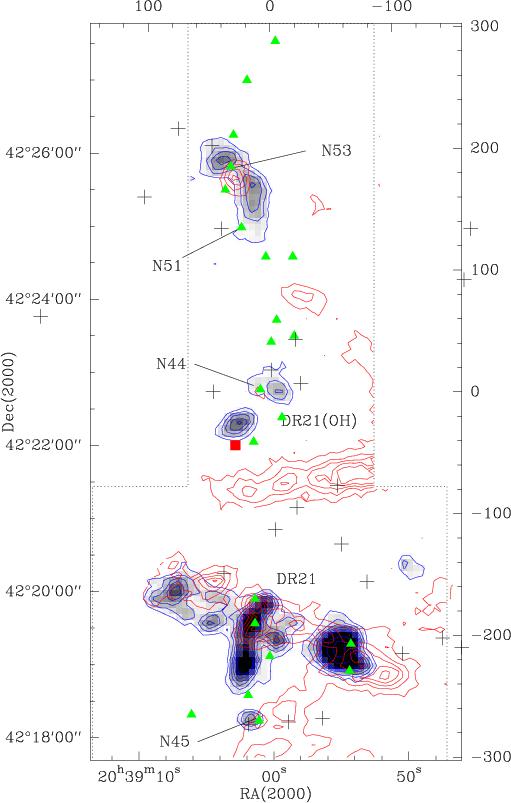
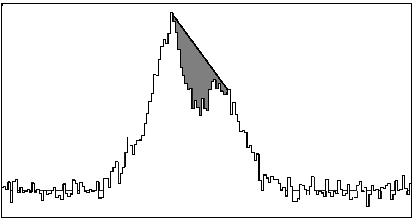
This source is well studied (e.g. Garden et al. 1991a , 1991b , garden1992 (1992)), so we do not go into details here. In our map, we see also the classical east-west orientation of the flow with some north-south features (e.g. component ’C’ in Garden et al.). Among the other sources, only N53 and N44 show red wing emission. It is not clear what the emission feature running east-west at offsets –60′′ in declination is. In Fig. 10, it shows up in HCO+ emission as a typical outflow feature. But it has no blue counterpart and may well be associated with the Cygnus Rift.
5 Analysis
This section is devoted to an analysis of the physical properties of the DR21 filament. We, however, exclude the area around DR21 since this region is perturbed by outflow emission and line confusion. We focus instead on the northern part of the DR21 filament, including the region of DR21(OH).
5.1 Physical properties of the sub-filaments
Our molecular line observations show that the DR21 filament is connected to several sub-filaments seen on large and small scales. In the 13CO 10 channel maps (Fig. 3), it becomes obvious that the most prominent filament F3 covers a velocity range of 3 km s-1 (between –4 km s-1 and –1 km s-1) and has a projected length of 7 pc (the width is 1.5 pc). The channel maps show that the top of the column lies at higher velocities, indicating that this part of the filament is tilted away from the observer. Assuming an average angle to the line-of-sight of 57.3∘ (in the case of a random distribution of orientation angles, the average angle is equal to this value), this implies a dynamic lifetime of 1.5106 yr. The mass of the filament (for more details see Appendix A about the mass determination from 13CO data) is 2600 M⊙ and the average density is 690 cm-3. This sub-filament indeed corresponds to ’clump 7’ in the DR21 region, identified in the 13CO 21 survey by Schneider et al. (schneider2006 (2006)).
The higher angular resolution IRAM observations resolve the detailed structure and show how this sub-filament connects to the DR21(OH) clump within the filament (see Sect. 4.2.3). The mass, determined from the line integrated H13CO+ intensity (see Appendix A), is 1320 M⊙ with an average density of 8.1104 cm-3. This mass estimate, however, is rather uncertain because of the uncertain [HCO+]/[H2] abundance ratio. From the channel maps (Fig. 7), we see that the filament extends up to 0.5 km s-1 and therefore has a total radial velocity range of 4.5 km s-1 at a length of 1 pc. If we assume that it connects to the large filament F3, the lower velocity levels are equally around –4 km s-1, thus implying a total velocity range of 4.5 km s-1. Again, assuming an average angle to the line-of-sight of 57.3∘, this implies a very short dynamic lifetime of 1.4105 yr.
In addition, we note that in the high spatial resolution IRAM data, this sub-filament shows a position angle of 45∘ in projection to the sky, while on a larger scale F3 is mostly east-west oriented (PA 100∘). This bend, which could be related to the deep gravitational well of the DR21(OH) clump, may also be present along the line-of-sight, explaining the apparent acceleration from 3 to 4.5 km s-1 along the sub-filament between large and small scales. Assuming a constant velocity of 4.5 km s-1 (the largest observed range of velocity) along the whole F3 sub-filament, the angle of the sub-filament to the line-of-sight would be 48∘ before the bend and 90∘ after the bend, close to DR21(OH) (i.e. streaming away from the observer along the line-of-sight). This 3D view of F3 seems to be corroborated by the largest velocities in the IRAM data being found closest to DR21(OH). The total length of the F3 sub-filament would then be at least 9.4 pc (7 pc divided by sin(48∘)) with no information about the length along the line-of-sight after the bend, leading to a total dynamic timescale of 2.1106 yr, and an input mass rate of 1.910-3 M⊙ yr-1 (total mass of F3 on large and small scales divided by the timescale).
5.2 Infall signatures across the filament
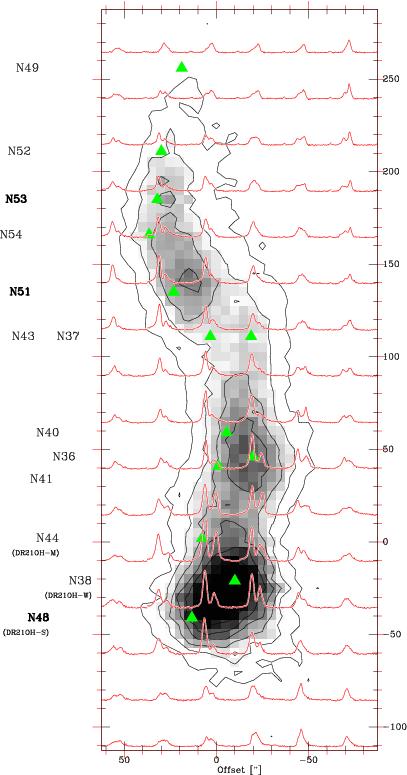
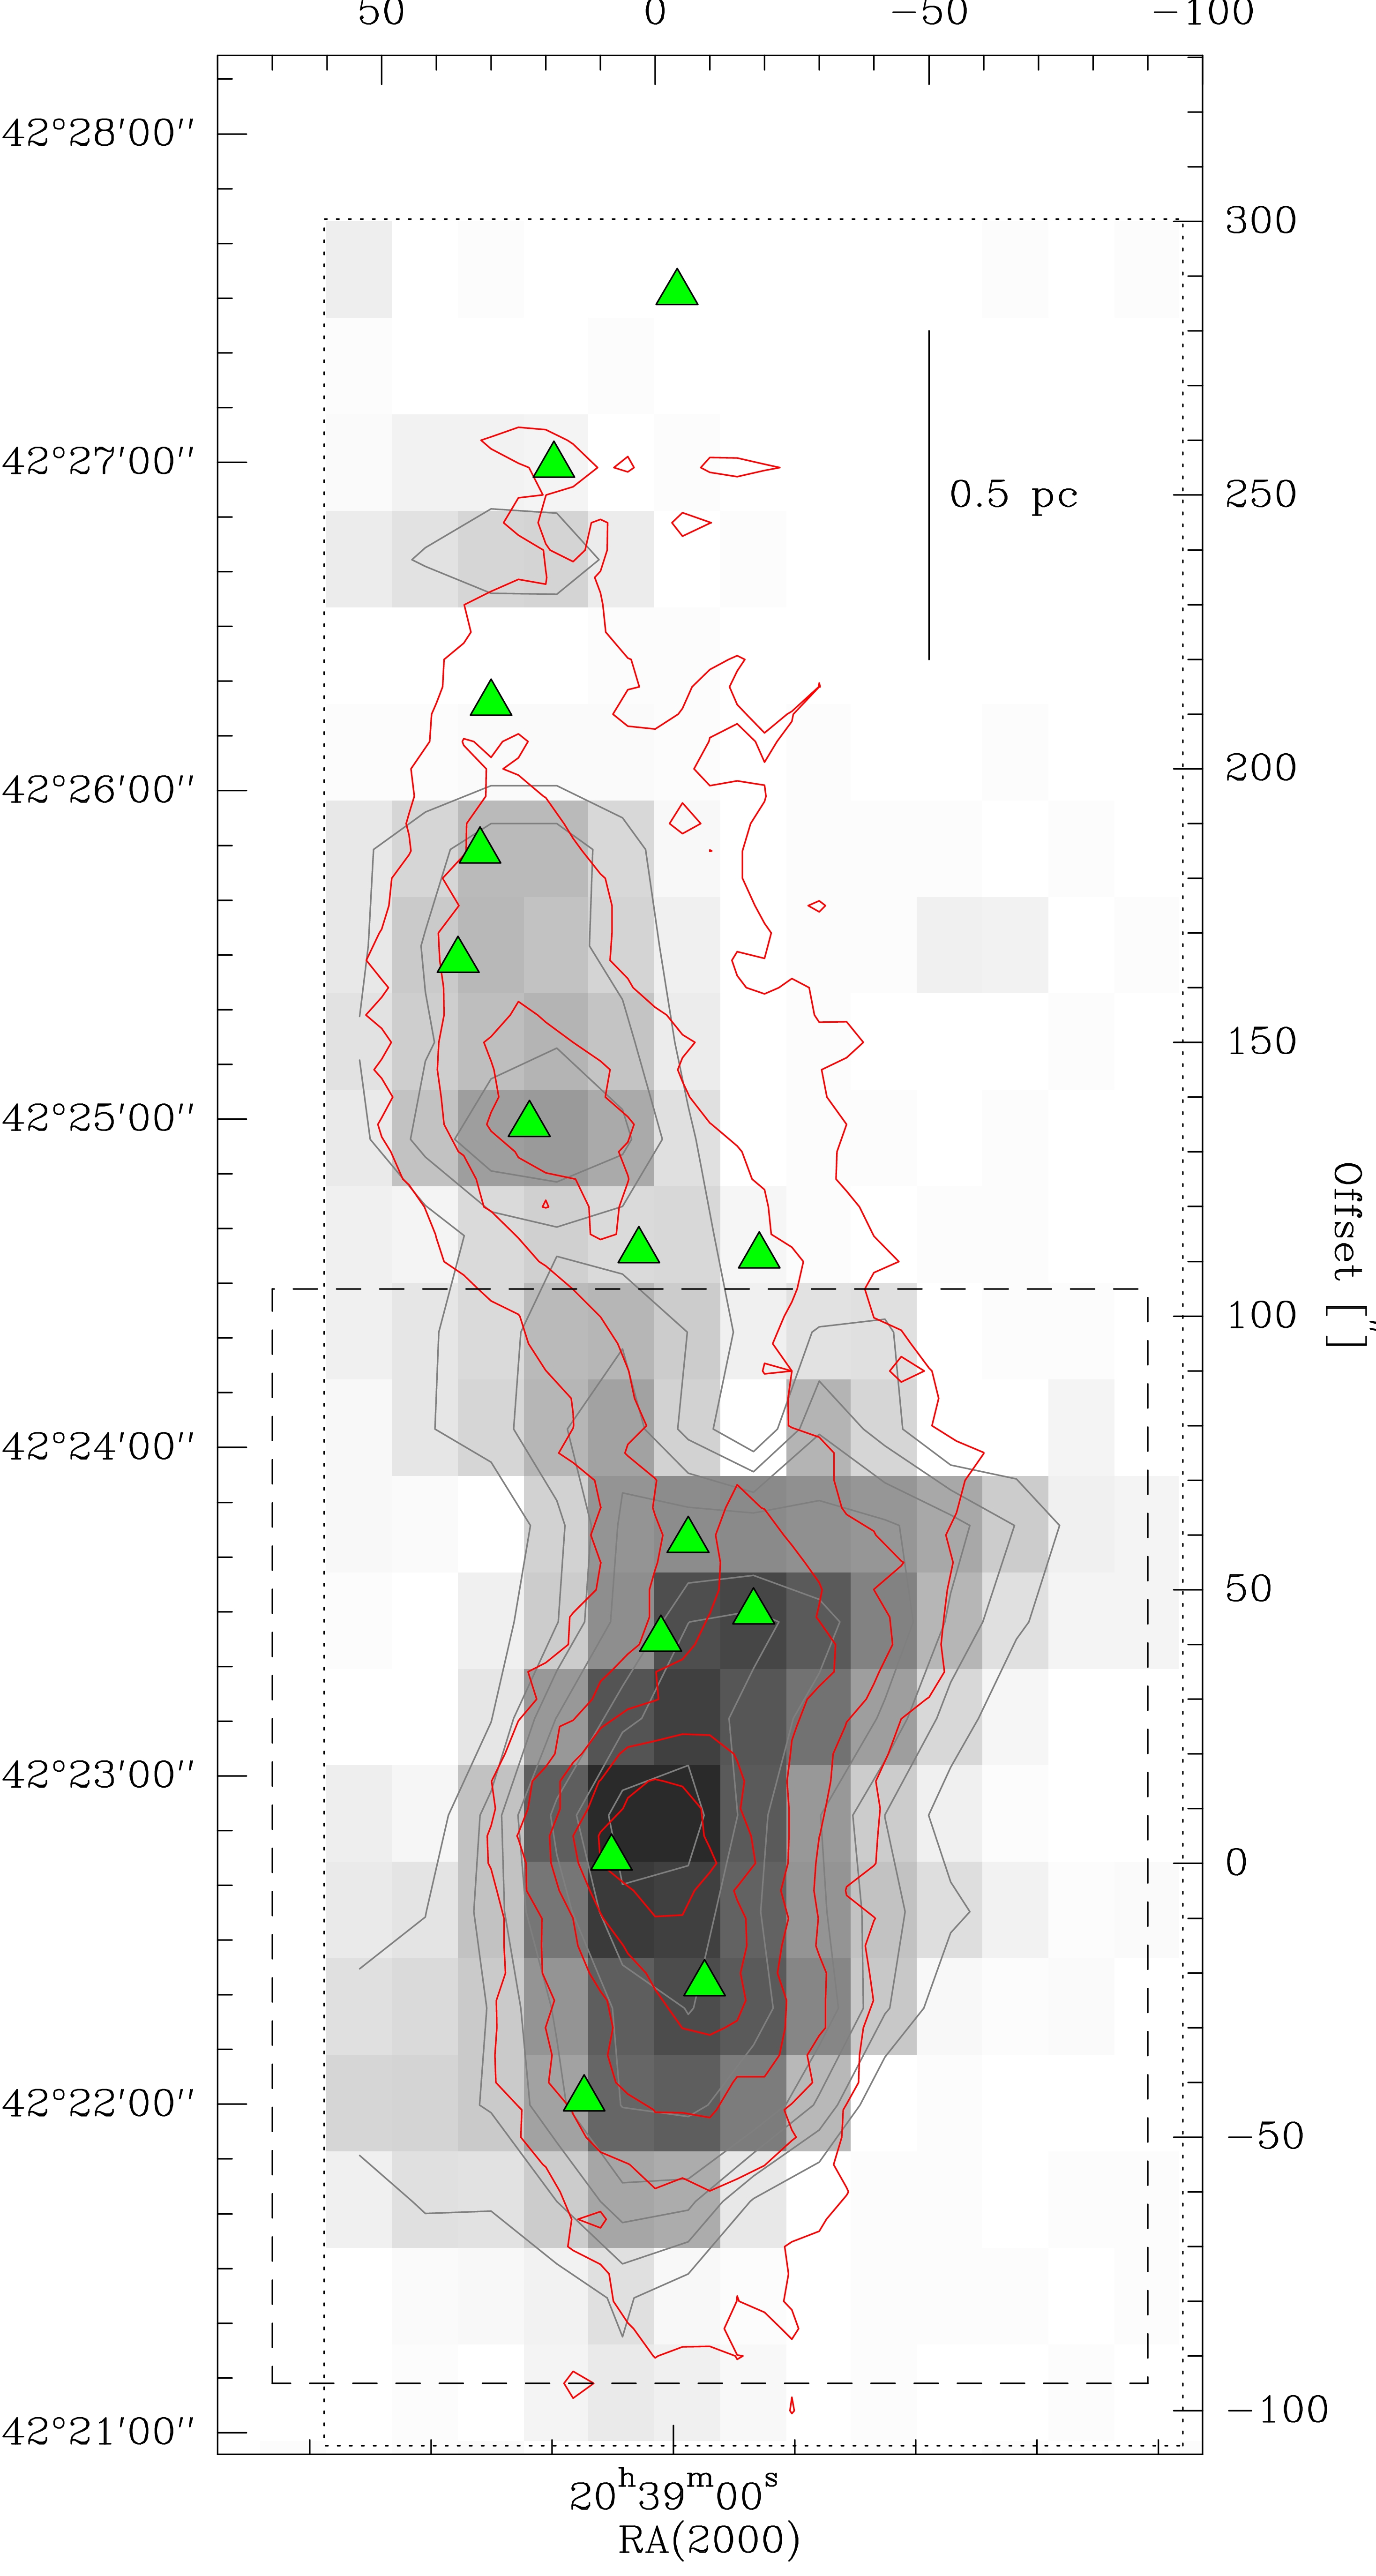
Figure 11 shows an overlay of HCO+ 10 spectra (red) on a greyscale plot of line integrated N2H+ 10 emission (both at an angular resolution of 30′′). It is obvious that HCO+ displays along the whole filament the ’typical’ profile of an optically thick spectral line which is indicative of infalling gas, i.e. a blue-shifted line wing that is stronger than the red wing (Myers et al. myers1996 (1996)). This self-absorption was already visible in 12CO emission (Fig. 6) but becomes more pronounced using the HCO+ line. In order to quantify this infall signature, we determined the normalized integrated intensity (see Fig. 12 between the blue and red line components (with T(blue)T(red)), i.e. the ’amount’ of self-absorption, and plotted this quantity in Fig. 13. It is remarkable that self-absorption is seen everywhere in the filament on a size scale of 10′=5 pc with smooth transitions and not only locally at the position of mm-continuum sources. However, spectra with strongest self-absorption are found at the position of N44 (DR21OH(M)).
To exclude the possibility that we observe several line components, we display in Fig. 14 examples of various lines at three selected positions (that are modeled in Sect. 5.3). First, the spectra show that 12CO is not the most reliable infall tracer since it is ubiquitous and the infall profile is most clearly seen in HCO+. The figure also clearly proves that not two different cloud components are observed since all optically thin lines (C34S, N2H+, H13CO+) peak in the emission gap of HCO+. Apart from the known line components at –3 km s-1 (bulk emision of the DR21 filament) and +9 km s-1 (W75N, only visible in 12CO 21), the 0 km s-1 component (see Sect. 4.2.3) is best traced in N2H+ emission.
Since it is assured that we observe a true infall signature across the DR21 filament, we determined the infall velocity vin to first order using the method described in Myers et al. (myers1996 (1996)).
| (1) |

Here, is the H13CO+ velocity dispersion, , vred and , vblue the temperature and the velocity of the red and blue part of the absorption profile, respectively, e=2.71828 the Eulerian number, and TD is the brightness temperature of the dip. In all calculations, we excluded the area containing DR21 (–100′′). The velocity dispersion is determined from the FWHM line width of the optically thin H13CO+ line (=FWHM(H13CO+)/). We disentangle the optically thin emission of the molecular ridge (–3 km s-1) from the infalling sub-filament at 0 km s-1 with a double Gaussian fit that precisely determines of the bulk emission to be –3 km s-1. For the optically thick HCO+ line, we did not perform such a double Gaussian fit since the –3 km s-1 component, showing the infall signature, dominates strongly over the single Gaussian 0 km s-1 component (this means that the subfilament does not show an infall signature). We determined the temperature and the velocity of the red (, vred) and blue (, vblue) part of the absorption profile by fitting a Gaussian to each wing. We only computed the infall speed in a region where the emission of the second component does not contribute significantly and confuse the absorption profile. We note that we consider each point in the map as a single two-layer model (as outlined in Myers et al. myers1996 (1996)).
Figure 15 shows the results of this procedure. Supersonic infall velocities, v0.2 km s-1 for gas of a temperature of 10 K (typical value found), are detected within the red contour line, i.e. covering a large part of the filament. Interestingly, the highest values of vin (0.6–0.8 km s-1) are not detected exactly towards the column density maxima (indicated by N2H+ and mm-continuum emission in the right panels of Fig. 15), but, instead, show some significant spatial offsets ranging from 20′′ to 30′′ (i.e. of the order of 0.2 pc) in projection. In the center region (DR21OH(M) and N40) and in the south of the filament (N38 and N48), high values of vin are mainly due to the increasing optical depth of the HCO+ line since the infall velocity is determined by the ratio / (eq. 1), which increases with . In the north, higher values of vin are offset by 20′′ to the dense clump containing N51 to N54 and are mainly related to the larger linewidths of the N2H+ line (see Fig. 18, showing the same increase in linewidth for H13CO+ displaced with respect to the dense clump).
Please note that this behaviour does not involve a gradual increase in infall speed since we only determine the infall velocity at each point of the map assuming local infall at each point. From this figure, we can not extract the radial profile of the infall speed within the whole filament. For that, we need a more realistic radiative transfer model, by considering the density and temperature structure in the dense clumps of the filament as we present in the next section.
5.3 Radiative transport modelling with Simline
We used the 1D non-LTE radiative transfer code Simline (Ossenkopf et al. ossenkopf2001 (2001)) to simultaneously model the observed optically thin H13CO+ and optically thick HCO+ lines of the two clumps indicated on the right panel of Fig. 15. These were extracted from the mm-continuum survey obtained by Motte et al. (motte2007 (2007)) and characterize well the two major regions of infall. The southern Clump-14 is associated with DR21(OH) and contains the cores N36, N38, N41, N44, and N48. In the northern part of the filament, Clump-16 contains the cores N37, N43, N51, N53, and N54. The advantage of using mm-continuum data is that we have a rather reliable mass estimate than can be used as input to the model. Our ultimate goal is to derive the infall velocity and the level of depletion by constraining a simple physical model for these clumps.
5.3.1 Input parameters and assumptions
For both clumps, we used the Gaussian parameters (flux and FWHM) determined by Motte et al. (2007) and assumed the more realistic density profile to estimate the mass and corresponding radius. We also recalculated the mass down to the level of 10% of the peak contour Clump-16 taking a mass-averaged temperature of 20 K (rather than the median temperature of Cygnus X clumps, 15 K, used by Motte et al. 2007), which is in closer agreement with NH3 measurements of this clump (Wienen 2008). The model self-consistently takes the mass corresponding to the mass-averaged temperature with a profile , where is between –0.2 and –0.6 ( and are the temperature and radius of the inner layer, see below). We adapted a two-layer geometry for the model since runs with only one layer did not reproduce well the observed line profiles, a result similar to that of Jakob et al. (jakob2007 (2007)) who equally applied a two-layer model for their low-angular resolution mid-J CO and atomic CI lines. However, they modeled their observations without considering molecular depletion and no or only very low infall speeds. We applied a subthermal external layer at constant temperature with an average density of n103-104 cm-3 because the self-absorption dip is very deep.
For the determination of the turbulent line-width, we used the optically thin line of H13CO+. A single Gaussian fit yielded line-widths of 2.50.5 km s-1 for Clump-14 and 1.50.5 km s-1 for Clump-16, respectively. This line-width is a result of thermal width, internal turbulence, and possible infall. Since both turbulence and infall broaden the line, their parameter space must be explored carefully.
For the HCO+ abundance, we take a value of X(HCO+) 1-510-9 (e.g. Marseille et al. marseille2008 (2008)) and adopt an isotope ratio 12C/13C = 67 (e.g. Lucas & Liszt lucas1998 (1998)). However, HCO+ is known to be depleted in cold environments and at densities higher than 105 cm-3 (Tafalla et al. tafalla2002 (2002)). We expect this happens in Clump-16 but to a lesser extent in Clump-14 since this region contains a hot core. We thus introduce a threshold density ntresh in our model, with a sharp jump in the abundance profile if n. The depletion factor is assumed to be in the range 1-100.
Our strategy to constrain the infall speed was to vary the depletion ratio, the abundance, and the threshold density (between the given limits). To determine the best fit to the model, we performed a reduced -test.


| Clump-14 | Clump-16 | |
| total mass | 4900 M⊙ | 3346 M⊙ |
| size | 0.52 pc | 0.615 pc |
| density profile () | –8.0 | –8.0 |
| mass-averaged T | 20 K | 15 K |
| –0.6 | –0.5 | |
| line width | 2.5 km s-1 | 1.5 km s-1 |
| X(HCO+) | 2.510-9 | 2.510-9 |
| 12C/13C | 67 | 67 |
| depletion ratio | 7 | 28 |
| 25 | 26 | |
| 0.81 | 0.99 | |
| vinf | –0.6 km s-1 | –0.5 km s-1 |
5.3.2 Results
Figures 16 and 17 show the observed and
modeled spectra of HCO+ and H13CO+ for Clump-14 and
Clump-16, respectively. For better orientation, the two cuts are
indicated in Fig. 15. Table 2
summarizes the explored parameter space and gives the results for the
best fitting model. We note that the spectra of both sources have
broad wings caused by outflow emission that we did not account for in
our modeling.
Clump-14
For Clump-14, our best-fit
model closely reproduces the spectral lines of HCO+ () and H13CO+ ().
It was necessary to use a rather large outer layer to reproduce well
the absorption dip, which extends to R 0.9 pc increasing by
20% the mass of our model. We found that a temperature profile of
and a mass-averaged temperature of 20 K provides a
closest fit to our data, where the discrepancy in the peak intensity
of the lines is smaller than 20%. This also indicates that the inner
part of this clump tends to be hotter, reaching up to 100 K in
the central part.
The depletion occurs at a radius of 0.25 pc with a depletion ratio of
. This may be due to the temperature because the central
region is a hot molecular core. With this configuration of geometry
and parameters, we derive an infall speed of –0.6 km
s-1, which compares well with the values derived from the Myers
et al. method (see Sect. 5.2).
Clump-16
The best-fit model for Clump-16 (Fig. 17) reproduces
very well the H13CO+ line () but less well the
optically thick HCO+ line (). Since the densities
are lower for this clump, the extended outer layer is smaller than
that of Clump-14 and reaches out to R0.8 pc
reproducing the 103 cm-3 density. As we kept the exponent
for the temperature profile free, we found that
most closely fits our data. This results in a maximum of T60 K
in the central region. The depletion occurs at R 0.2 pc with a
depletion ratio of 28, implying that in the central, very dense part
of this clump, this molecule is strongly depleted.
The fit value of the infall speed is –0.5 km s-1, again within the range obtained from the more simple Myers et al. method. The strongest constraint on the infallvelocity is the ratio of the left-to-right wing intensity ratio, because the position of the plotted spectra is aligned with the optically thin line.
| Ra | Mb | n | v | dM/dte | |
|---|---|---|---|---|---|
| [pc] | [M⊙] | 105 [cm-3] | [km s-1] | [M⊙ yr-1] | |
| Clump 14 | 0.52 | 4900 | 1.26 | 0.6 | 5.8 10-3 |
| Clump 16 | 0.615 | 3346 | 0.52 | 0.5 | 2.8 10-3 |
a Equivalent radius of infall region
b Mass from mm-continuum (see Table 2)
c average H2 density, derived from the mass given in column 2
d infall speed, determined from Simline modelling (Sec. 5.3)
e mass infall rate M/t = M vin/R
5.4 Global infall properties of the DR21 filament
Table 3 summarizes the infall properties of the two main infall regions that we defined in the Simline modeling. It is first important to understand that we discuss here the global dynamic features of the molecular clumps on a size scale of 0.5 pc, and not the physical properties of individual cores on a size scale of 0.1 pc.
The large global infall speeds on a 0.5 pc size scale and the high masses of the clumps lead to large global infall rates of of 5.810-3 M⊙ yr-1 and 2.810-3 M⊙ yr-1 for Clump-14 and Clump-16, respectively. However, one has to distinguish between large-scale flow motions and local core collapse. The expression ’infall’ , representing material that is falling onto a protostar or – more generally – into a gravitational potential well that could form many stars within a core that is gravitationally collapsing has to be used with care. In Fig. 15, we see that the highest values of ’infall’ speed do not always correspond to dense cores, only source N48 shows a local peak for vin. For the rest of the DR21 filament, the highest ’infall’ speeds are found in the less dense western part of the filament and not in the dense post-shock gas. In view of the high mass infall rates, this implies that there is a significant contribution of matter input either by directed flows (as would be the case for large-scale convergent flows) or gravitational collapse of the DR21 filament itself on a large scale. Both clumps have a low virial parameter 777The virial parameter is defined to be =Mvir/M where the virial mass is Mvir[M⊙]=699 R [pc] and the mass M from Table 2. of 0.46 and 0.30 for Clump 14 and Clump 16, respectively, and are thus strongly gravitationally bound. Their free-fall lifetimes tff888tff[yr]=1.37 10 are 0.9105 yr (Clump 14) and 1.3105 yr (Clump 16), a factor 20–30 shorter than the sound crossing time, which indicates that they are indeed in global collapse (if the simple picture of a collapse onto a single gravitational potential is maintained). On the other hand, the infall rates are in agreement with the theoretical predictions of both the micro-turbulent core model (McKee & Tan mckee2003 (2003)) and the gravo-turbulent fragmentation model (e.g. Klessen et al. klessen1998 (1998), klessen2000 (2000), klessen2001 (2001), Padoan & Nordlund padoan2002 (2002), Banerjee & Pudritz banerjee2007 (2007)).
5.5 The kinematic structure of the DR21 filament
To further characterize the kinematic structure of the DR21 filament, we determine the line velocity and velocity dispersion using H13CO+ and N2H+ by fitting a Gaussian profile to the –3 km s-1 component as described in Sect. 5.2. For N2H+, we additionally fitted the hyperfine structure pattern of the molecule.
5.5.1 Velocity dispersion
Figure 18 reveals that the H13CO+ main beam brightness temperature map shows a V-shaped feature in the north of the filament. The western component is a factor 2-3 weaker than the eastern one, which has a pronounced peak at the position of N51. This peak is stronger than that towards N44/DR21OH(M) (the reverse is true for the line integrated intensity, see Fig. 5).


Most remarkable, however, is the velocity dispersion (determined from the FWHM of the line with =FWHM/() seen in H13CO+ as well as in N2H+ (not shown here). The velocity dispersion increases towards the geometrical center of the filament from sonic levels to values of 1.3 km s-1. In the northern part of the filament (declination offset0′′), the gradient is stronger than in the southern part (south of N44/DR21OH-(M)) where we see a more homogeneous distribution of . Interestingly, in the northern part of the region highest -values are found between the two vertical features of H13CO+ emission (with a decrease of from 1 km s-1 to 0.8 km s-1 in the densest region in the east). This becomes even more obvious in Fig. 19 where we plot contours of (from H13CO+) over a map of N2H+ line integrated intensity (proportional to the column density). Thus, there is a clear offset between high and high column densities. This scenario can be explained if it is assumed that clumps are produced by turbulent flows because in this case, the densest gas has been shocked and slowed down so that the largest velocity dispersions do not occur in the densest regions but in the outskirts (Klessen et al. klessen2005 (2005), Vazquez-Semadeni et al. vaz2008 (2008), Federrath et al. fed2009 (2009)). We return to this point in the discussion. The southern part (offset DEC0′′) seems to behave differently. The N2H+ column density and H13CO+ line temperature are highest in the core region (0.5 pc diameter) of N38, while the velocity dispersion remains on a rather constant, high-level of around 1.2 km s-1 in an area of 1 pc diameter. However, a projection effect could explain the difference.: it is possible that a similar offset between velocity dispersion and highest density region is seen face-on.
5.5.2 Velocity field
Figure 19 shows the complex velocity field of the DR21 filament determined from N2H+ (the H13CO+ map not shown here looks very similar). Three main, basically horizontal, projected velocity gradients are observed. While the northern and southern part show a decrease of velocity from west to east (–2.2 and –0.8 km s-1 pc-1), the middle part has a positive value of +2.3 km s-1 pc-1. Interestingly, we observe in this region a ’turnover’ in the velocity gradient that corresponds to the material of the 0 km s-1 component ’falling’ onto the bulk of the filament (see Fig. 19). It is clear that the velocity pattern cannot be explained with a single rotation of the filament along a vertical axis. An alternative explanation would again be that at least a part of the observed motion is due to convergent flows (see Sect. 6) and/or rotation of the individual parts of the filament.
6 Discussion
The dynamic structure of the DR21 filament exhibits several remarkable features:
-
•
Several sub-filaments are connected to the DR21 filament, the most massive one, F3, being clearly linked to the DR21(OH) clump.
-
•
Global infall signatures are seen all across the filament (on a length scale of a few pc).
-
•
The highest values of the velocity dispersion are found in a vertical projected region of low column density gas, offset from the dense clumps seen in N2H+.
-
•
Three horizontal (west-east) velocity gradients (–0.8, +2.2, +2.3 km s-1 pc-1) exist in the filament.
All of these findings point towards a very dynamic nature of the DR21 filament in which motions are not randomly distributed but show clear signs of systematic dynamics. These features all point to local converging flows being the driving source of the whole filament, with an increase in density at the stagnation points of the flows (Sect. 6.1). In addition, the large-scale infall signatures observed all over the filament point towards a scenario in which gravity is the dominant driving force on the scale of the filament (Sects. 6.2 and 6.3). On the other hand, the origin of the large-scale flows is difficult to constrain. It is possible that the large-scale dynamics are a remains of the formation process of the molecular complex, but may also originate either from self-gravity on larger scales, or large-scale turbulence injection (Sects. 6.4 and 6.5).
6.1 Organized motions: signposts of convergent flows
The clouds of the whole Cygnus North region are very similar in their physical properties (morphology, density etc.) to clouds that were created by colliding flow scenarios in models (e.g. the final stage of the Gf2 model from Heitsch & Hartmann heitschhart2008 (2008)). The DR21 filament is part of a complex network of interconnected filamentary structures (Sec. 4.1) and could thus indeed be the result of a convergent, turbulent flow. In particular, the offset of the infall speed from the densest regions is consistent with a scenario where supersonic flows shock at their stagnation points are offset from the dense postshock gas on both sides of the filament. In this case, high-density clumps/cores are built up at the stagnation points of the colliding flow and would explain the distribution of the dense mm-cores along the DR21 filament. It suggests that the cores are dynamically distributed through the region before they evolve into intermediate or high-mass star-forming clusters. From the mm-continuum survey of Motte et al. (motte2007 (2007)), we determined that approximately 15% of the mass of the filament is contained in dense cores, in accordance with the predictions of Heitsch & Hartmann (heitschhart2008 (2008)).
Another observational results that agrees with supersonic isothermal simulations is the velocity field and the distribution of the velocity dispersion (). We observe different velocity gradients along the filament. Figure 19 shows in the northern and southern part of the filament a negative gradient in the WE-direction whereas at the position of DR21(OH) (where the subfilament falls onto the densest region), this gradient is reversed. It is unlikely that the gradients are only caused by rotation (see, e.g. Goodman et al. goodman1993 (1993) for typical observational signatures of uniform rotation). Moreover, they can be explained in the turbulent colliding flow view, where clumps are sheared and compressed due to the flow motions and retain the signature of the external flow that formed them (Ballesteros-Paredes et al. ball1999 (1999), Vazquez-Semadeni et al. vaz2008 (2008)) so that only parts of the filaments are rotating.
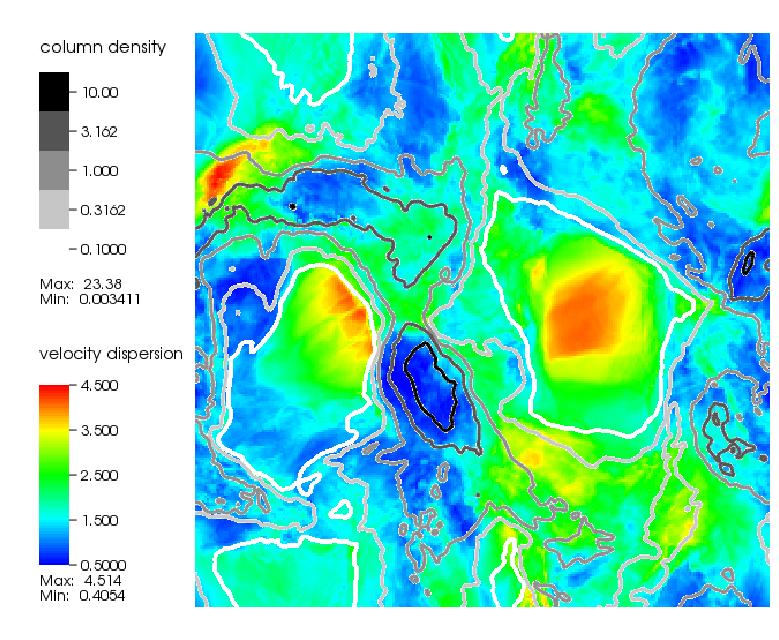
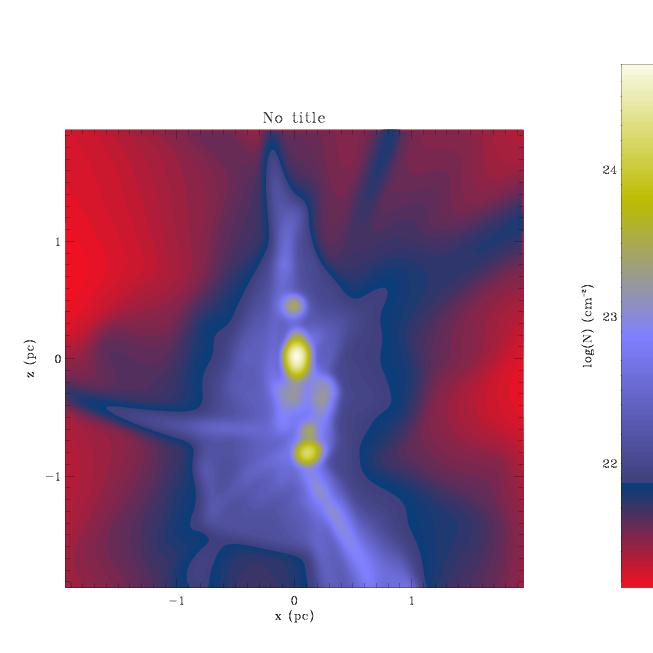
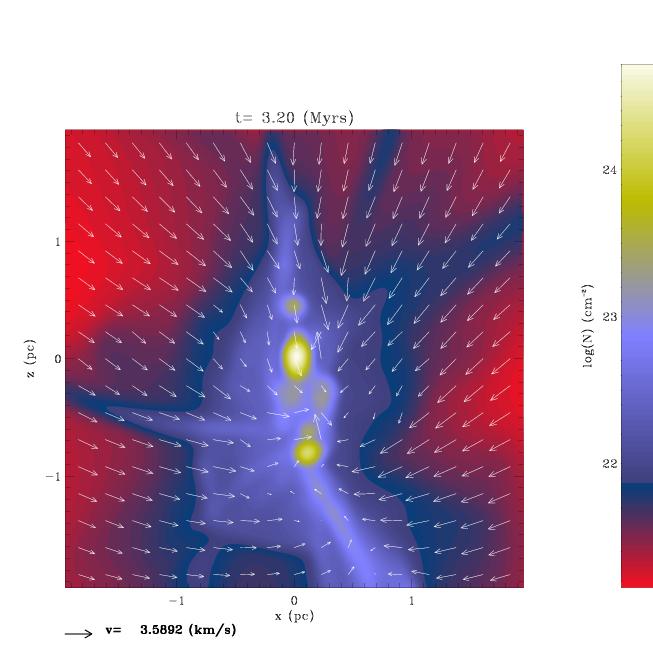
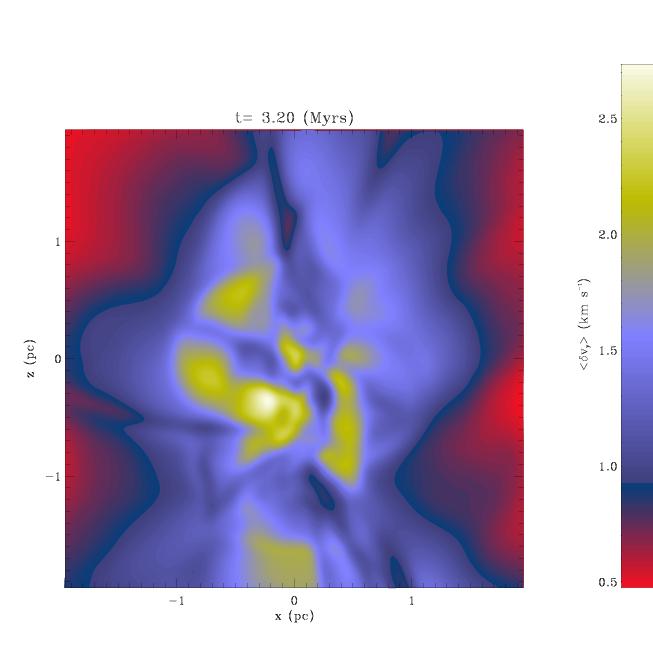
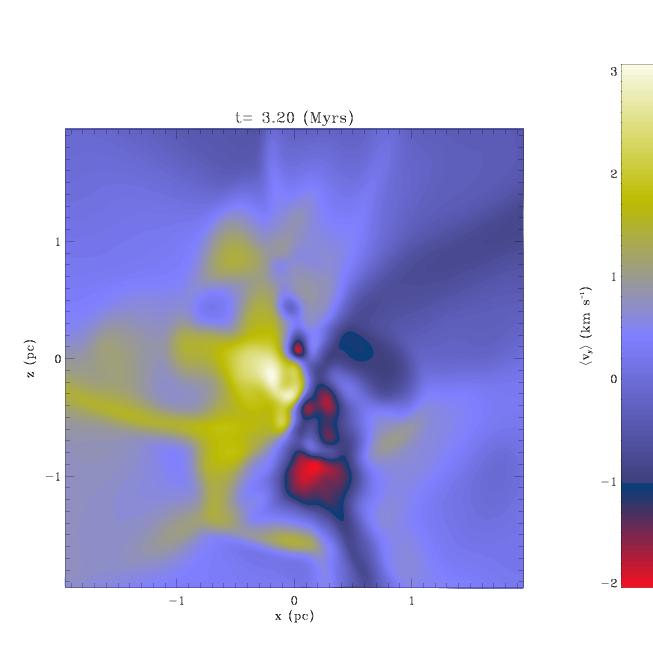
The shock front created by the colliding flows creates an inner dense post-shock region and an outer lower-density region of supersonic inflow. Cores are then formed by ’gravoturbulent fragmentation’ (Klessen et al. klessen2005 (2005), Hennebelle & Chabrier hennebelle2008c (2008)), which characterizes a hierarchy of smaller and smaller entities. The local collapse of a core occurs when self-gravity overcomes the gas pressure (including the turbulent contribution to pressure). The whole process leads to a higher velocity dispersion outside the clump/core than in the more quiescent post-shocked interior (Klessen et al. klessen2005 (2005), Gomez et al. gomez2007 (2007), Vazquez-Semadeni et al. vaz2008 (2008)), which is precisely what we observe in the DR21 filament. Figure 1 in Klessen et al. (klessen2005 (2005)) illustrates this scenario in a non-magnetic SPH (smoothed particle hydrodynamics) model. Here, we provide evidence of the same scenario in Fig. 20, where we show a map of the velocity dispersion obtained in a driven turbulence simulation by Federrath et al. (fed2009 (2009)). The simulation used fully compressive (curl-free) forcing to excite turbulent motions, though models with solenodial (divergence-free) forcing (not shown here) produce similar results. In general, compressive forcing produces greater density contrasts with higher density enhancements and larger voids than solenodial forcing (Federrath et al. fed2008 (2008), fed2009 (2009)). This could be the case for the DR21 filament since it is here where we observe the massive dense cores with densities higher than 105 cm-3 and masses up to 200 M⊙. The velocity field primarily consists of converging flows, which create strong density enhancements. Column density contours are overlaid on the velocity dispersion, showing that and density peaks are offset from one another, as in our observations shown in Fig. 15 (middle panel) of the DR21 filament. High density gas is primarily found in regions of low , while lower density regions have higher . We emphasise that the simulation did not include self-gravity. Nevertheless, the velocity dispersion–density structure is similar to what is observed in the DR21 filament, which indicates that the observed structures can be produced by converging supersonic gas flows only, without the necessity of a global gravitational collapse. However, converging gas flows are also created by global collapse. If supersonic flows and global collapse act simultaneously, it is difficult to disentangle their individual contribution to the creation of the velocity dispersion–density structure seen in our observations and in the simulations (see Sect. 6.5 below for a general discussion of the origin of converging flows).
6.2 Self-gravity, the main driving force in the DR21 filament?
Observationally, the ubiquity of the blue-shifted asymmetric line profiles in all optically thick lines indicates inflow motions. This is a strong hint that self-gravitation plays a significant role for the dense and massive DR21 filament. In addition, the most massive sub-filament F3, which is a good candidate to flow towards the main filament, seems to bend towards the center of the largest gravitation well of the whole filament, the DR21(OH) clump (see Sect. 5.1). This bend may be indicative of a dominant role of gravity as the flowing material approaches the main filament. At larger distances, the effect of large-scale magnetic fields could be the cause that keeps it in an almost east-west direction (see Sect. 6.3).
As shown in Sect. 6.1, we are able to explain the spatial displacement between the maximum of the velocity dispersion and the dense gas and the velocity field of the DR21 filament in the context of supersonic isothermal simulations that do not include self-gravity. However, models of isothermal, non-magnetic, but self-gravitating turbulence produce a velocity divergence of typically 0.6 km s-1 pc-1 for a 1 pc region (Vazquez-Semadeni et al. vaz2008 (2008)). The authors propose that the assumption that the velocity dispersion is produced only by random motion is incomplete and that even in the presence of driven turbulence a part of the observed velocity dispersion is caused by clump-scale inward motions due to gravitational collapse. In this large-scale inflow (LSI) scenario, the velocity field on all scales includes a significant inflow component.
6.3 Role of magnetic field: MHD with self-gravity modeling
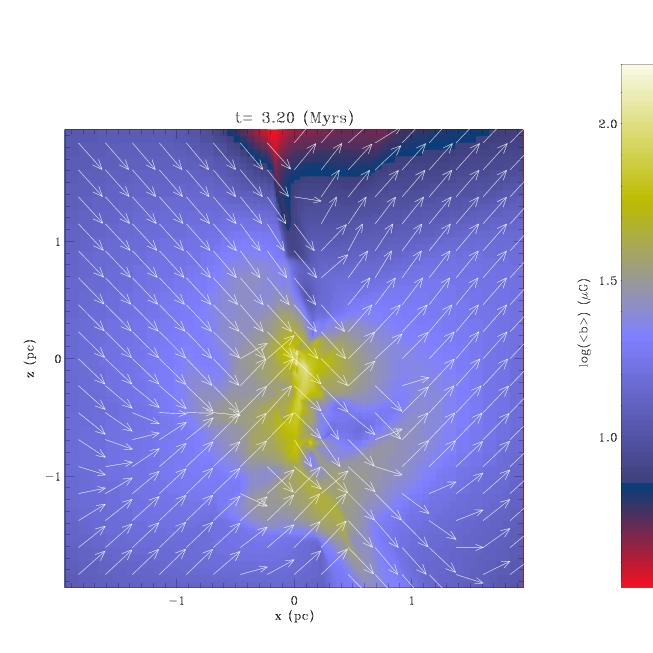
We observed several sub-filaments that are attached to the DR21 filament (Sects. 4.2). The orientation of the sub-filaments is not arbitrary: they follow the magnetic field lines that run orthogonal to the NS-orientated DR21 filament (Vallée & Fiege vallee2006 (2006), Kirby kirby2009 (2009)). Magnetohydrodynamic turbulence models precisely produce such filamentary structures (Fig. 21) that are aligned with the magnetic field (Fig. 22). Hennebelle & Audit (hennebelle2008b (2008)) found that self-gravitating MHD models produce more filamentary structures than purely hydrodynamic models. These numerical simulations were specifically designed for this object and the initial conditions resemble those used in Peretto et al. (peretto2007 (2007)). They consist of an elongated clump with an initial aspect ratio of 2 and a density profile , where , , pc and cm-3. The density at the edge of the cloud is equal to 50 cm-3 and is 10 times lower than the value outside the cloud. Turbulence is seeded initially in such a way that the clump is approximately in virial equilibrium. The initial temperature is 10 K and the clump is threaded by a magnetic field parallel to the x-axis. Its intensity is proportional to the cloud column density and the peak value is about 7 G making the magnetic energy about 4 times lower than the turbulent one and 5 times higher than the thermal energy. This simple initial configuration for the magnetic field is suggested by the observations of Vallée & Fiege (vallee2006 (2006)), who show that the magnetic field is indeed perpendicular to the major axis of DR21. The simulation was performed with the Ramses code (Teyssier teyssier2002 (2002), Fromang et al. fromang2006 (2006)). Since the cloud occupies a small fraction (about 5 percent) of the computational domain, the following strategy is adopted. Initially a uniform 1283 computational grid is used (level 7). Then, all the cells of density above 10 cm-3 and 40 cm-3 are refined to the level 8 and 9, respectively. This ensures that initially the clump is described with about computing cells. As the collapse proceeds, the resolution is adjusted requiring at least 10 cells per Jeans length up to level 14.
In the left-hand panel of Fig. 21, the distribution of the column density is shown and in the right-hand figure panel, the velocity field vectors are overlaid on top. The column density is smoothed to a beam of 0.1 pc angular resolution (that of the IRAM 30m molecular line observations). The resemblance to the DR21 filament is evident with an elongated vertical main filament and several subfilaments attached to it. Several clumps/cores (size scales 0.5 pc) with high H2 column densities (1024 cm-2) have formed in the filament, in agreement with our observations.
Figure 22 shows the mean velocity dispersion, the mean velocity field along the line of sight, and the averaged magnetic field. For the velocity dispersion , we observe the same offset between regions of high density and as seen in Fig. 20. The modeled velocity field is as inhomogenous as the observed one, though the gradients have slightly larger values (up to a few km s-1 pc-1) and the same direction (no turn in sign as we found for the region around the DR21(OH) clump). The magnetic field is particularly interesting. The total magnetic intensity is displayed in Fig. 22 (bottom), the arrows showing the direction of the magnetic field in the xz plane. The sub-filaments are clearly aligned along the magnetic field and even sometimes pinched by it. This is in full accordance with our observations and points toward a scenario in which the DR21 filament is fed with material along EW- orientated magnetic field lines. A full network of these subfilaments was detected in recent JCMT 12CO 32 data (Richer et al., in prep.). A more detailed discussion of these observations and MHD modelling will be presented in a forthcoming paper (Csengeri, Hennebelle et al., in prep.).
However, the prinicipal driver of these flows remains unclear. Is it external, large-scale driven turbulence or the gravitational attraction of the gas itself, or both? A possible scenario is that first, the turbulence creates the density fluctuations (clumps and filaments) by means of locally convergent flows, and then, for some of the more massive fluctuations,gravity takes over, making the inflow stronger and driving the material to higher densities. We probably see both effects in the DR21 filament: turbulent compression and self-gravity. The northern part is probably in an earlier stage where the external flow is still important in shaping the velocity field (hence the offset of the 1st and 2nd velocity moments from the density map). In the southern part, we see a more advanced stage in which gravity dominates and gravitational infall extends all the way to the center (leading to the coincidence of the density and velocity structures).
6.4 Are the observed sub-filaments able to maintain the formation of the DR21 filament?
We observed that several sub-filaments are attached to the DR21 filament (Sect. 4.2), possibly serving as a reservoir of gas for further mass growth. These organized flows help to sustain high accretion rates for times long enough to build up very massive clumps/cores (Vazquez-Semadeni et al. vaz2009 (2009)). We note that the DR21(OH)-clump has a mass of higher than 5000 M⊙ in a radius of 0.5 pc, which makes it one of the most massive clumps known in the Galaxy. The F3-filament (Sect. 5.1) has an average mass input rate of 1.910-3 M⊙ yr-1 so that it may contribute up to % of the total mass infall rate of 5.810-3 M⊙ yr-1 observed for the DR21(OH) clump as a whole (Clump 14, see Table 3) for the next 2.1106 yr. Accounting for the other less massive sub-filaments, which may also contribute, this indicates that the mass flow rates are of the correct order of magnitude to explain the formation of the DR21 filament. On the other hand, they seem insufficient to build the present 5000 M⊙ DR21(OH) clump, which suggests that the mass flow rate must have been higher in the past and that the process that produced the DR21 filament may be declining.
6.5 Origin of the converging flows that formed the DR21 filament
One physical scenario that intrinsically includes strong dynamics is that of molecular clouds and complexes being formed by large-scale HI convergent flows, which would then drive the whole dynamics of the complex down to the star-formation scale (Klessen et al. klessen1998 (1998), Folini & Walder folini2006 (2006), Vazquez-Semadeni et al. vaz2007 (2007), Heitsch et al. heitsch2008 (2008), Banerjee et al. banerjee2009 (2009), Federrath et al. fed2009 (2009)). Common for all ’convergent-flow’ scenarios is the basic principle that the clouds result from a pileup of material, i.e. atomic hydrogen, from large-scale supersonic flows, caused by energetic events such as supernovae, expanding HII-regions, galactic spiral density waves. The driving force could be the injection of supersonic turbulence on large scales in a pre-existing molecular complex. Supersonic turbulence necessarily leads to organized supersonic motions on smaller scales, and then leads to the formation of filaments and clumps, and then stars. Finally, the self-gravity of a pre-existing molecular complex may play a role in driving the flows. Altogether, it is difficult to trace back the origin of the large-scale motions observed here. But at least on the observed scales, the motions are supersonic and are converging to form dense structures such as the DR21 filament. Whether a more quasi-static evolution is possible on smaller scales or in other parts of the complex to drive the evolution towards (high-mass) star formation cannot be addressed by the present observations. In Csengeri et al. (csengeri2010 (2010)), we address the kinematic state of the small scale, densest structures in the complex, the i.e., massive dense cores, using PdBI data (Csengeri et al. in prep).
To distinguish the formation scenarios more clarly on large scales, it is not clear which other observational signatures can be expected. The DR21 filament itself is already a rather dense structure and in order to detect residues of the formation process, it is neccessary to inspect the distribution of low-density, subsonic gas using atomic hydrogen and low-density tracers such as 12CO. We will address this point in a subsequent paper (Csengeri, Hennebelle et al., in prep.).
7 Summary and conclusions
We have presented a detailed molecular line study of the molecular ridge containing the star-forming regions DR21 and DR21(OH). This ridge is embedded in a large-scale network of filamentary structures, revealed by our maps of 13CO 10, CS 21, and N2H+ 10 emission obtained with the FCRAO. It is the most massive (around 30 000 M⊙) and dense (average density 104 cm-3) filament within the region and is labeled by us the ’DR21 filament’. Several sub-filaments are linked to the DR21 filament, the most massive one runs orthogonal to the North-South oriented ridge and has a mass (determined from 13CO 10) of 2600 M⊙ and an average density of 690 cm-3. Its inferred dynamical time is 2106 yr.
Higher angular resolution IRAM molecular line observations in HCO+, H13CO+, 12CO/13CO 21, C34S, N2H+, and H2CO resolve the detailed structure of the DR21 filalment. The H13CO+ 10 data show how the sub-filament seen in 13CO connects directly to the DR21(OH) clump. From the 12CO 21 line mapping, we confirmed the known outflow sources DR21 and DR21(OH) and detected three new ones, correlated with the mm-continuum sources N53, N44, and N45 (Motte et al. motte2007 (2007)). The HCO+ 10 line shows self-absorbed lines across the whole filament. Since optically thin lines peak in the gap and the blue wing of HCO+ is more intense than the red one, we conclude that this emission feature is due to infalling gas. The typical infall speed, determined with a simple method described in Myers et al. (myers1996 (1996)), is 0.6–0.8 km s-1. A more sophisicated non-LTE modelling of the HCO+ and H13CO+ lines using the Simline radiative transfer code yields an infall speed of 0.5 and 0.6 km s-1 for the northern and southern part of the DR21 filament (but excluding the DR21 region itself), respectively.
The kinematic structure of the DR21 filament is remarkable. We measured, using the N2H+, H13CO+, and HCO+ maps, the highest values of the velocity dispersion in a vertical column of low column density gas that is offset from the dense clumps seen in N2H+. These results can be explained if the filament was produced by turbulent flows. In this case, the densest gas has been shocked and slowed down so that the largest velocity dispersions do occur not in the densest regions but in the outskirts (Klessen et al. klessen2005 (2005), Vazquez-Semadeni et al. vaz2008 (2008)). We also observe three horizontal (west-east) velocity gradients (–0.8, –2.2, +2.3 km s-1 pc-1) in the filament in which the one with the positive value marks the location where the filament is ’falling’ onto the DR21(OH) clump. This velocity pattern cannot be explained by a single rotation of the filament along a vertical axis. An alternative explanation would be that at least part of the observed motions is due to convergent flows.
By comparing our observations of the DR21 filament with a hydrodynamic (Federrath et al. fed2009 (2009)) and a magneto-hydrodynamic turbulence model (Hennebelle et al., Teyssier teyssier2002 (2002), Fromang et al. fromang2006 (2006)), we infer that a very dynamic and fast mode of star formation occurs in the filament, in which gas is continuously replenished by subfilaments attached to the main filament. These subfilaments are aligned with the magnetic field direction that is perpendicular to the DR21 filament (Vallee & Fiege vallee2006 (2006)). The DR21 filament is globally collapsing. All our observational findings are incompatible with the view of a quasi-static, pressure-bounded clump scenario.
Acknowledgements.
We thank A. Belloche and D. Poelman for useful discussions on line radiative transfer modelling.A part of this work was supported by the French Agence National de la Recherche (ANR) project PROBeS No. 08-blanc-0241. T. Csengeri acknowledges support from the FP6 Marie-Curie Research Training Network ’Constellation: the origin of stellar masses’ (MRTN-CT-2006-035890).
R.S.K. acknowledges financial support from the German Bundesministerium für Bildung und Forschung via the ASTRONET project STAR FORMAT (grant 05A09VHA) and from the Deutsche Forschungsgemeinschaft (DFG) under grants no. KL 1358/1, KL 1358/4, KL 1359/5, KL 1358/10, and KL 1358/11. R.S.K. furthermore thanks for subsidies from a Frontier grant of Heidelberg University sponsored by the German Excellence Initiative and for support from the Landesstiftung Baden-Württemberg via their program International Collaboration II (grant P-LS-SPII/18). R.S.K. also thanks the KIPAC at Stanford University and the Department of Astronomy and Astrophysics at the University of California at Santa Cruz for their warm hospitality during a sabbatical stay in spring 2010.
Appendix A Calculation of physical parameters
A.1 Abundances
We use a standard [12CO]/[13CO] ratio of 67 (Lucas et al. lucas1998 (1998)).
The [HCO+]/[H2] abundance in high-mass star-forming regions is typically quoted to be 1.5–2.5 10-9 (Peretto et al. peretto2006 (2006), Marseille et al. marseille2008 (2008)). For our mass determination from H13CO+, we apply the abundance value obtained from the Simline modelling (Sect. 5.3), which is 2.5 10-9.
A.2 Determination of mass from molecular lines
The total column density of any optically thin molecule can be determined from
where
and the Partition function is given by
| (4) |
in which and denote the Planck and the Boltzman constants, respectively, is the frequency [GHz], is the dipole moment [Debye], is the upper value of the rotational quantum number and is the velocity integrated line intensity on a main beam temperature scale
| (5) |
and .
The values for the H13CO+ 10 transition are =86.75433 GHz, h/k=4.163 K, =3.3 Debye, =1, and =1.13. The temperature-dependent factor f(Tex) is (2.43, 2.84, 4.39, 9.4)1012 for 10, 20, 40, and 100 K, respectively.
The values for the 13CO 10 transition are =110.201 GHz,
h/k=5.29 K, =0.112 Debye, =1, and =0.868. The
temperature-dependent factor f(Tex) is
(0.91,1.25,1.66,2.08)1015 for 10, 20, 30, and 40 K, respectively.
The H2 column density from H13CO+ is calculated to be
and for 13CO 10 from
The final mass is determined to be
where the projected area is in square degrees, the distance in parsec, the mass of hydrogen mH, and =1.36.
References
- (1) Adler, D.S., Lo, K.Y., Wright, M.C.H. et al., 1992, ApJ, 392, 497
- (2) Audit, E., Hennebelle, P., 2009, A&A in press, arXiv:0911.0748
- (3) Ballesteros-Paredes, J., Vazquez-Semadeni, E., Scalo, J., 1999, ApJ, 512, 286
- (4) Ballesteros-Paredes, J., Klessen, R., Vazquez-Semadeni, E., Scalo, J., 2003, ApJ, 592, 188
- (5) Banerjee, R., Pudritz, R.E., 2007, ApJ, 660, 470
- (6) Banerjee, R., Vazquez-Semadeni, E., Hennebelle P., Klessen, R.S., 2009, MNRAS, 398, 1082
- (7) Bate, M., 2009, MNRAS, 392, 1363
- (8) Batrla, W., Menten, K.M., 1988, ApJ, 329, L117
- (9) Bieging, J.H., Wilson, T.L., Downes, D., 1982, A&AS, 49, 607
- (10) Bontemps, S., Motte, F., Csengeri, T., Schneider, N., 2010, A&A submitted, arXiv:0909.2315
- (11) Bonnell I., & Bate M., 2006, MNRAS 370, 488
- (12) Brunt, C.M., 2003, ApJ, 583, 280
- (13) Chandler, C.J., Gear, W.K., Chini, R., 1993, MNRAS, 260, 337
- (14) Csengeri, T., Bontemps, S., Schneider, N., et al., submitted to A&A
- (15) Davis, C.J., Kumar, M.S.N., Sandell, G., et al., 2007, MNRAS, 374, 29
- (16) Dickel, H.R., & Wendker, H.J., 1978, A&A, 66, 289
- (17) Dickel, J.R., Dickel, H.R., & Wilson, W.J., 1978, ApJ, 223, 840
- (18) Downes, D., & Rinehart, R., 1966, ApJ, 144, 937
- (19) Federrath, C., Klessen, R., Schmidt, W., 2008, ApJ, 688, L79
- (20) Federrath, C., Roman-Duval, J., Klessen, R., Schmidt, W., & Mac Low, M.-M., 2009, A&A accepted, arXiv:0905.1060
- (21) Folini, D., Walder, R., 2006, A&A, 459, 1
- (22) Fromang, S., Hennebelle, P., Teyssier, R., 2006, A&A, 457, 371
- (23) Garden, R.P., Geballe, T.R., Gatley, I., et al., 1991, ApJ, 366, 474
- (24) Garden, R.P., Hayashi, M., Gatley, I., et al., 1991, ApJ, 374, 540
- (25) Garden, R.P., & Carlstrom, J.E., 1992, ApJ, 392, 602
- (26) Genzel, R., Downes, D., 1977, A&AS, 30, 145
- (27) Goldreich, P, Kwan, J., 1974, ApJ, 189, 441
- (28) Gomez, G.C., Vazquez-Semadeni, E., Shadmehri, M., Ballesteros-Paredes, J., 2007, ApJ, 669, 1042
- (29) Goodman, A.A., Benson, P.J., Fuller, G.A., Myers, P.C., 1993, ApJ, 406, 528
- (30) Harris, S., 1973, MNRAS, 162, 5P
- (31) Heitsch, F., Hartmann, L.W., 2008, ApJ 689, 290
- (32) Heitsch, F., Hartmann, L.W., Slyz, A.D. et al., 2008, ApJ 674, 316
- (33) Hennebelle, P., Audit, E., 2007, A&A, 465, 431
- (34) Hennebelle, P., Teyssier, R., 2008, A&A, 477, 25
- (35) Hennebelle, P., Banerjee, R., Vazquez-Semadeni, E., Klessen, R., Audit, E., 2008, 486, L43
- (36) Hennebelle, P., Chabrier, G., 2008, ApJ, 684, 395
- (37) Hora, J., Bontemps, Megeath, T., Schneider, N., et al., 2009, AAS 213, 356.01, vol. 41, p.498
- (38) Jakob, H., Kramer, C., Simon, R., Schneider, N., Ossenkopf, V., Bontemps, S., et al., 2007, A&A, 461, 999
- (39) Kirby, L., 2009, ApJ, 694, 1056
- (40) Klessen, R.S., Burkert, A., Bate, M.R.,1998, ApJ, 501, 205
- (41) Klessen, R.S., Heitsch, F., Mac Low, M.-M., 2000, ApJ, 535, 887
- (42) Klessen, R.S., 2001, ApJ, 550, L77
- (43) Klessen, R.S., Ballesteros-Paredes, J., Vazquez-Semadeni, E., et al., 2005, ApJ, 620, 786
- (44) Klessen, R.S., Hennebelle, P., 2010, submitted to A&A, arXiv:0912.0288
- (45) Knödlseder, J., 2000, A&A, 360, 539
- (46) Kumar, M.S.N., Davis, C.J., Grave, J.M.C., et al., 2007, MNRAS, 374, 54
- (47) Krumholz, M., McKee, C.F., Klein, R.I., 2005, ApJ, 618, L33
- (48) Krumholz, M., 2006, ApJ, 641, L45
- (49) Lee, J.E., Evans, N.J., Shirley, Y.L., 2003, ApJ, 583, 789
- (50) Lucas, R., Liszt, H., 1998, A&A, 337, 246
- (51) Mac Low, M.-M., Klessen, R., 2004, Reviews of Modern Physics, vol.76, Issue 1, 125-194
- (52) Mangum, J.G., Wooten, A., Mundy, L.G., 1991, ApJ, 378, 576
- (53) Mangum, J.G., Wooten, A., Mundy, L.G., 1992, ApJ, 388, 467
- (54) Marseille, M., Bontemps, S., van der Tak, F., Herpin, F., Purcell,C.R., 2008, A&A, 488, 579
- (55) Marston, A.P., Reach, W.T., Noriega-Crispo, A., et al., 2004, ApJS, 154, 333
- (56) Mauersberger, R., Henkel, C., Wilson, T.L., Walmsley, C.M., 1986, A&A, 162, 199
- (57) McKee, C., Tan, J., 2003, ApJ, 585, 850
- (58) McKee, C.F., Ostriker, E.C., 2007, Annu.Rev.Astron.Astrophys. 45, 565
- (59) Motte, F., Schilke P., Lis, D., 2003, ApJ, 582, 277
- (60) Motte, F., Bontemps, S., Schilke P., Schneider, N., Menten, K., 2007, A&A, 476, 1243
- (61) Myers, P.C., Mardones, M., Tafalla, M., et al., 1996, ApJ, 465,L133
- (62) Myers, P.C., 2009, ApJ, 700, 1609
- (63) Norris, R.P., Booth, R.S., Diamond, P.J., Porter, N.D., 1982, MNRAS, 201, 191
- (64) Nyman, L.A., 1983, 120, 307
- (65) Ossenkopf, V., Trojan, C., Stutzki, J., 2001, A&A, 378, 608
- (66) Padoan, P., Nordlund, A. 2002, ApJ, 576, 870
- (67) Peretto, N., André, P., Belloche, A., 2006, A&A, 445, 979
- (68) Peretto, N., Hennebelle, P., André, P., 2007, A&A, 464, 983
- (69) Peters, T., Banerjee, R., Klessen, R., et al., 2010, ApJ, 711, 1017
- (70) Plambeck, R.L., & Menten, K., 1990, ApJ, 364, 555
- (71) Reipurth, B., Schneider, N., 2008, Handbook of star forming regions, ASP
- (72) Richardson, K.J., Sandell, G., Cunningham, C.T., et al., 1994, A&A, 286, 555
- (73) Russell, A.P.G., Bally, J., Padman,R., Hills, R.E., 1992, ApJ, 387, 219
- (74) Schneider, N., Bontemps, S., Simon, R., Jakob, H., Motte, F., Miller, M., Kramer, C., Stutzki, J., 2006, A&A, 458, 855
- (75) Schneider, N., Simon, R., Bontemps, S., Comerón, F., Motte, F., 2007, A&A, 474, 873
- (76) Schneider, N., Bontemps, S., Simon, R., et al., 2010, submitted to A&A, arXiv:1001.2453
- (77) Shepherd, D.S., Kurtz, S.E., Testi, L., 2004, ApJ, 601, 952
- (78) Tafalla, M., Myers, P.C., Caselli, P., Walmsley, C.M., Comito, C., 2002, ApJ, 569, 815
- (79) Teyssier, R., 2002, A&A, 385, 337
- (80) Vallée, J.P. & Fiege, J.D., 2006, ApJ, 636, 332
- (81) Vazquez-Semadeni, E., Shadmehri, M., Ballesteros-Paredes, J., 2002, sub. to ApJ, arXiv:0208245
- (82) Vazquez-Semadeni, E., Gomez, G.C., Jappsen, A.K.,et al., 2007, ApJ, 657, 870
- (83) Vazquez-Semadeni, E., Gonzales, R.F., Ballesteros-Paredes, J., et al., 2008, MNRAS, 390, 769
- (84) Vazquez-Semadeni, E., Gomez, G.C., Jappsen, A.K.,et al., 2009, ApJ, 707, 1023
- (85) Wilson, T.L. & Mauersberger, R. 1990, A&A, 239, 305
- (86) Wienen, M., 2008, Diplomarbeit, University of Bonn
- (87) Yorke, H.W., Sonnhalter, C., 2002, ApJ, 569, 846