Effects of a radially varying electrical conductivity on 3D numerical dynamos
Abstract
The transition from liquid metal to silicate rock in the cores of the terrestrial planets is likely to be accompanied by a gradient in the composition of the outer core liquid. The electrical conductivity of a volatile enriched liquid alloy can be substantially lower than a light-element-depleted fluid found close to the inner core boundary. In this paper, we investigate the effect of radially variable electrical conductivity on planetary dynamo action using an electrical conductivity that decreases exponentially as a function of radius. We find that numerical solutions with continuous, radially outward decreasing electrical conductivity profiles result in strongly modified flow and magnetic field dynamics, compared to solutions with homogeneous electrical conductivity. The force balances at the top of the simulated fluid determine the overall character of the flow. The relationship between Coriolis and Lorentz forces near the outer boundary controls the flow and magnetic field intensity and morphology of the system. Our results imply that a low conductivity layer near the top of Mercury’s liquid outer core is consistent with its weak magnetic field.
keywords:
Variable electrical conductivity , numerical dynamos , Geodynamo , Mercury1 Introduction
Variations in the physical properties of fluids in planetary dynamos define the character of the observed intrinsic magnetic field (e.g., strength, geometry and time variability). Changes in the electrical conductivity of the fluid as a function of depth may become relevant in the context of terrestrial and gas giant planets. In this paper we explore (with a focus on the terrestrial planets) how the radial variation of electrical conductivity in planetary cores may result in changes to dynamo-generated magnetic fields.
1.1 Terrestrial planets
The cores of the terrestrial planets are composed principally of iron, with minor but significant amounts of nickel and lighter elements. It has long been known that an iron-nickel core would have too high a density to be compatible with Earth’s moment of inertia and seismic data (e.g., Birch, 1952; Poirier, 1994). A compatible Earth core density model can result from the inclusion of about 8% by weight of one or more light elements. Detailed models of core composition are based primarily on the constraints of seismology, mineral physics, geochemistry, metallurgy, and cosmochemisty. Silicon, sulphur and oxygen are the primary candidates for the light elements. Sulphur is likely to be a significant component but the depletion of light elements in the process of accretion in the inner solar system limits sulphur to about 2 wt% in the core.
Recent reviews of core differentiation and composition distinguish between models considering Silicon versus those considering Oxygen as the primary light element. Composition models give weight percents of Fe 85%-88%, Ni 5% Si 0-7%, O 0-4% and S 2% (e.g McDonough, 2003; Wood et al., 2006). Solidification of a more or less pure iron-nickel inner core may exclude the lighter elements, which would then be enriched in the outer core. The ratio of the inner core radius (1221 km) to the core radius (3480 km) is 0.35 and the mass of the inner core is only about 5% of the total core mass. So the bulk composition of the outer core is only slightly different than that of the whole core.
Convection in the liquid outer core is driven by a combination of compositional and/or thermal buoyancy. Thermal buoyancy available to drive convection and dynamo action originates primarily from the latent heat of solidification at the inner core boundary (ICB) and possibly from cooling at the core-mantle boundary (CMB). Secular cooling at the CMB does not guarantee a source of convective instability since heat can be conducted through a stably stratified layer (a super-adiabatic heat flux is needed). Compositional buoyancy originates at the ICB due to light element enrichment in the residual liquid associated with inner core solidification. A source of compositional buoyancy near the CMB could come from precipitation from a silicate enriched layer at the top of the core, leaving a light element depleted, heavy residual liquid and a silicate sediment layer at the CMB (Buffett et al., 2000).
Temperature and pressure dependence of electrical conductivity may lead to sizable variations with depth. (Stacey and Anderson, 2001). Assuming a well-mixed outer core and a Si concentration of in a dual species alloy, the authors found the most extreme variation in the fluid core of Earth results in a factor of 1/2 difference for the electrical conductivity and about 3/4 for the thermal conductivity from the ICB to the CMB. Although the effects of different impurities in the alloy have not been explored experimentally, Stacey and Anderson (2001) argue that the effects of impurities other than Si do not significantly change their estimates. A later revision (Stacey and Loper, 2007) found that the variation in electrical and thermal conductivities had been overestimated due to the assumption of treating Fe as an electronically simple metal. Their later results predict a difference in the electrical conductivity of a factor of 0.78 between that of the CMB when compared to the ICB’s. Those estimates were made under the assumption of a well-mixed outer core. However gradients in material properties would be amplified in a compositionally stratified layer.
The existence of a thermally and/or compositionally stably stratified layer near the top of the Earth’s core has been both, suggested and argued (Jacobs, 1975; Fearn and Loper, 1981; Lister and Buffett, 1998; Braginsky, 1993, 2007). Here we will focus on the possibility of a compositionally stratified layer near the top of the core since the electrical conductivity in such a layer would decrease with radius (due to the higher light-element concentration when compared to the bottom of the fluid core). Two mechanisms by which a compositionally stratified layer can grow are by chemical diffusion from the mantle directly to the top of the core (Lister and Buffett, 1998) and by buoyant transport of light element enriched residual liquid from inner core solidification (Moffatt and Loper, 1994). Chemical diffusion is a slow process and would not result in a layer thickness greater than about 10 km (Lister and Buffett, 1998). On the other hand, buoyant rise of light element rich residual liquid could be an efficient process to build a layer of greater thickness. A thick layer with a significantly anomalous density would likely be detected as a seismically fast layer. Seismological constraints have been so far inconclusive. However, recent seismological results using outermost core waveforms seem to be consistent with the existence of a low density layer of about 100 km thickness (Alexandrakis and Eaton, 2007; Tanaka, 2007)
It has been confirmed that Mercury has a liquid iron core (Margot et al., 2007). Furthermore, it is likely that Mercury’s weak intrinsic magnetic field is generated by a dynamo in its liquid outer core. Neither the details of Mercury’s core composition, nor the size of its inner core is known (Hauck et al., 2004; Solomon et al., 2008; Heimpel and Kabin, 2008). Observations of Mercury’s contractional lobate crustal faults imply a planetary radial contraction of about 3 km, small compared to an estimated 17 km of contraction that would result from a completely solidified core. This implies that Mercury may have a relatively large outer core, perhaps earth-like proportion. For a thick-shell outer core to exist in Mercury, given its small size, Hauck et al. (2004) estimates that the light elements (such as S or Si) in the core have a relatively high concentration. This suggests the possibility of a large and stratified Hermean outer core with a thick, and stably stratified outermost layer. Such a layer would be compositionally stratified (in contrast to thermally stratified models previously proposed, e.g., Christensen, 2006) with a radial increase in the proportion of a light elements, and a radial decrease in electrical conductivity.
1.2 Gas giant planets
The magnetic field in the gas giants is generated within a metallic hydrogen region. Experimental results have found that the transition from metallic to molecular hydrogen yields a wide range of pressures where the electrical conductivity is non-negligible thus varying slowly with depth in planetary interiors (Nellis, 2000). The internal structure has been deduced to first order based on measurements of the moment of inertia and total mass of each planet (e.g., Guillot, 2005). However, constraints on hydrogen and helium mixtures at high pressures need to be found in order to better determine the internal structure of the gas giants. The additional effect of helium may complicate further the underdetermined internal layering of gas giants (e.g., Stevenson, 2008). The metallic to molecular hydrogen transition is of particular interest from the point of view of the internal dynamics. The depth and radial extent of this transition are important for magnetic field generation and in understanding the observable magnetic field morphology. This is a task for future investigation.
In this paper, we present results from a numerical dynamo model with radially varying electrical conductivity (Gómez-Pérez, 2007). To implement the radially variable conductivity, we modified an existent numerical code (originally MagIC 2.0, Wicht, 2002), that uses the Boussinesq approximation. We focus this study on the effect of the varying conductivity on the dynamo action, and on the generated magnetic field. With this new implementation we performed a set of tests to analyze its consistency with previously published work. In section 2 we include a review of numerical models that worked with stratified liquids. In section 3 we present the necessary modification to the dynamo equations, and to the numerical code. The parameters explored for twenty runs studied in this paper are included in section 4. We present the results in section 5, the discussion and conclusions are found in section 6 and 7, respectively. We also included a table of symbols in appendix A.
2 Stratified planetary interiors in numerical simulations
The study of planetary and solar dynamos has evolved rapidly in the past two decades due to code development and the accessibility to powerful computers used to solve numerically the equations of motion of rotating fluids. Solutions of numerical dynamos share characteristics with Earth’s dynamo with respect to temporal variability, evolution and mean geometry (e.g., Kageyama et al., 1993; Glatzmaier and Roberts, 1995; Kuang and Bloxham, 1997; Christensen et al., 1998). More recently, numerical models have been successful in reproducing non-dipolar and weak fields such as those observed for the ice giants (e.g., Gómez-Pérez and Heimpel, 2007; Stanley and Bloxham, 2006). Nevertheless, these models of planetary dynamos rely on strong assumptions that do not necessarily represent realistic physical conditions expected for planetary interiors. For example, due to hardware limitations, numerical models cannot simultaneously resolve planetary- and small-scale flow, both of which are prevalent for low viscosity fluids such as liquid iron or metallic hydrogen in a planetary setting.
2.1 Buoyancy stratification
Christensen and Wicht (2008), and Christensen (2006) implemented a stable stratified (non-convecting) layer at the top of the electrical conductive fluid in planetary dynamo models. They showed that small scale magnetic fields, may be generated in the deep interior of the electrically conductive fluid, shielded by a stably stratified layer. This outer layer acts as a filter that mainly damps the rapidly varying small scale components by the magnetic skin effect. They conclude that the axisymmetric field of Saturn and the relatively weak field of Mercury may be explained by a stably stratified layer at the top of the dynamo region. Similarly, Stanley and Mohammadi (2008) using buoyantly stratified fluids, found that zonal winds developed in a stable layer can affect the magnetic field time evolution rendering a secular variation of thermally stratified models inconsistent with Earth’s observed field.
2.2 Density stratification
We discuss briefly the effects of density variation (anelastic versus Boussinesq approximations) in this section, since they are closely linked to those of the electrical conductivity. In order to solve the anelastic dynamo equations numerically, Glatzmaier (1984) used a poloidal and toroidal decomposition for the velocity and magnetic fields (for the decomposition of solenoidal vectors the reader may refer to Chandrasekhar, 1961). This allows for the use of a pseudo-spectral algorithm, which has been extensively used in planetary and solar dynamo simulations (e.g., Glatzmaier, 1984; Dormy et al., 1998; Christensen et al., 1999; Sakuraba and Kono, 1999; Clune et al., 1999). This mathematical approach requires field vectors to be solenoidal (i.e., divergence free) and thus, approximations are used for the continuity equation, , where is the velocity, the density of the fluid and is time. If the time scale of convection is large compared to the time for sound waves to travel across the depth of the shell,then and the anelastic approximation, , is obtained. In addition, if the density changes in the fluid are much smaller than the averaged density, one obtains the Boussinesq approximation, , where the buoyancy is determined by temperature changes exclusively, but the density perturbations with respect to the mean are neglected.
Differences between the results obtained using Boussinesq and anelastic approximations have been compared in the context of magnetic convection in 2D models (Evonuk and Glatzmaier, 2004). They find significant effects due to strong density stratification (about three orders of magnitude variation in density). The length scales of the top and bottom thermal plumes differ due to the compressibility of the liquid. 3D effects on the flow are very significant as well, and although the effect on the density variation is likely to be important in three-dimensional systems, a detailed analysis of density variations in 3D flows needs to be completed.
Anufriev et al. (2005) compared Boussinesq and anelastic approximations analytically and found that they differ in the thermodynamic equations. In the latter, the rate of work to expand or contract the fluid is included in the energy balance, while the Boussinesq treats a thermal balance as the total energy balance. The anelastic approximation takes into account a more complete picture by including cooling or heating done by the flow. They propose a change in the thermal boundary conditions in Boussinesq models in order to allow for a realistic energy balance in the system. This suggestion should be seriously considered in future numerical simulations that use the Boussinesq approximation.
We are not aware of previous numerical simulations that studied the effects of varying electrical conductivities in the context of planetary interiors. Anelastic models of the interior of stars include variations on magnetic and viscous diffusivities, and thermal expansion coefficient changing as a function of background density, (Featherstone et al., 2007; Clune et al., 1999). Their numerical models include high resolution runs, specially targeted for stellar dynamos (e.g., the heat transport throughout the simulated volume is set up to follow hydrogen burning at the deep interior). Here, we study the effects of radially varying electrical conductivity on the flow and on the magnetic field generation in the liquid cores of terrestrial planets.
3 Methodology
3.1 Governing equations
To describe the behavior of an electrically conductive fluid bounded by co-rotating spherical shells, we use the magnetohydrodynamic equations in the frame of the rotating fluid. Consider a spherical shell with inner and outer boundary radii and respectively, rotating with an angular velocity . Using the Boussinesq approximation, these equations are written as:
| (1) | |||||
| (2) | |||||
| (3) | |||||
| (4) |
where and are the velocity and magnetic induction vectors, respectively; is time; and are the temperature and pressure scalars, respectively; is the acceleration of gravity which changes linearly with depth, and is the value of this acceleration at the outer boundary; is the radial unit vector, and is the unit vector in the direction of the angular momentum of the rotating frame. is the normalized magnetic diffusivity, where and are the magnetic diffusivities, in units of m2s-1, of the liquid core as a function of and of the solid inner core respectively.
Equations 1 to 4 are expressed in terms of the following non-dimensional parameters: the Rayleigh number,
| (5) |
where is the thermal expansion coefficient and is the thermal diffusivity. The Ekman number,
| (6) |
which is the ratio between viscous and Coriolis forces in the system. The Prandtl number,
| (7) |
which is the ratio between the viscous and the thermal diffusivities. And a modified magnetic Prandtl number,
| (8) |
which is the ratio between the viscous diffusivity of the fluid and the magnetic diffusivity at the inner boundary, . Note that the magnetic Prandtl number changes as a function of radius, we used the maximum magnetic Prandtl number for the definition of the non-dimensional units used in our numerical model.
The second term in the right hand side of equation 4 may be written as:
| (9) |
in which the variable conductivity modifies the term exclusively.
The magnetic induction equation is modified by the spatial variability of . Since is solenoidal, we define the magnetic field as a function of two scalar potentials (see Chandrasekhar, 1961, Appendix III):
| (10) |
where is the toroidal and the poloidal potential. From this decomposition the time variation of the potentials (Gómez-Pérez, 2007):
| (11) | |||||
| (12) | |||||
where . It is convenient to write the horizontal component of the angular momentum operator as , with . The term in equation 9 introduces a zero order effect of a varying electrical diffusivity, it results on a decrease of the ohmic dissipation with depth, for both, poloidal and toroidal components of the magnetic field. The radial derivative of the diffusivity has a first order effect, involving exclusively the poloidal component. This is controlled by the term in equation 9.
3.2 Radially variable electrical conductivity
The radial change in electrical conductivity, , where is the magnetic permeability of vacuum, is modeled with a piecewise continuous function whose derivative is also continuous. The outermost part decreases exponentially while the interior changes as a power of the radius. One may write the normalized electrical conductivity as:
| (13) |
where is the inner boundary, is the radius where were the electrical conductivity changes from a polynomial to an exponential function, determines how fast the exponential function decreases outside the conductive volume, is chosen to be the value of the normalized conductivity where the functions match, , and (see figure 1).

We choose to implement a continuous differentiable function in order to have an analytical solution for and . This function for the electrical conductivity is chosen to model a layering between an light-element-enriched fluid with a light-element-poor fluid. During the solidification of the core, heavy elements are preferentially deposited on the inner core. As a result, light element enriched liquid rises buoyantly to the top of the outer core, just below the CMB. A more realistic representation of the electrical conductivity variability, and of miscibility of iron and light element enriched iron at high pressures, needs to be studied. From an experimental point of view such measurements are very challenging. First principles numerical simulations (e.g., Caracas and Verstraete, 2009) may lead to some useful results and a more realistic characterization of may be implemented in the future.
4 Dynamo regimes studied
We study self-sustained dynamos in two main regimes. First, we include two sets of cases with relatively low , where the resultant fields are non-reversing and dipole dominated. Second, we analyzed strongly forced and time variable cases where dynamos result in dipolar magnetic fields with strong multipolar components. We chose a values for (set A), (set B) and (sets C and C’), where the value of was calculated using the empirical formula for the onset of convection in rotating spherical shells from Al-Shamali et al. (2004). For sets A, C and C’, and for set B. Common parameters used for all sets are a Prandtl number , and a radius ratio . For sets A, B and C non-slip and fixed temperature boundary conditions are used at both, bottom and top boundaries. We also include cases with top and bottom free-slip boundaries, i.e., set C’. For this set, all other parameters identical to those of set C. The models account for an electrically conductive inner core where electrical conductivity is homogeneous in the inner core, continuous through the ICB, and may vary radially in the outer core. The electrical conductivity for the mantle was chosen to be zero. All simulations in sets A, C and C’ have the same resolution, with 61 radial levels for the outer core and 17 for the inner core; 288 () grid points in the azimuthal direction and half of that in the latitudinal direction. For set B the latitudinal and azimuthal resolution was increased to 256 and 512 respectively () and 65 radial levels were used. Hyperdyffusivities were not used for any of the runs presented in this paper. For the purpose of normalization only, the magnetic Prandtl number, , is defined by the ratio between the viscous diffusivity of the fluid, , and electrical diffusivity of the inner core, (which is the minimum diffusivity in the simulated volume).
For each set A, B, C and C’ we compare two cases with homogeneous electrical conductivity in the fluid with cases with electrical conductivity varying as a function of radius. To label these cases is used, where is the same used in equation 13. Cases with homogeneous conductivity are: non-magnetic case (from here on referred to as ) and a case with constant electrical conductivity (). The radially variable electrical conductivity cases A, B, C and C’ have , and , see figure 1. The shape of the electrical conductivity function is defined by equation 13. For all cases , and .
5 Results
Significant changes in the internal dynamics of the simulations are obtained by varying the electrical conductivity profile. Energy time series for sets A and C are included in figures 2 and 3. The time variability of the solution varies with . We find quasi-stationary solutions for set A for and . The solutions for sets B, C and C’ did not result in quasi-stationary solutions, as may be seen for set C in figure 3.


We include Table 1 with time-averaged values, where the average has been taken over two viscous diffusion times. The standard deviation from the time-averaged value is also included.
| A | 3.4 | 0.00 | 133.5 | 9.5 | 0.3575 | 0.0022 | ||||||||||
| 3.4 | 0.80 | 121.7 | 6.1 | 3.8 | 0.2 | 0.029 | 0.001 | 0.78 | 0.01 | 0.0565 | 0.0036 | 0.114659 | 0.006442 | 0.3554 | 0.0014 | |
| 3.4 | 0.90 | 118.6 | 4.5 | 7.5 | 1.2 | 0.026 | 0.001 | 0.67 | 0.03 | 0.0257 | 0.0057 | 0.050601 | 0.001241 | 0.3497 | 0.0029 | |
| 3.4 | 0.98 | 123.2 | 7.0 | 23.0 | 4.2 | 0.250 | 0.100 | 0.61 | 0.10 | 0.0513 | 0.0126 | 0.003315 | 0.001058 | 0.3266 | 0.0117 | |
| 3.4 | 109.6 | 9.5 | 36.4 | 6.8 | 1.055 | 0.272 | 0.60 | 0.06 | 0.1224 | 0.0195 | 0.000483 | 0.000129 | 0.3228 | 0.0163 | ||
| B | 7.8 | 0.00 | 638.7 | 23.1 | 0.2355 | 0.0023 | ||||||||||
| 7.8 | 0.80 | 542.6 | 34.2 | 67.6 | 8.1 | 0.120 | 0.043 | 0.05 | 0.07 | 0.0022 | 0.0020 | 0.006126 | 0.002463 | 0.1726 | 0.0155 | |
| 7.8 | 0.90 | 505.8 | 32.1 | 99.1 | 11.9 | 0.403 | 0.134 | 0.01 | 0.01 | 0.0014 | 0.0009 | 0.001160 | 0.000463 | 0.1604 | 0.0135 | |
| 7.8 | 0.98 | 360.4 | 27.6 | 387.4 | 56.0 | 20.269 | 4.161 | 0.43 | 0.07 | 0.1095 | 0.0170 | 0.000005 | 0.000001 | 0.1514 | 0.0102 | |
| 7.8 | 360.1 | 31.9 | 447.7 | 102.7 | 34.748 | 11.645 | 0.32 | 0.07 | 0.1105 | 0.0212 | 0.000002 | 0.000001 | 0.1572 | 0.0141 | ||
| C | 16.8 | 0.00 | 814.1 | 31.4 | 0.0974 | 0.0043 | ||||||||||
| 16.8 | 0.80 | 704.0 | 32.3 | 39.9 | 4.2 | 0.042 | 0.010 | 0.04 | 0.05 | 0.0014 | 0.0009 | 0.413985 | 0.155259 | 0.0990 | 0.0047 | |
| 16.8 | 0.90 | 662.3 | 29.9 | 65.8 | 5.5 | 0.329 | 0.060 | 0.02 | 0.02 | 0.0016 | 0.0011 | 0.032156 | 0.008828 | 0.0984 | 0.0049 | |
| 16.8 | 0.98 | 661.0 | 30.0 | 66.5 | 6.1 | 0.335 | 0.063 | 0.02 | 0.03 | 0.0016 | 0.0012 | 0.015181 | 0.004695 | 0.0984 | 0.0046 | |
| 16.8 | 506.8 | 27.2 | 336.3 | 30.2 | 22.479 | 2.637 | 0.13 | 0.02 | 0.0375 | 0.0059 | 0.000073 | 0.000010 | 0.1020 | 0.0054 | ||
| C’ | 16.8 | 0.00 | 1646.0 | 66.1 | 0.1664 | 0.0261 | ||||||||||
| 16.8 | 0.80 | 1485.3 | 24.7 | 66.5 | 7.0 | 0.096 | 0.029 | 0.04 | 0.05 | 0.0018 | 0.0012 | 0.132790 | 0.057043 | 0.1277 | 0.0099 | |
| 16.8 | 0.90 | 883.8 | 33.7 | 103.8 | 9.0 | 0.480 | 0.110 | 0.01 | 0.02 | 0.0015 | 0.0009 | 0.019941 | 0.005702 | 0.1084 | 0.0074 | |
| 16.8 | 0.98 | 753.7 | 33.2 | 117.4 | 8.8 | 1.258 | 0.238 | 0.01 | 0.01 | 0.0015 | 0.0010 | 0.006946 | 0.001642 | 0.1023 | 0.0066 | |
| 16.8 | 627.4 | 33.2 | 276.7 | 35.7 | 9.576 | 2.099 | 0.20 | 0.03 | 0.0329 | 0.0074 | 0.000143 | 0.000040 | 0.1008 | 0.0060 | ||
The Reynolds number, , for is always greater than for the corresponding . In particular, the toroidal kinetic energy is decreased due to the presence of Lorentz forces.
Values of the averaged Elsasser number, in the fluid outer core and at the top of the simulated fluid are included in columns four and five in Table 1. It is important to note that the definition of uses instead of to be consistent with the normalization and the non-dimensional parameters. Using the total magnetic energy, , the axisymmetric dipolar magnetic energy, , and the total and axisymmetric energy at the CMB, , and , respectively; we calculate the ratio of the axisymmetric dipole to the whole magnetic energy for the whole fluid () and at the CMB (). These values are shown in columns 7 and 6, respectively.
The axisymmetric dipole component is dominant for all runs in set A, see in column six in Table 1. In contrast, the magnetic field energy is distributed over higher multipoles in sets B, C, and C’, due to the higher value. For these three sets, the variable conductivity cases exhibit broader length scale features and weaker fields at the CMB than case , this is due to the diffusion of magnetic field through the low electrical conductivity volume.
Observable characteristics of dynamos are limited to the radial component of the magnetic field at the CMB and its temporal variability. It is important to understand how the flow dynamics is correlated to the surface field. Quantities such as in Table 1 serve as an indication of the observable magnetic field. In contrast, characterizes how the magnetic field being carried by the core flow behaves. We compare how much of the fluid core axisymmetry is carried to the CMB surface field. To do this, we take the ratio of the normalized surface axisymmetric dipole energy and the normalized fluid core axisymmetric dipole energy, this quantity is shown as a function of in figure 4.

With the exception of set A a tendency for decreasing is found for increasing . This is reasonable since higher harmonics are preferentially damped by the diffusion through the non-conducting volume. Thus, models with larger non-conductive volumes result in stronger axisymmetric dipoles at the top surface. The exception to this in set A is given by the average of , the quasi-stationary solution results in an increased axisymmetry when compared to . It is possible that this is a consequence of the periodic variation (see panel 3 in figure 2) reinforcing and stabilizing the axisymmetric components of the magnetic field.
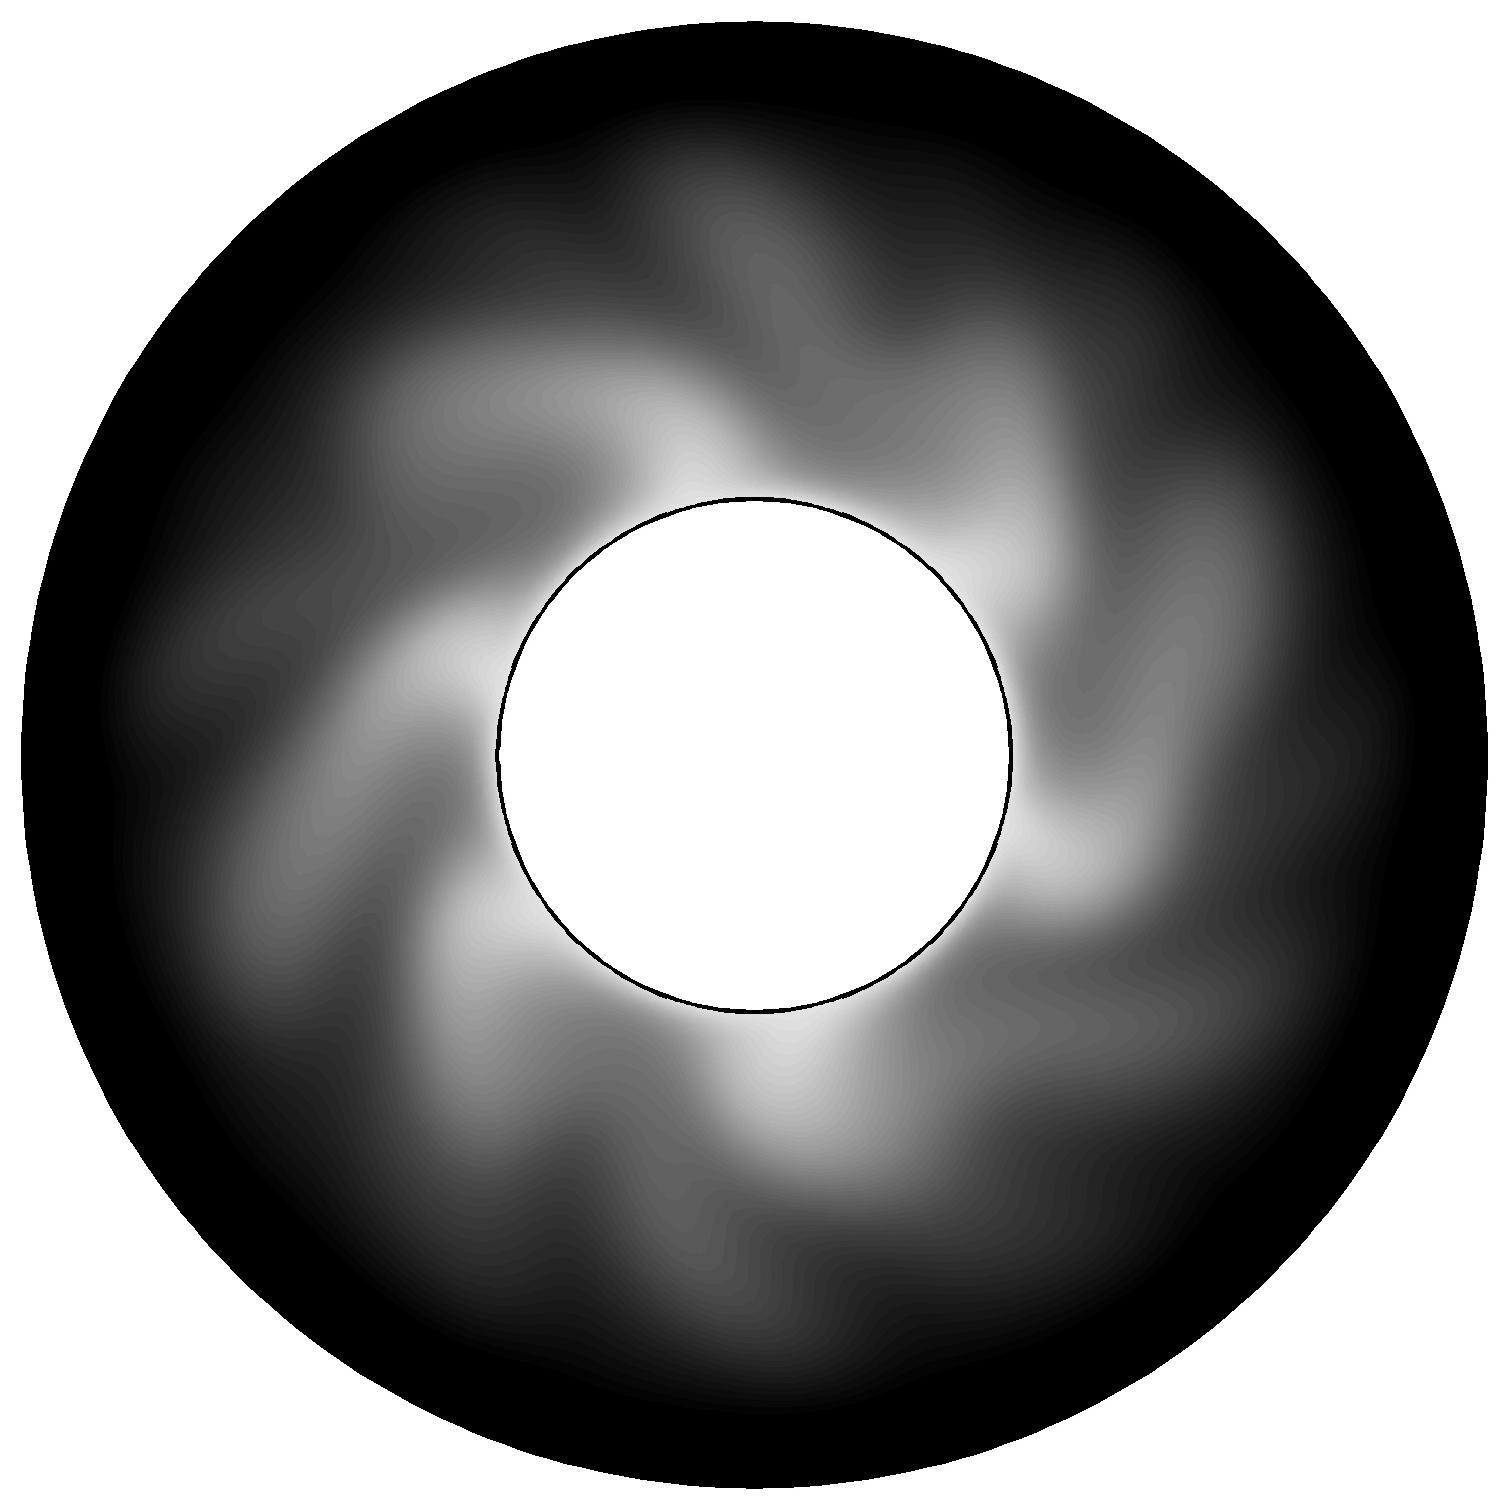
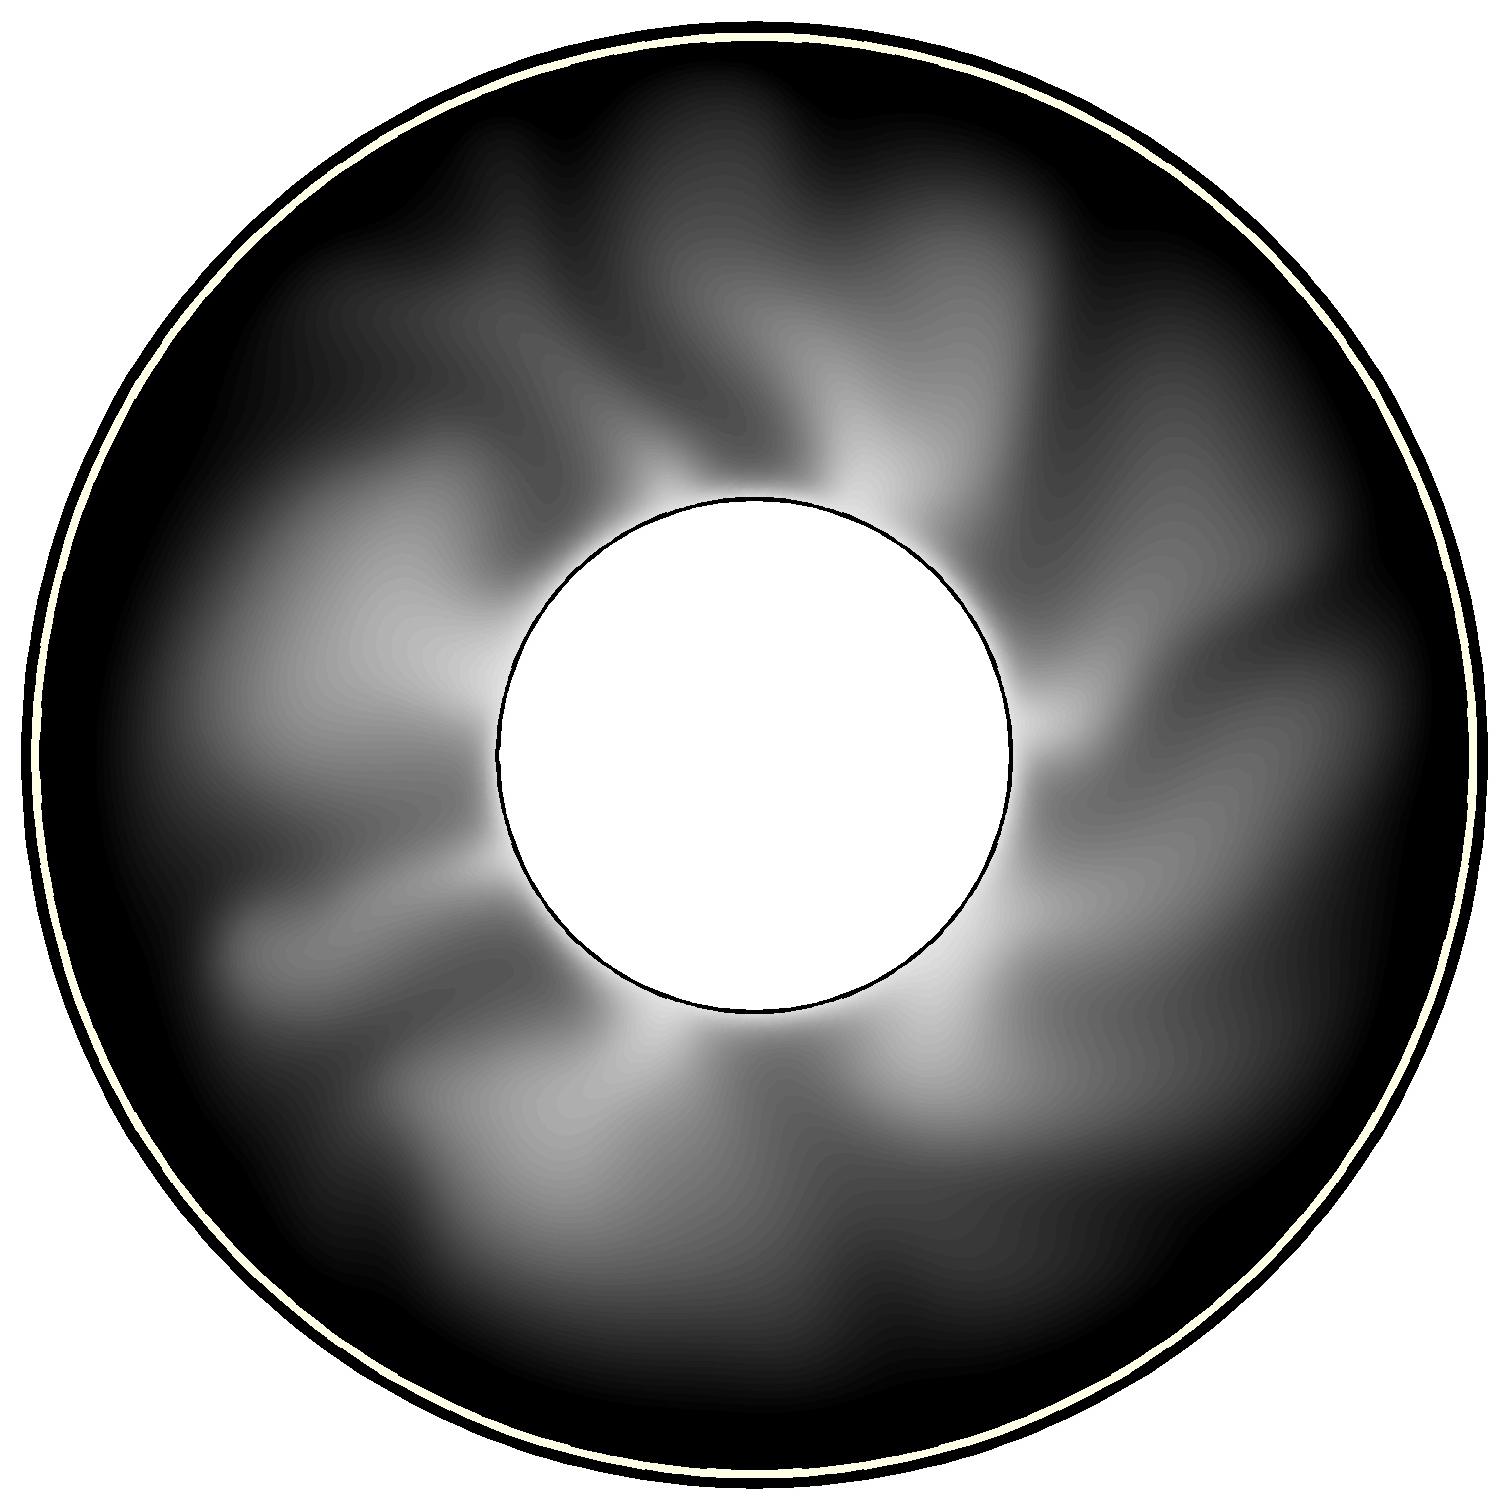
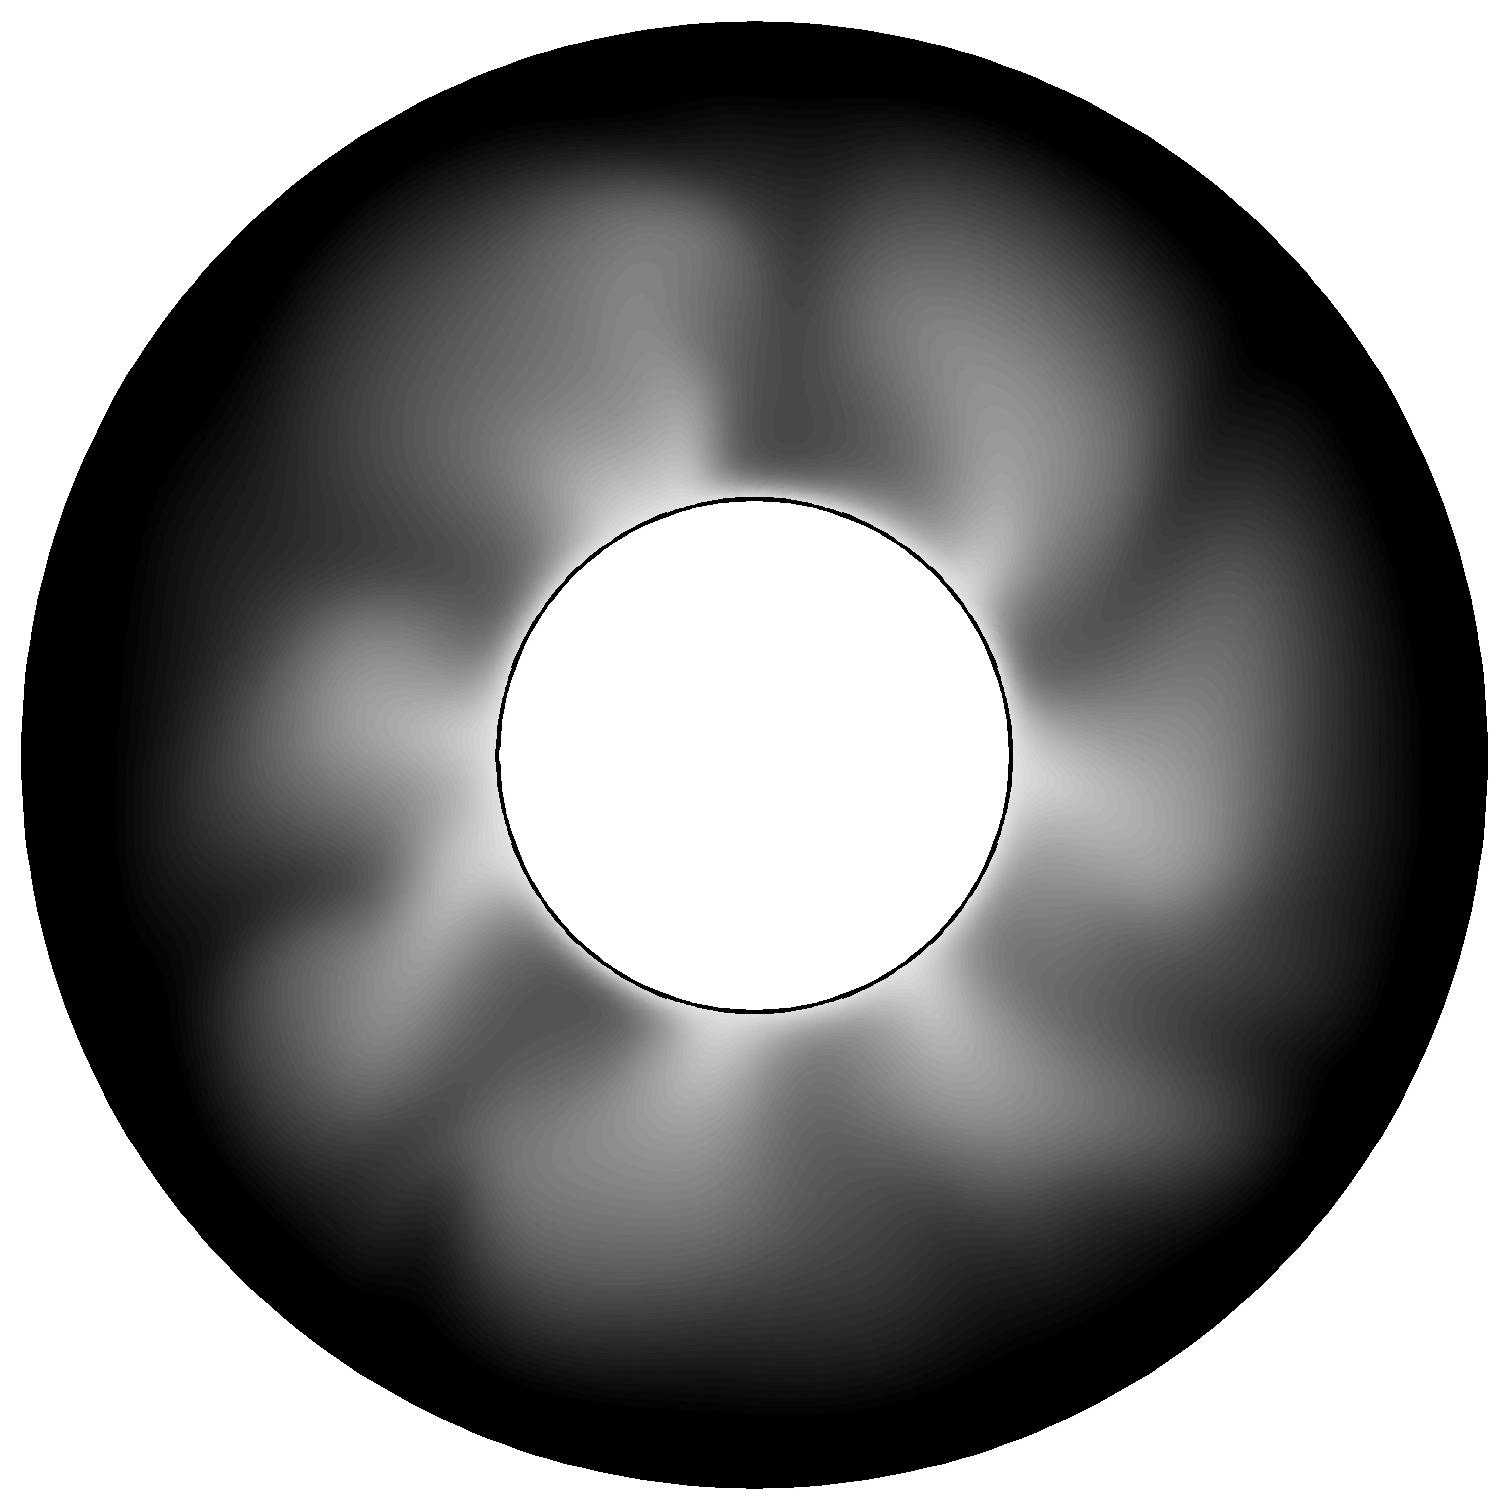
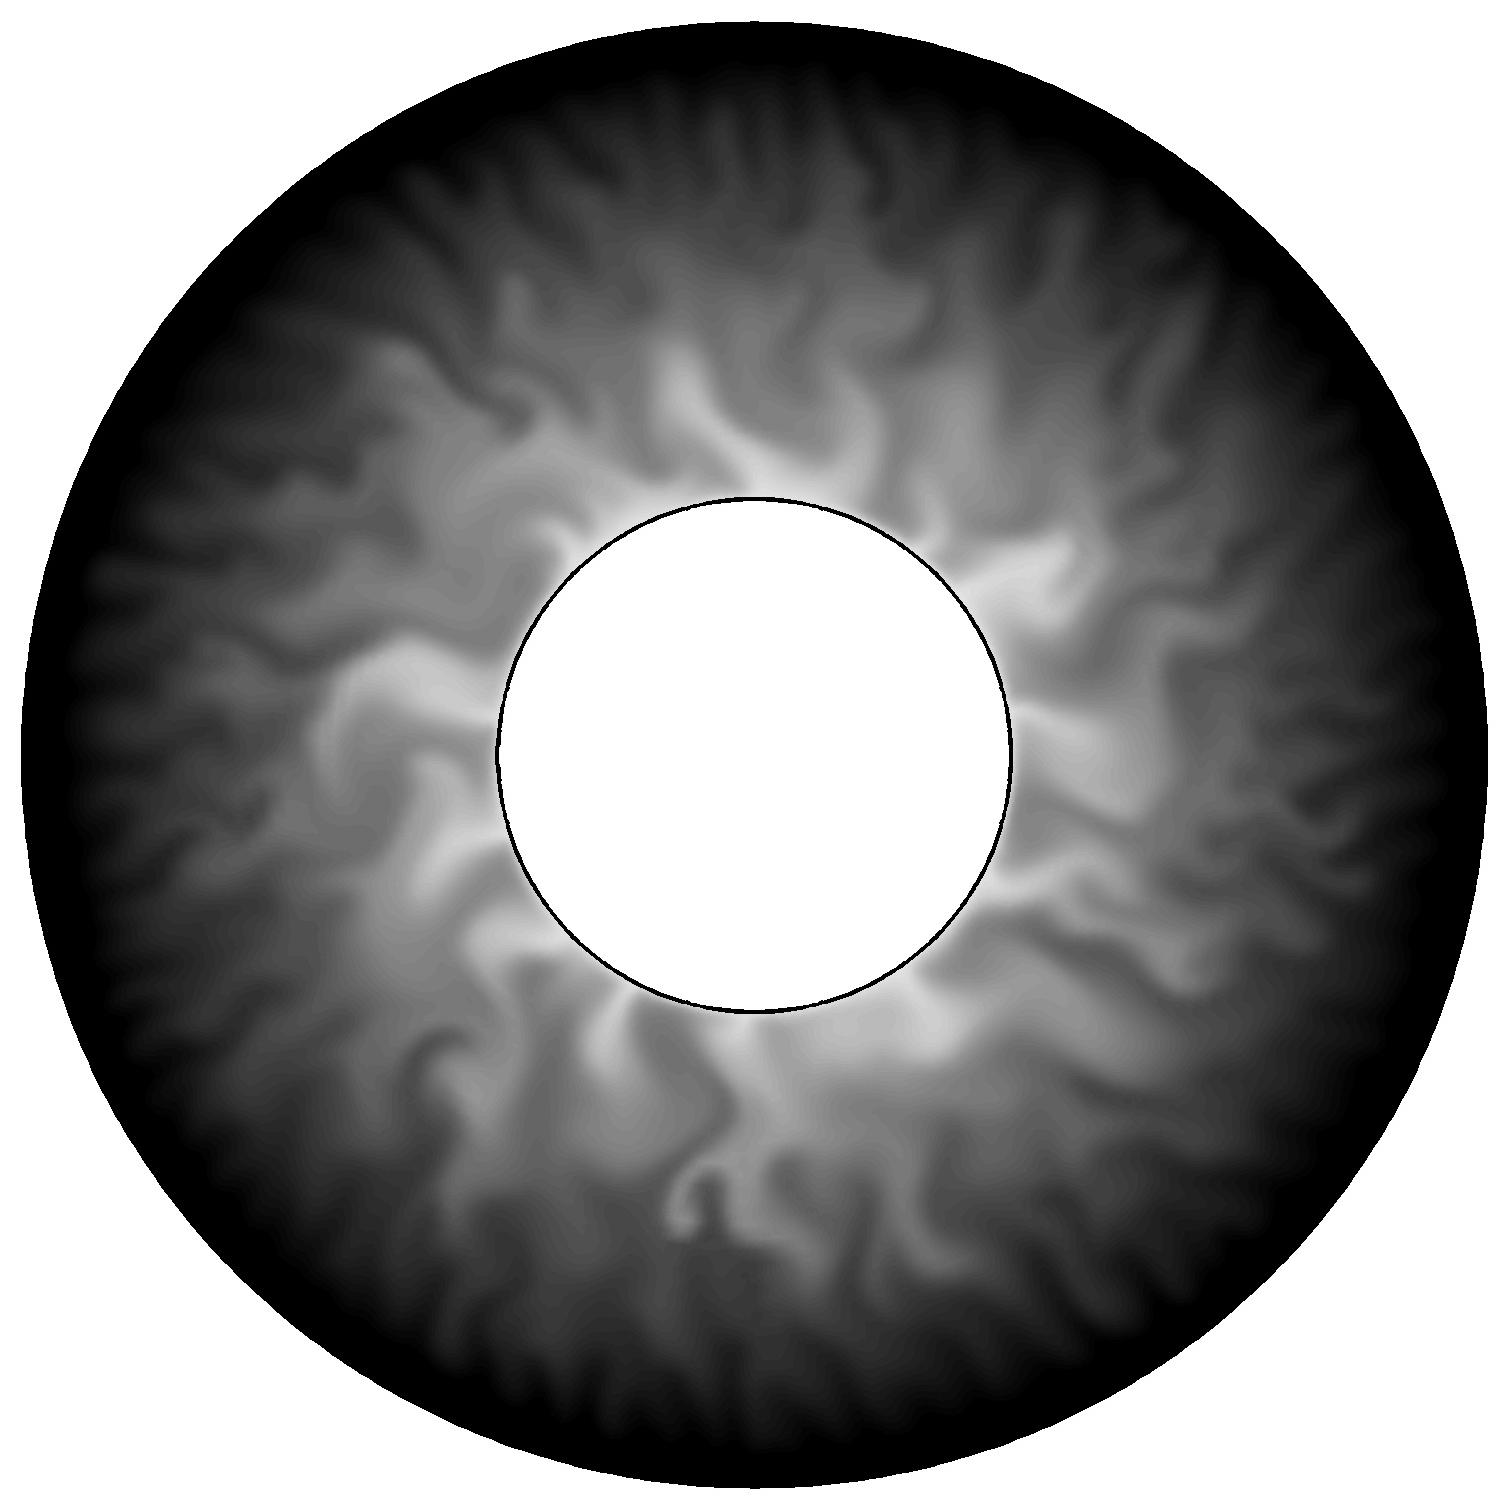
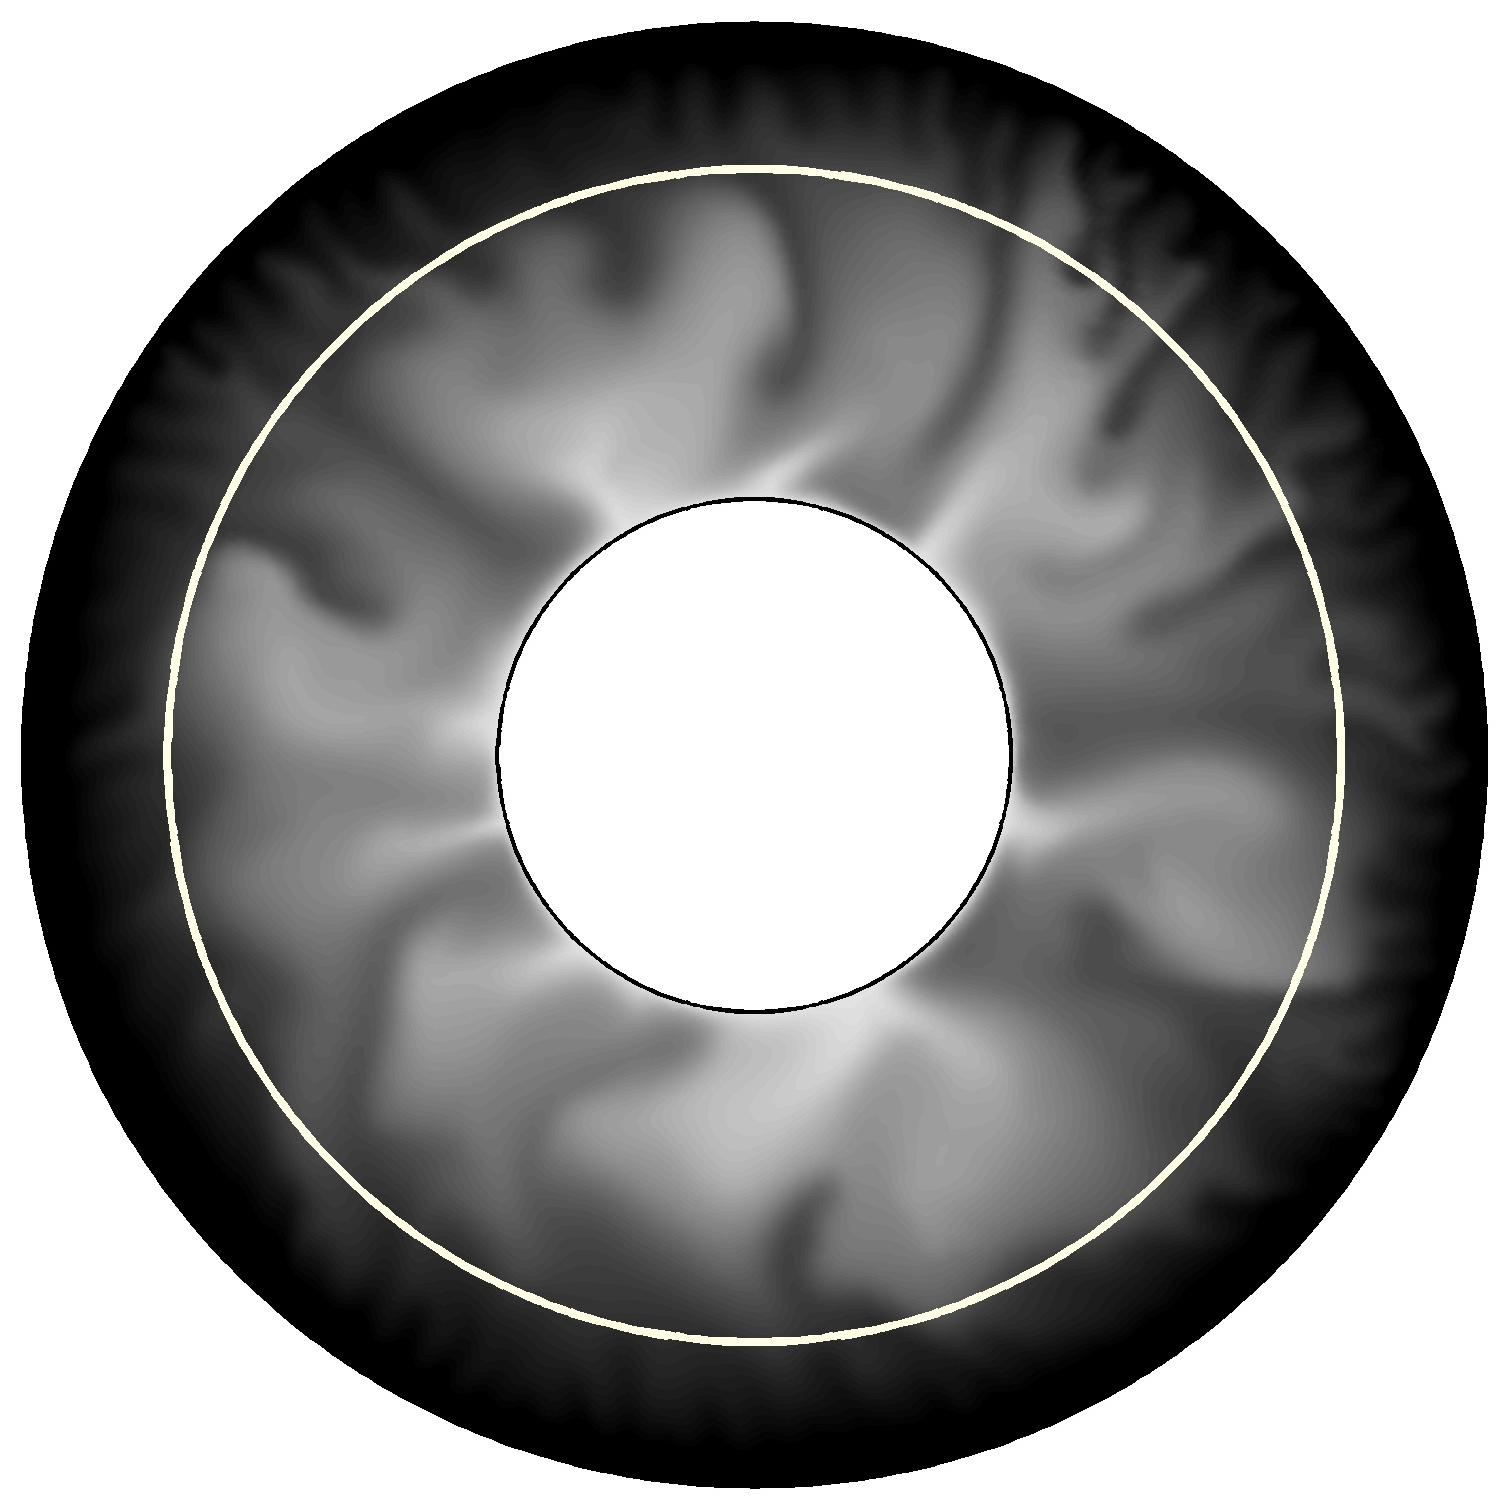
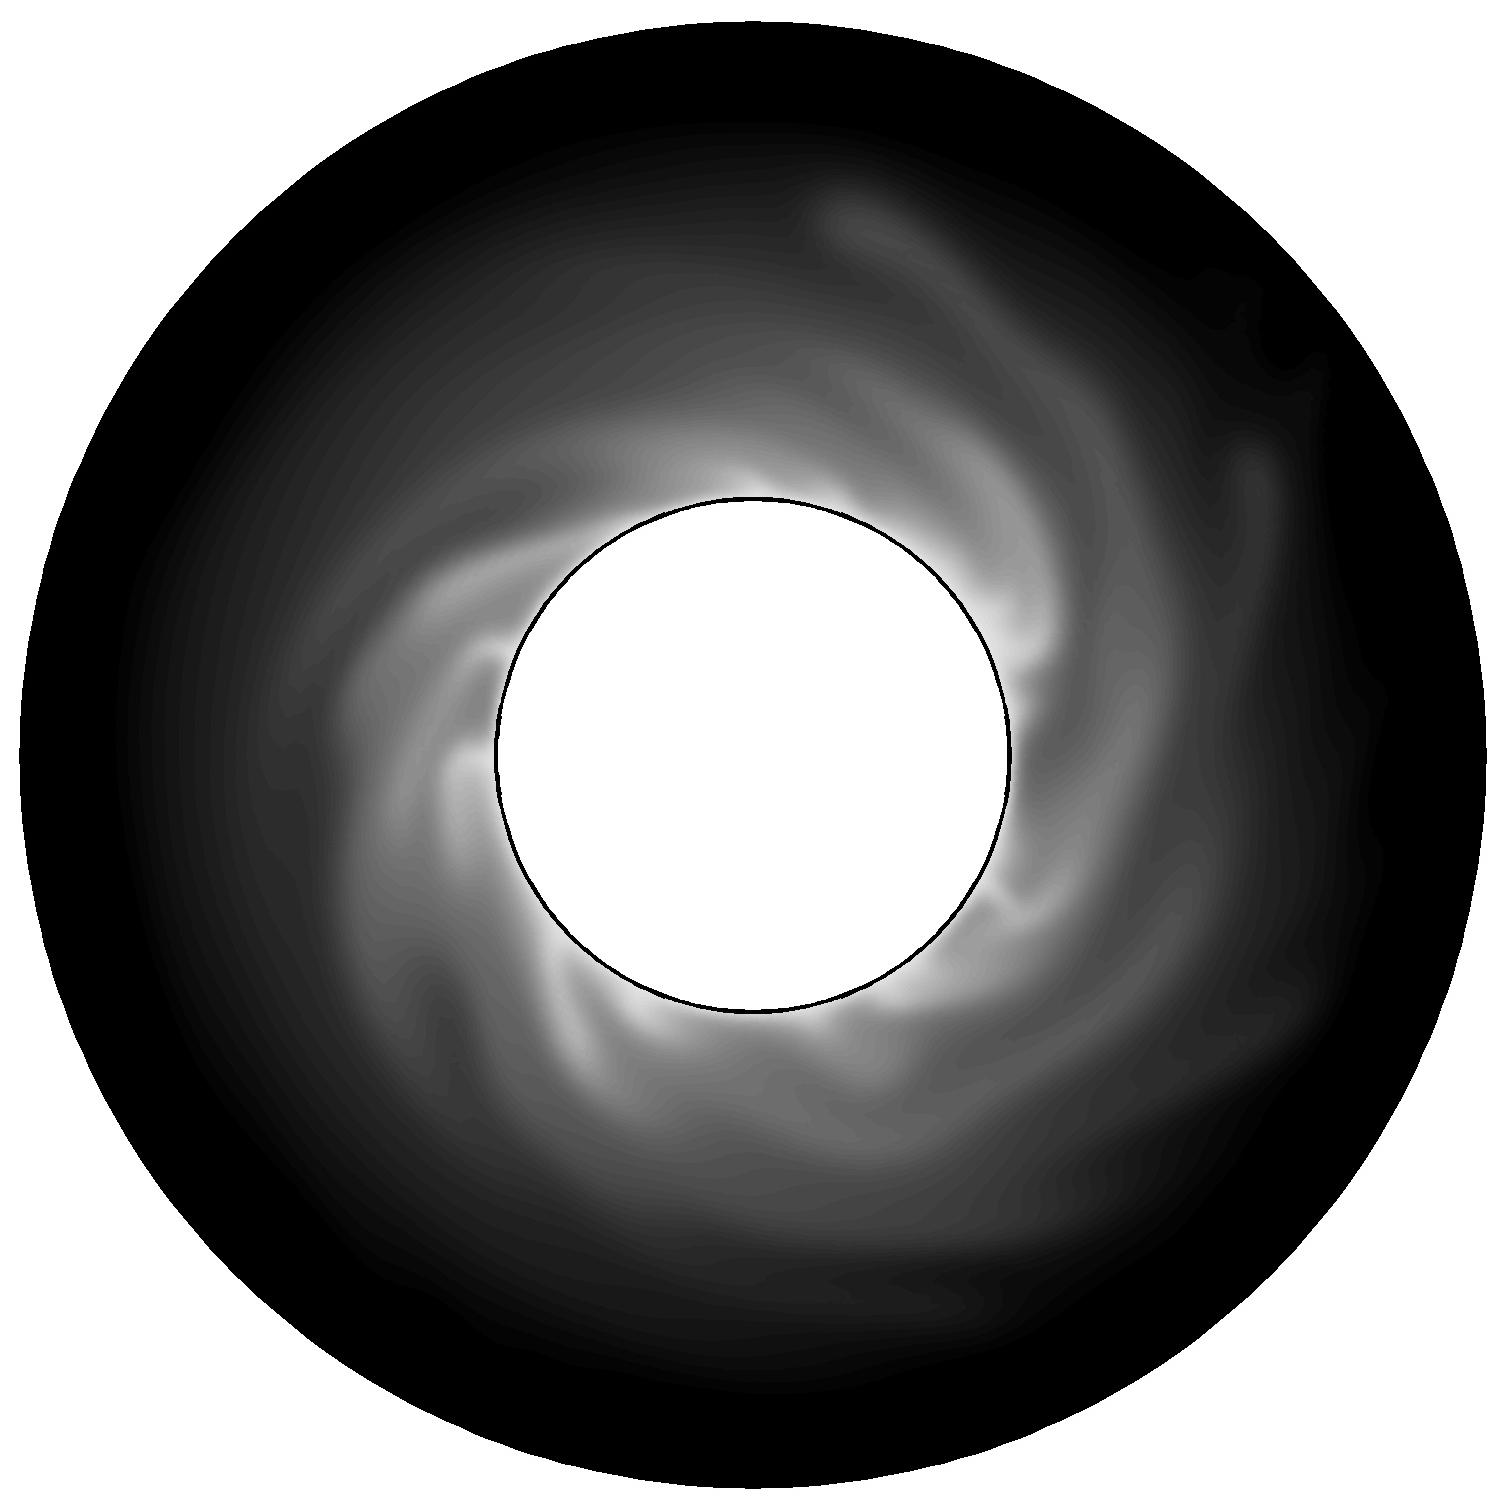
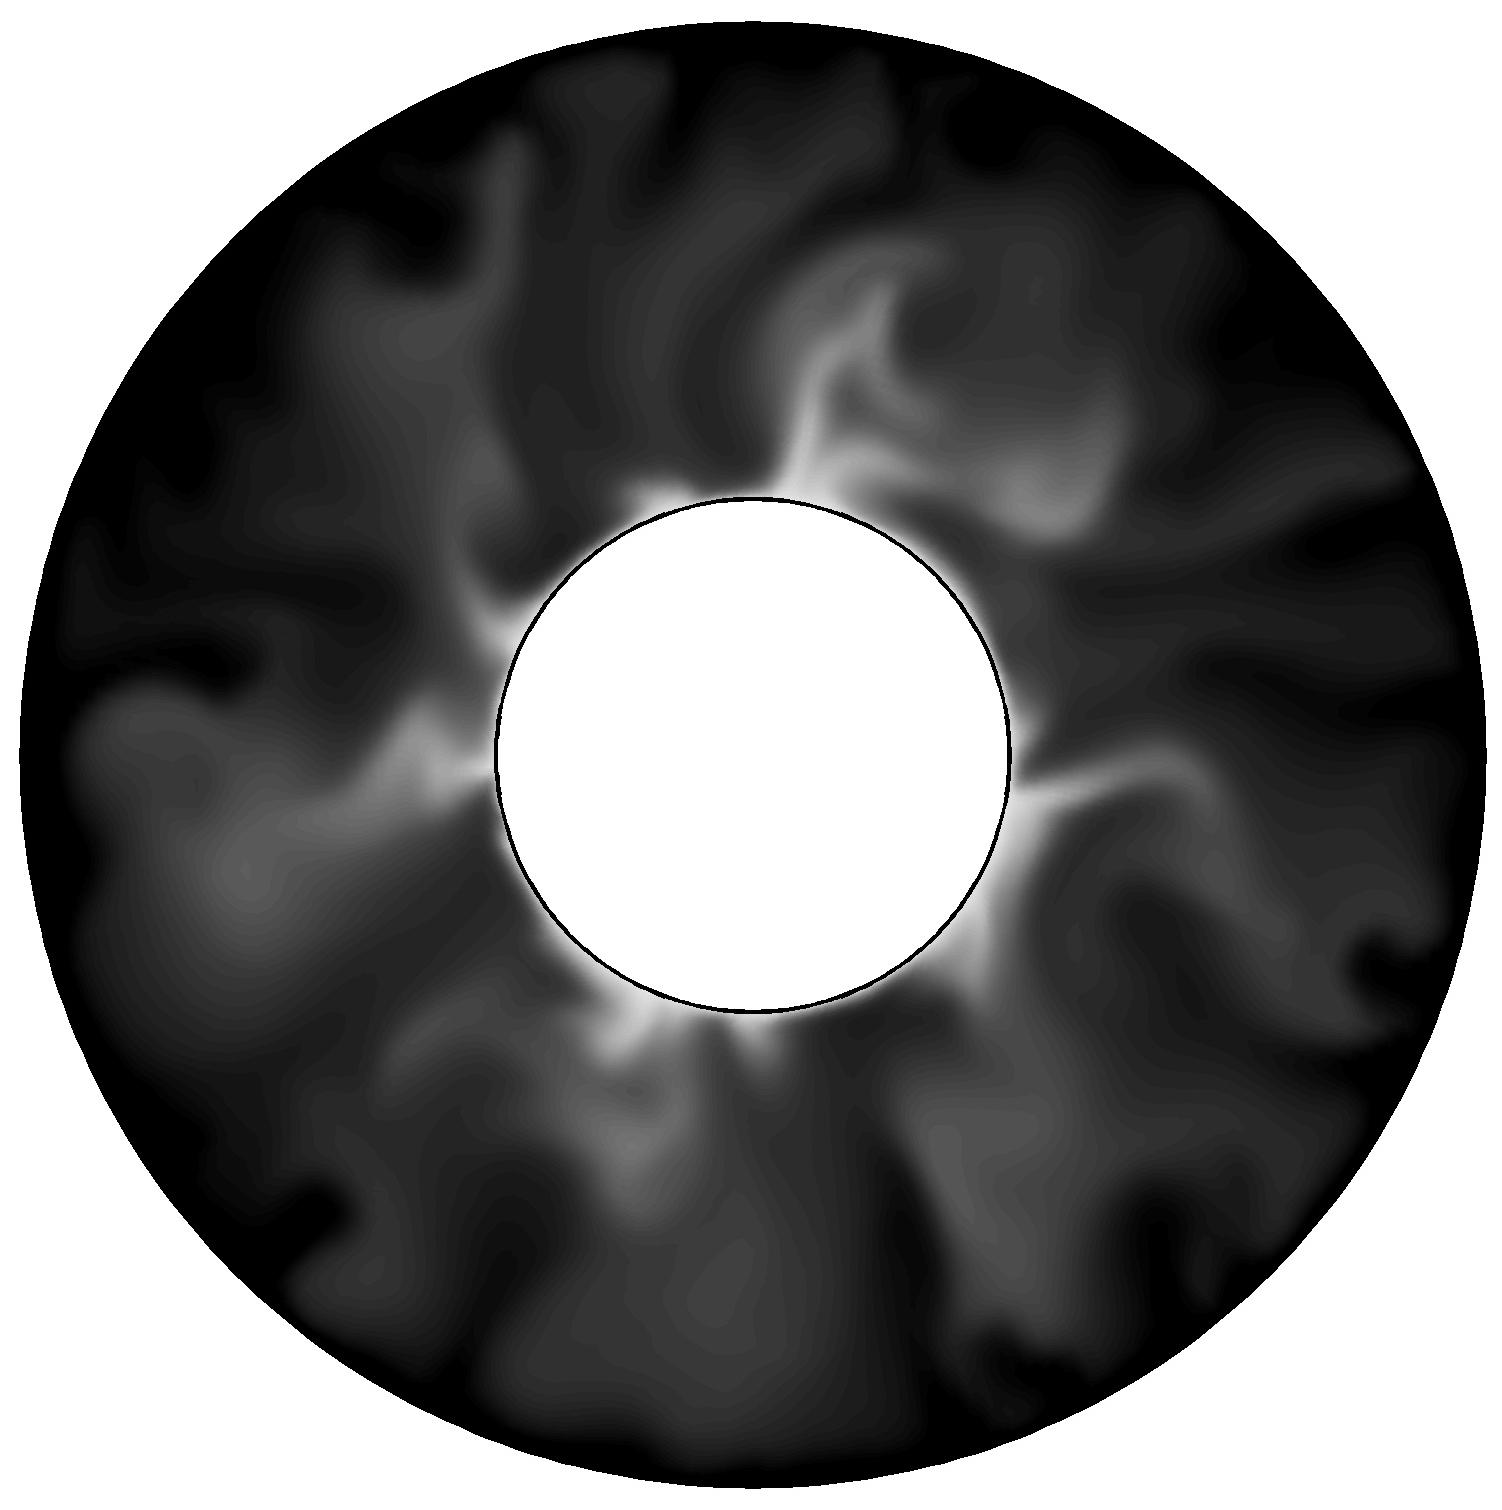
In figure 5 equatorial profiles of the temperature field are shown.
| A |
|

|

|
|
|
| B |
|
|

|
|
|
| C |

|

|

|

|

|
| C’ |
|

|

|

|
|
A behaviour change is evident between the homogeneous non-magnetic and magnetic solutions, with the variable conductivity solutions as intermediate states. For set A, columns one to three () exhibit a similar behaviour. The presence of a mean zonal flow bending the hot thermal plumes in the prograde direction is visible, while for the fifth column () there is no evidence for a strong axisymmetric zonal flow, and the plumes have a dominant radial direction. Column four () shows a weak prograde tilt. For set B, a transition is seen between and , although there is also a significant morphology difference between the non-magnetic case and the variable conductivity and . For the third row (set C) there is a difference between the finite runs and in the characteristic azimuthal wave number of the plumes. In of set C there are six distinguishable hot plumes while for all others the wave number is as high as nine.
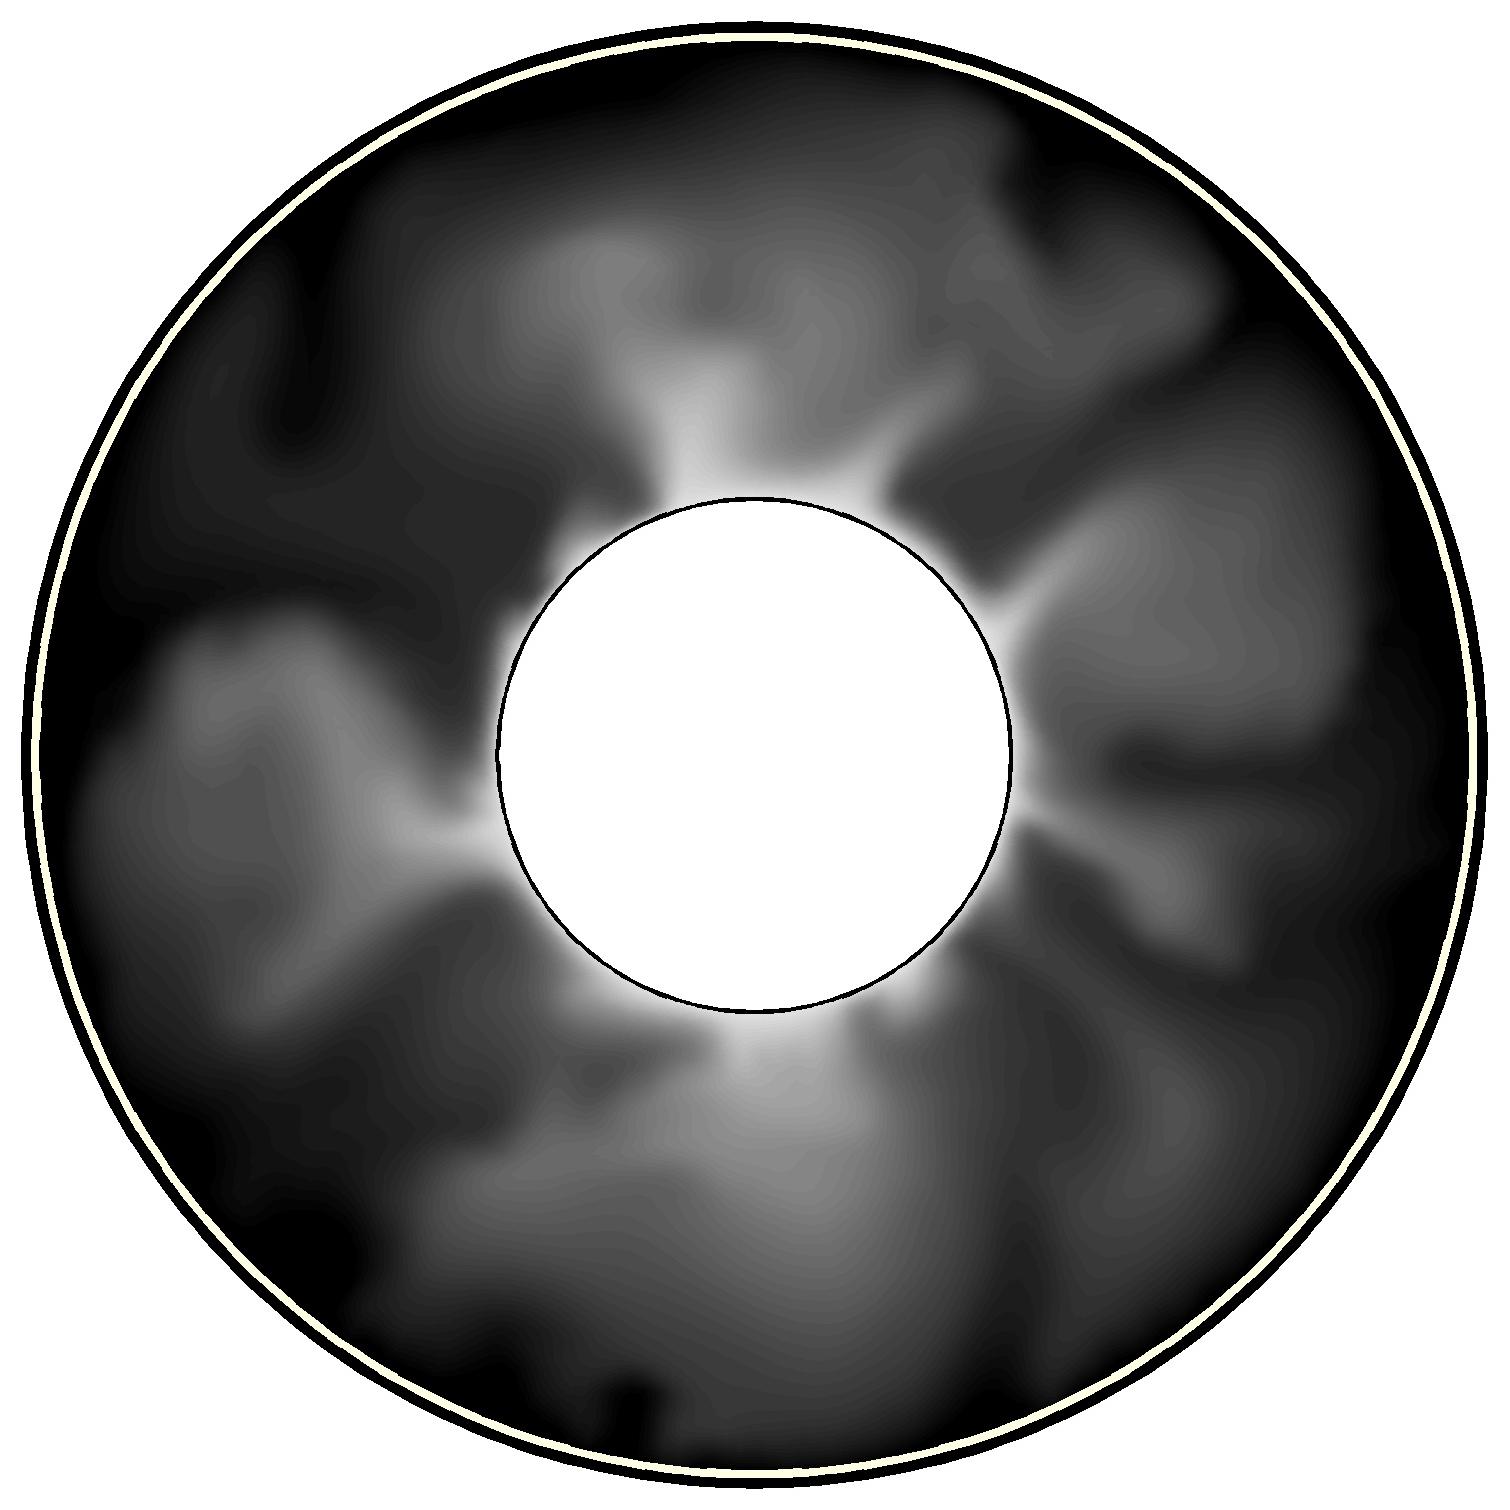
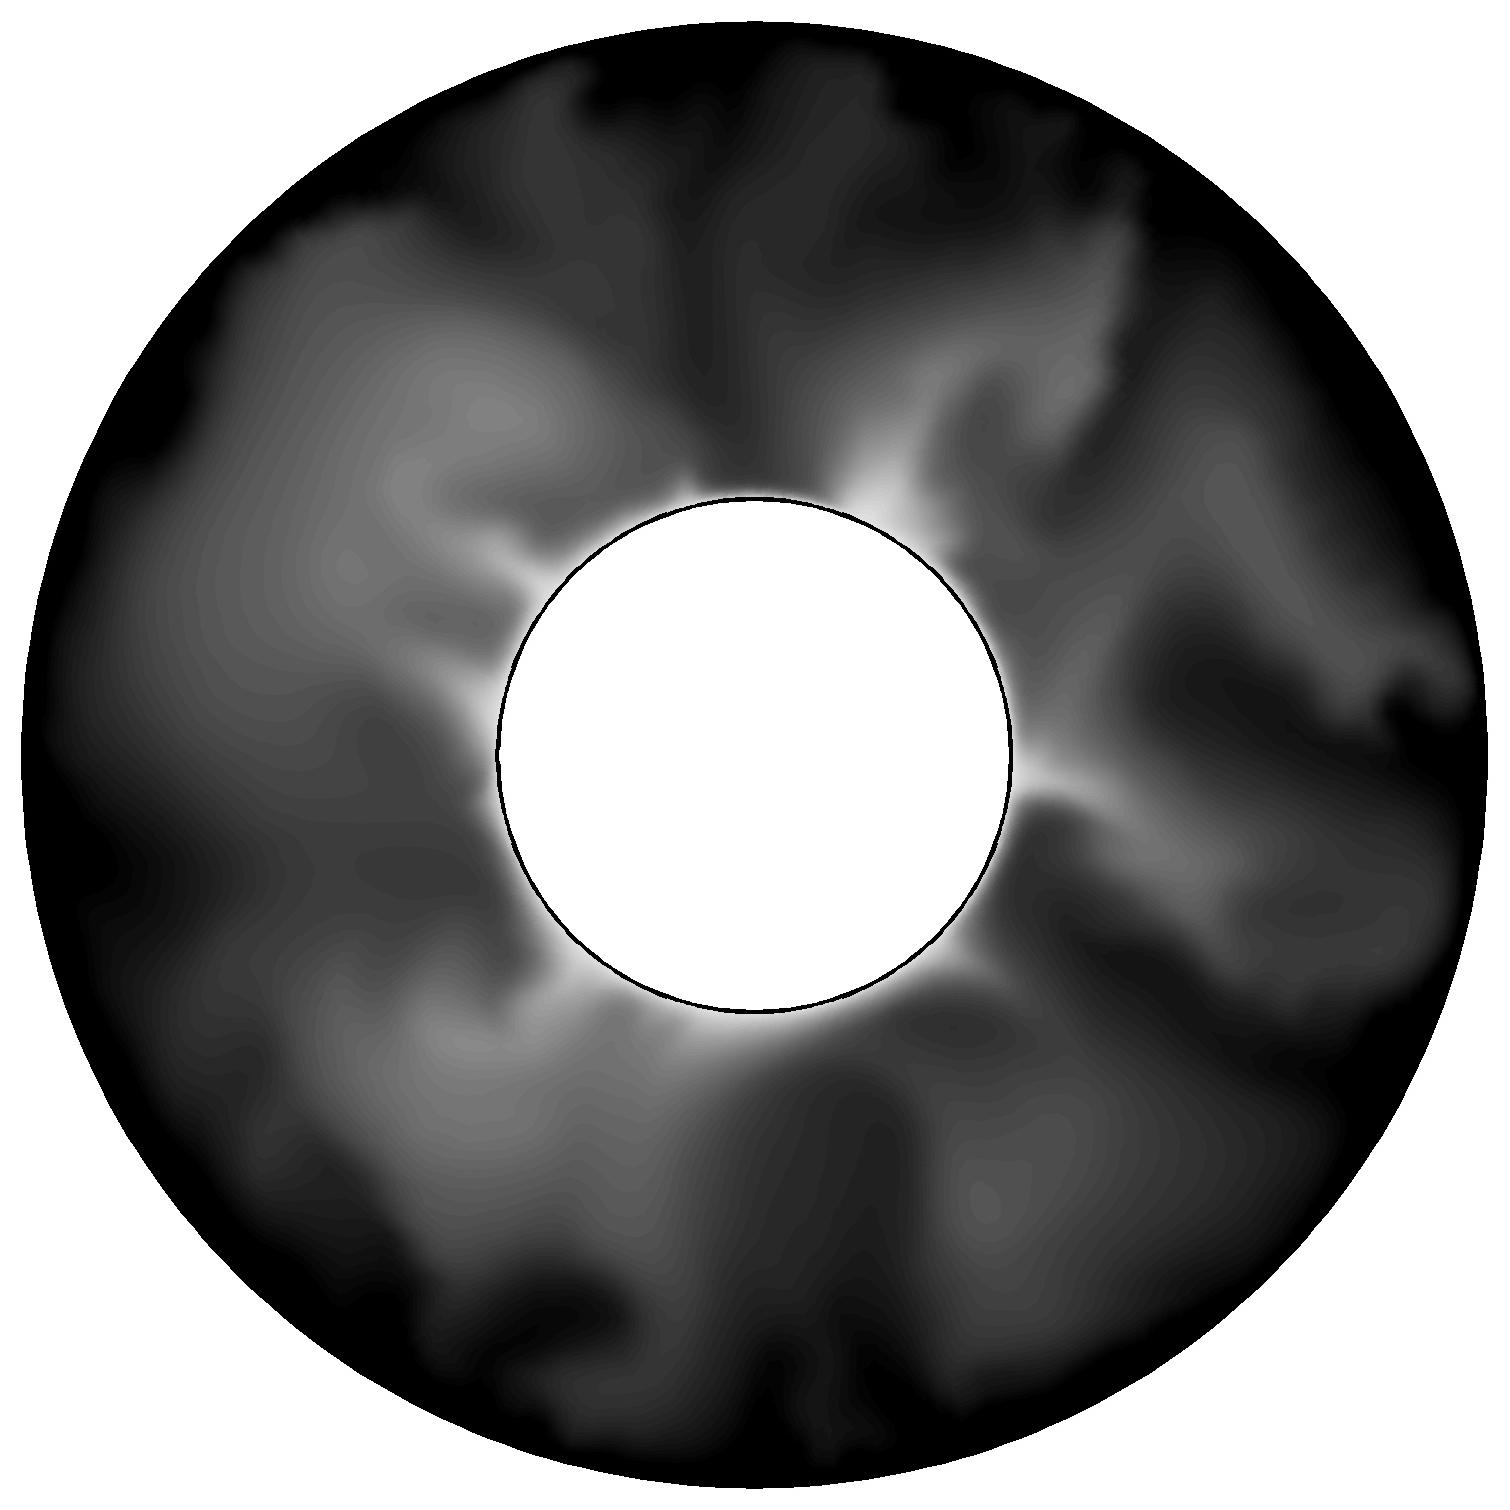
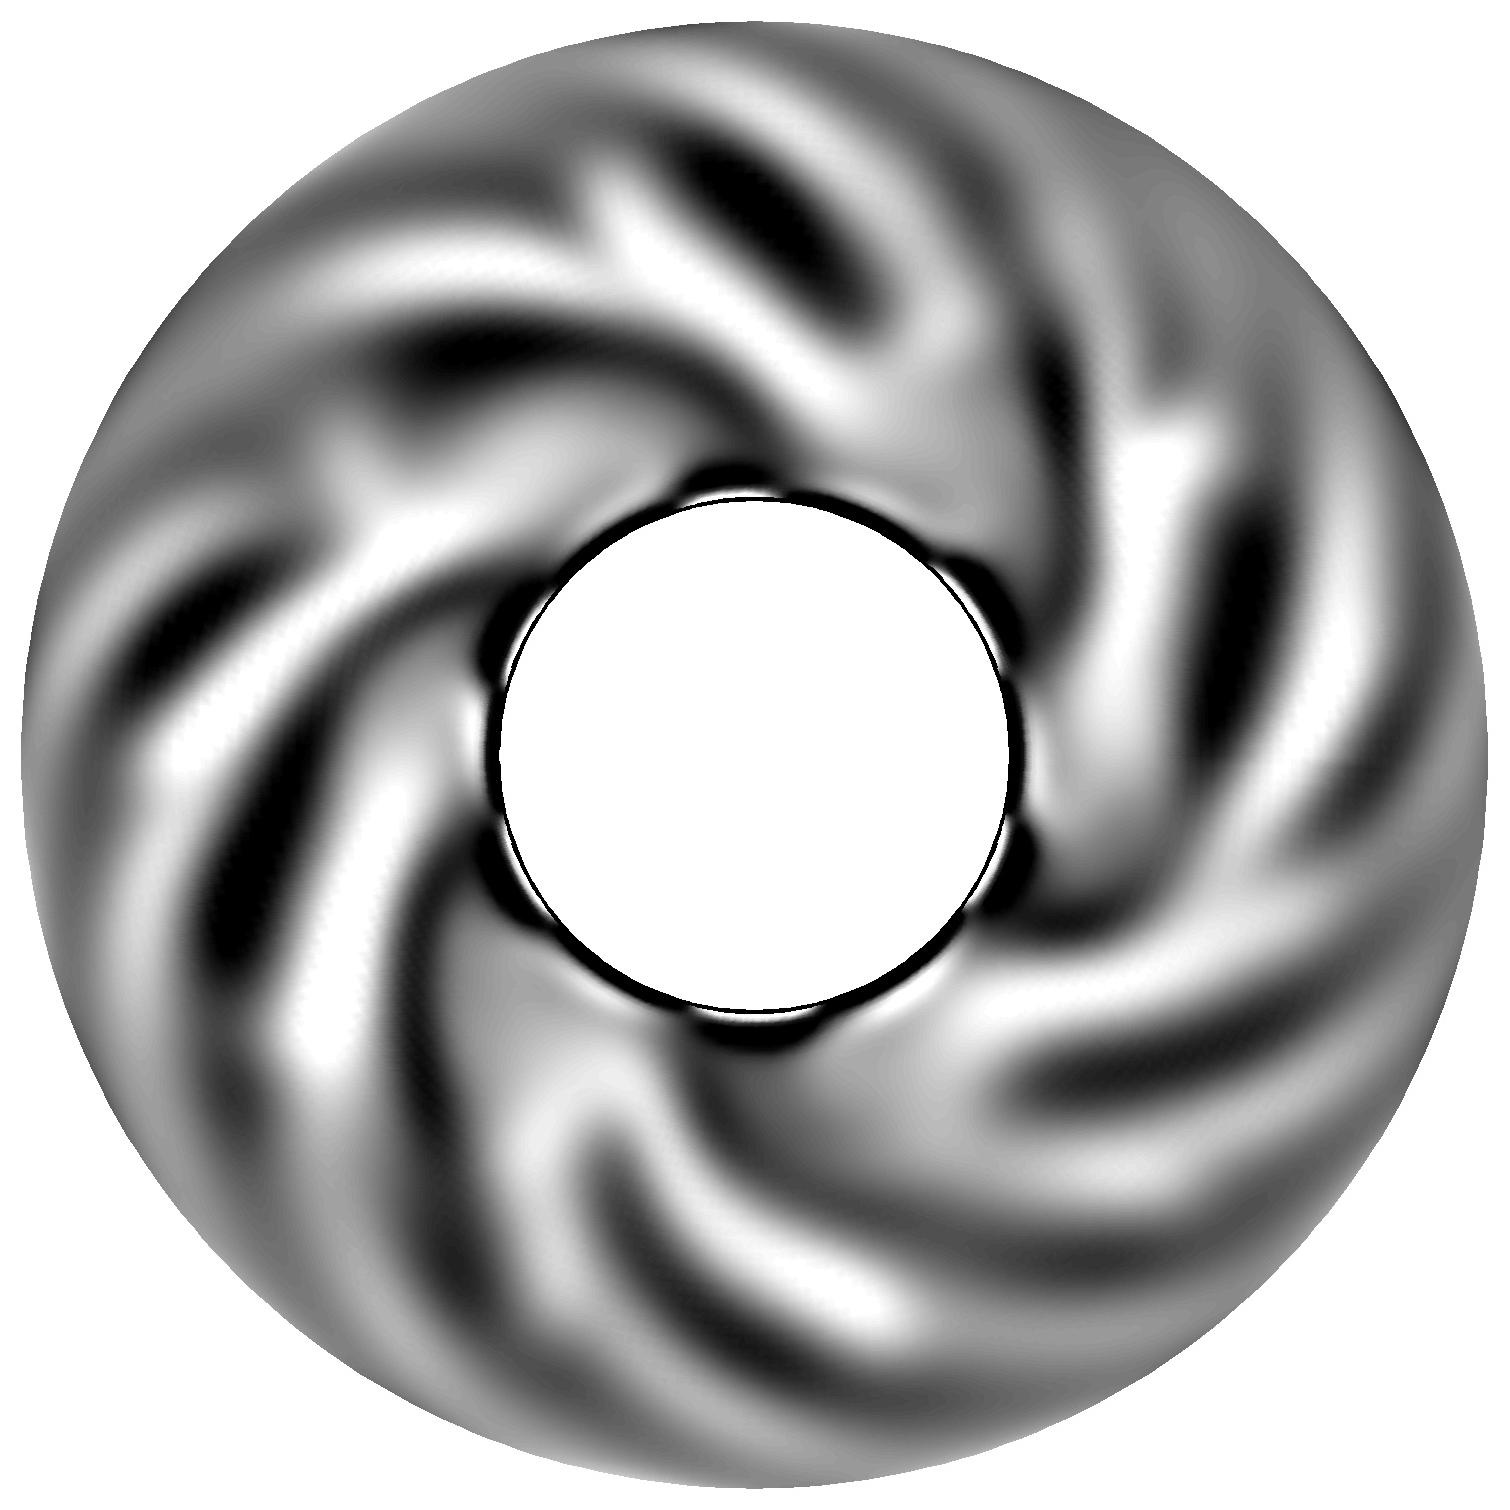
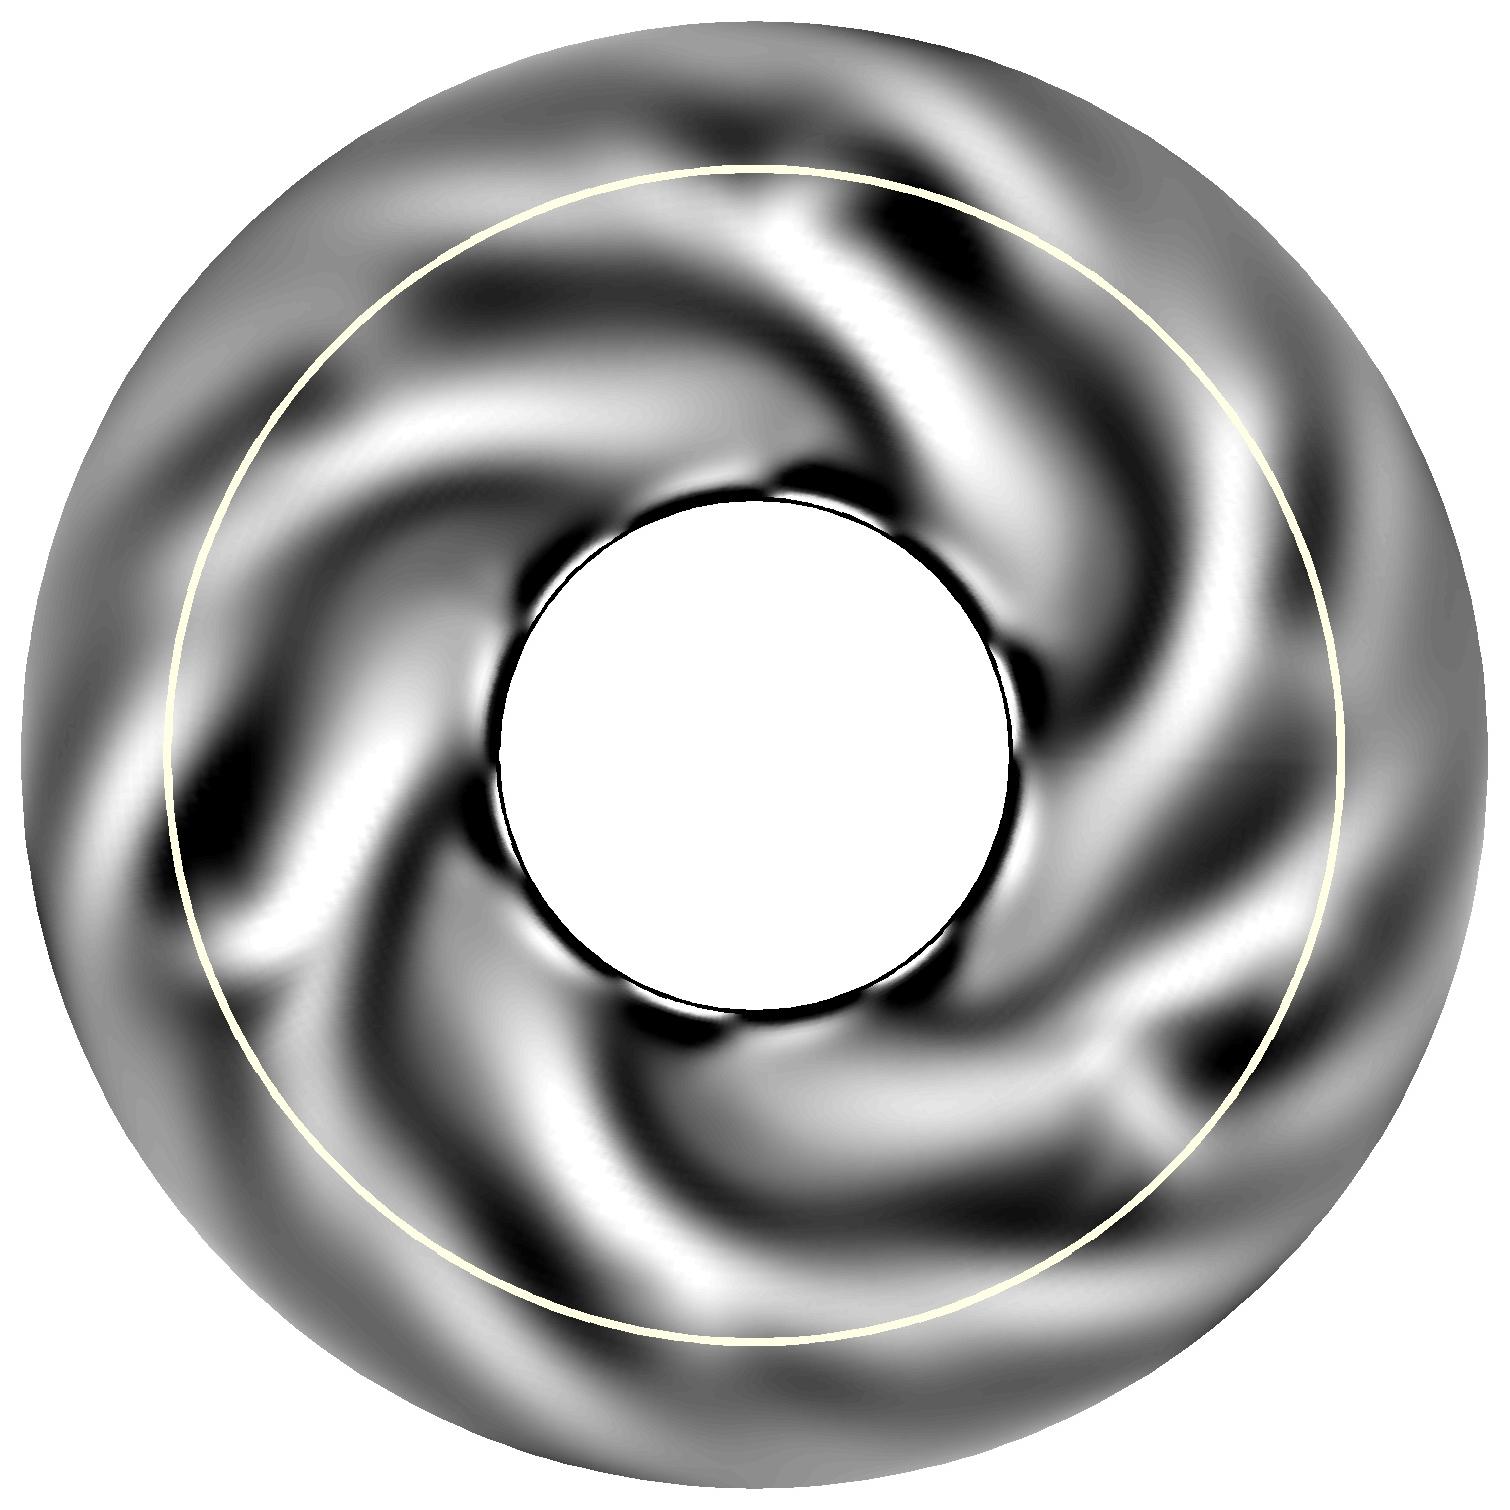
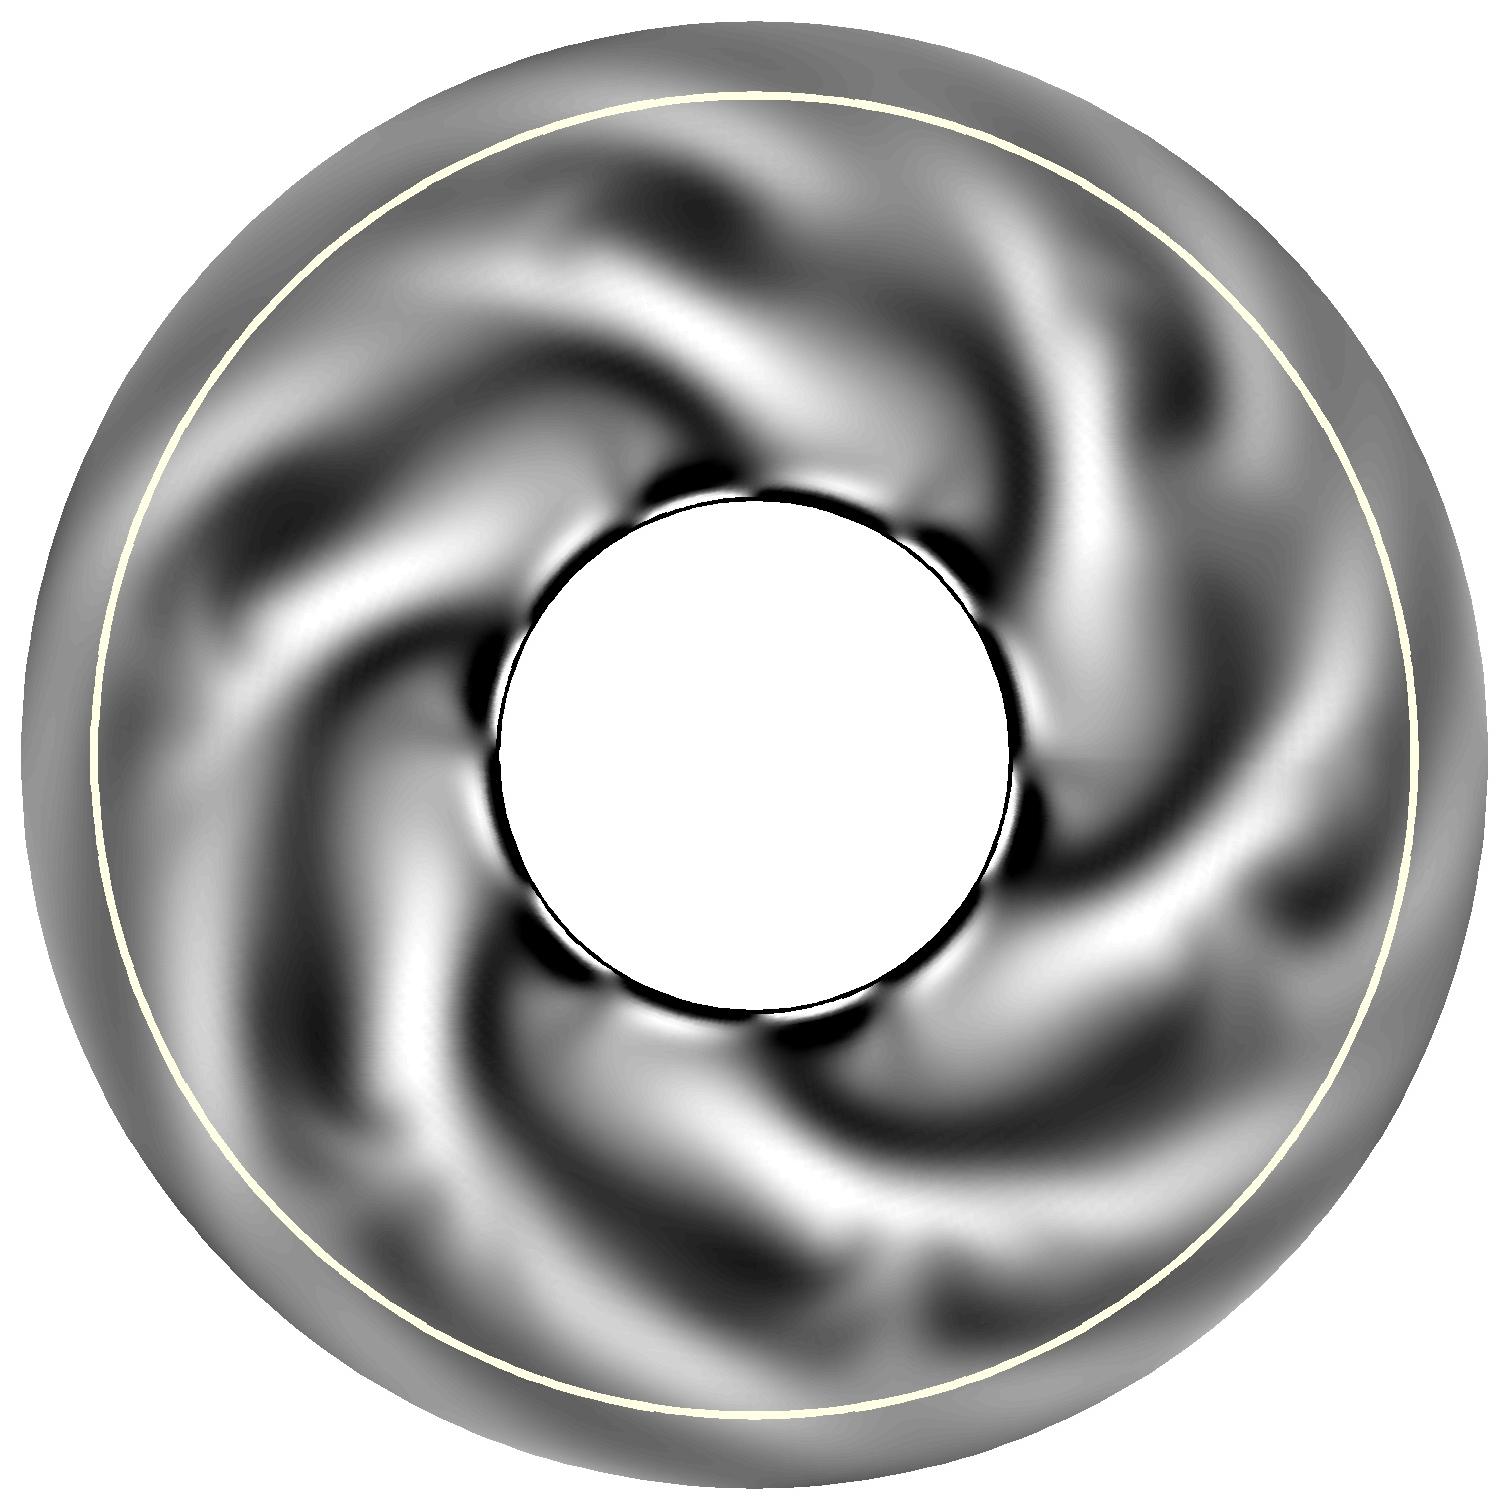
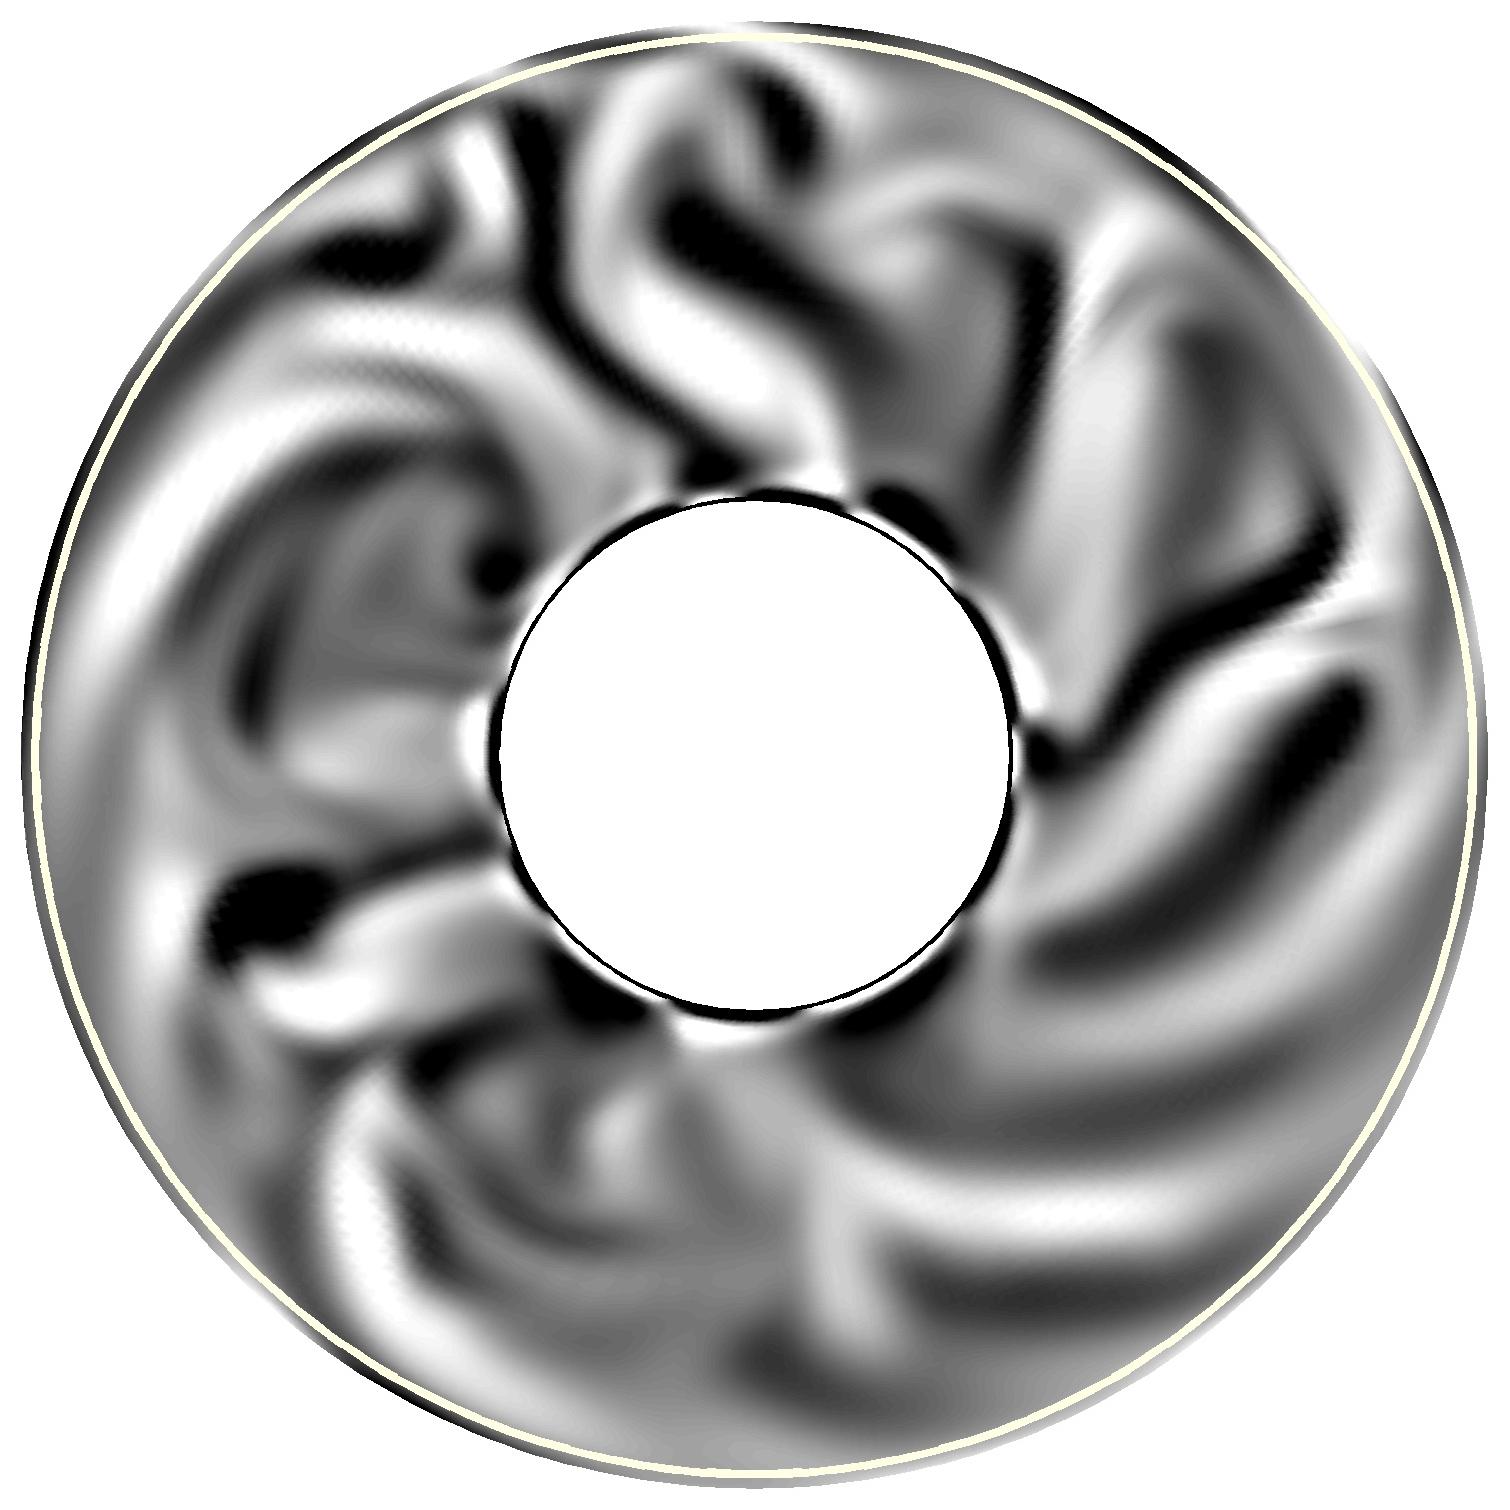
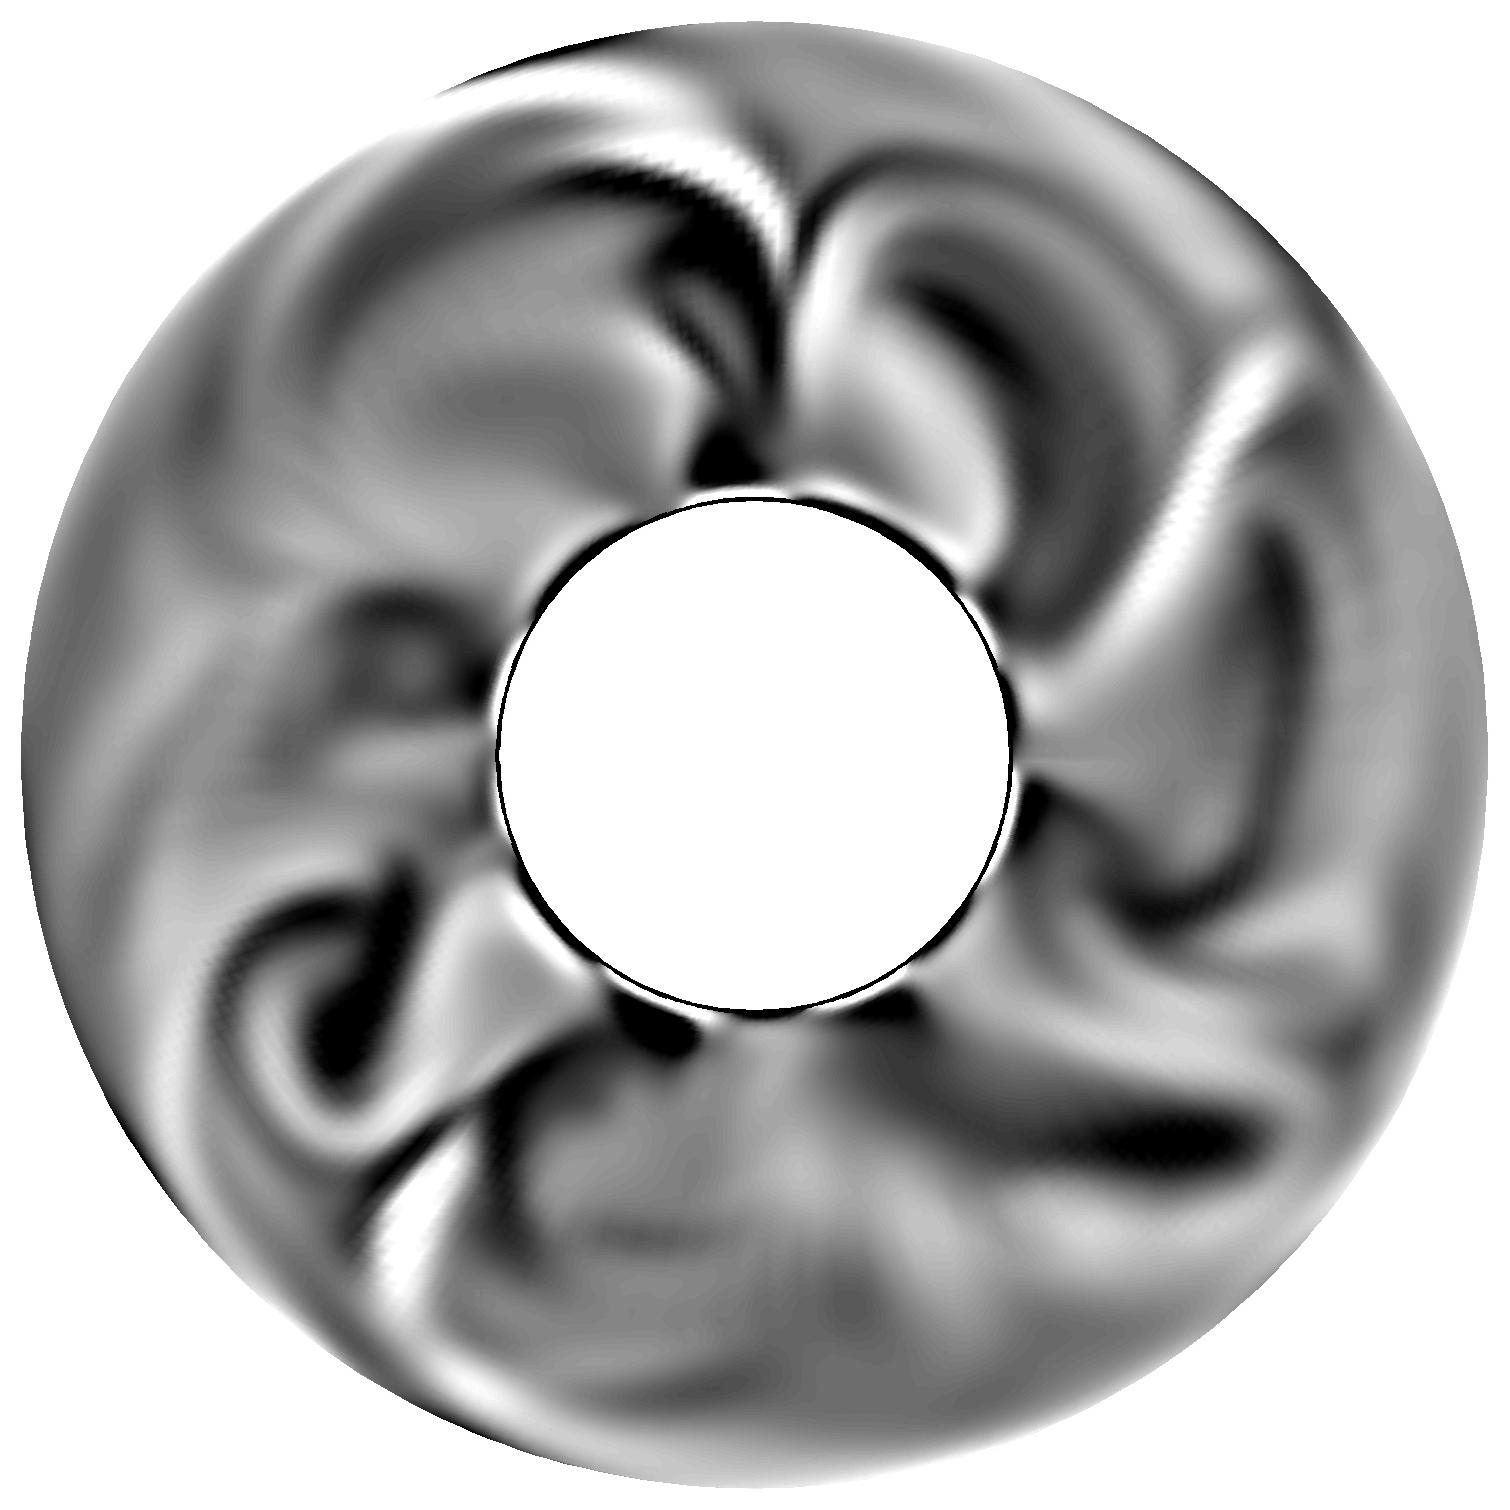
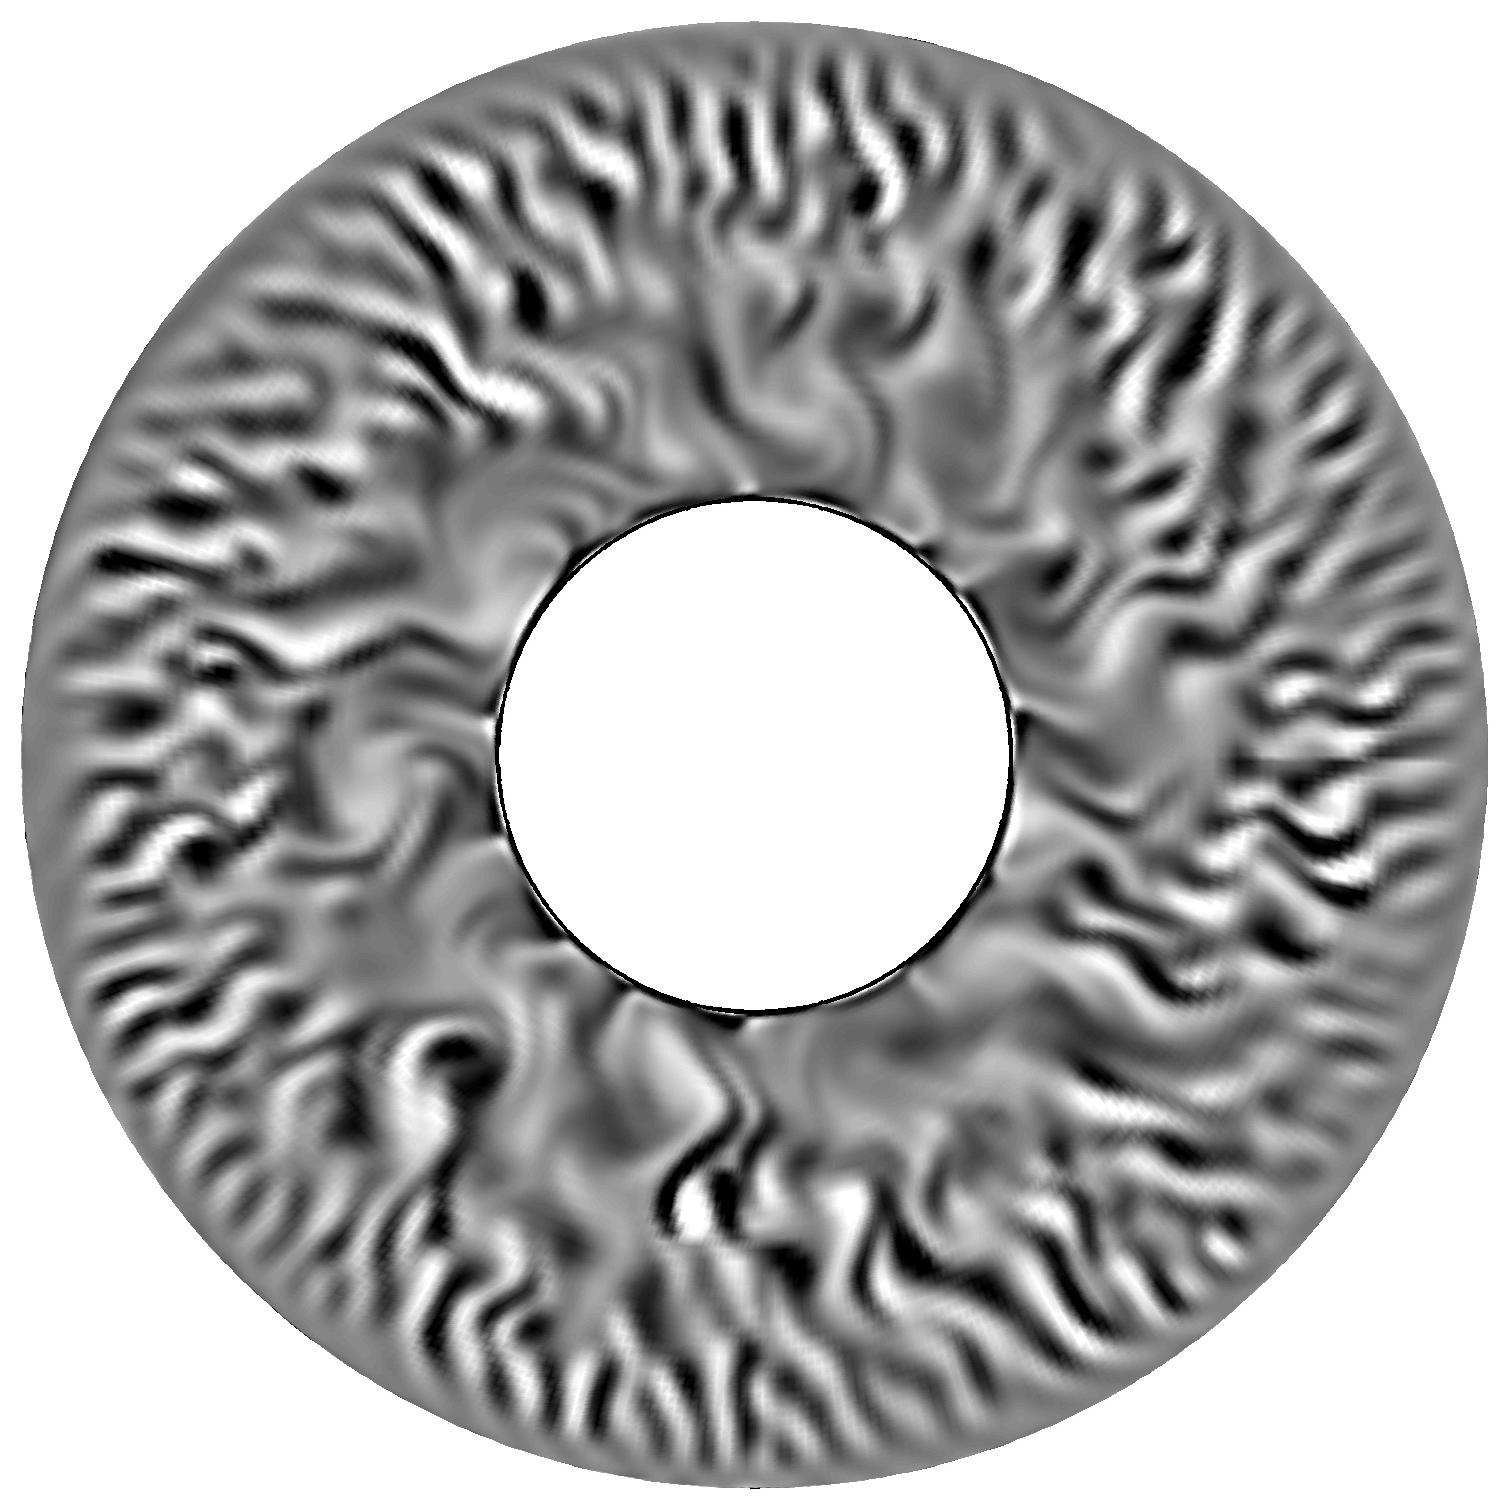
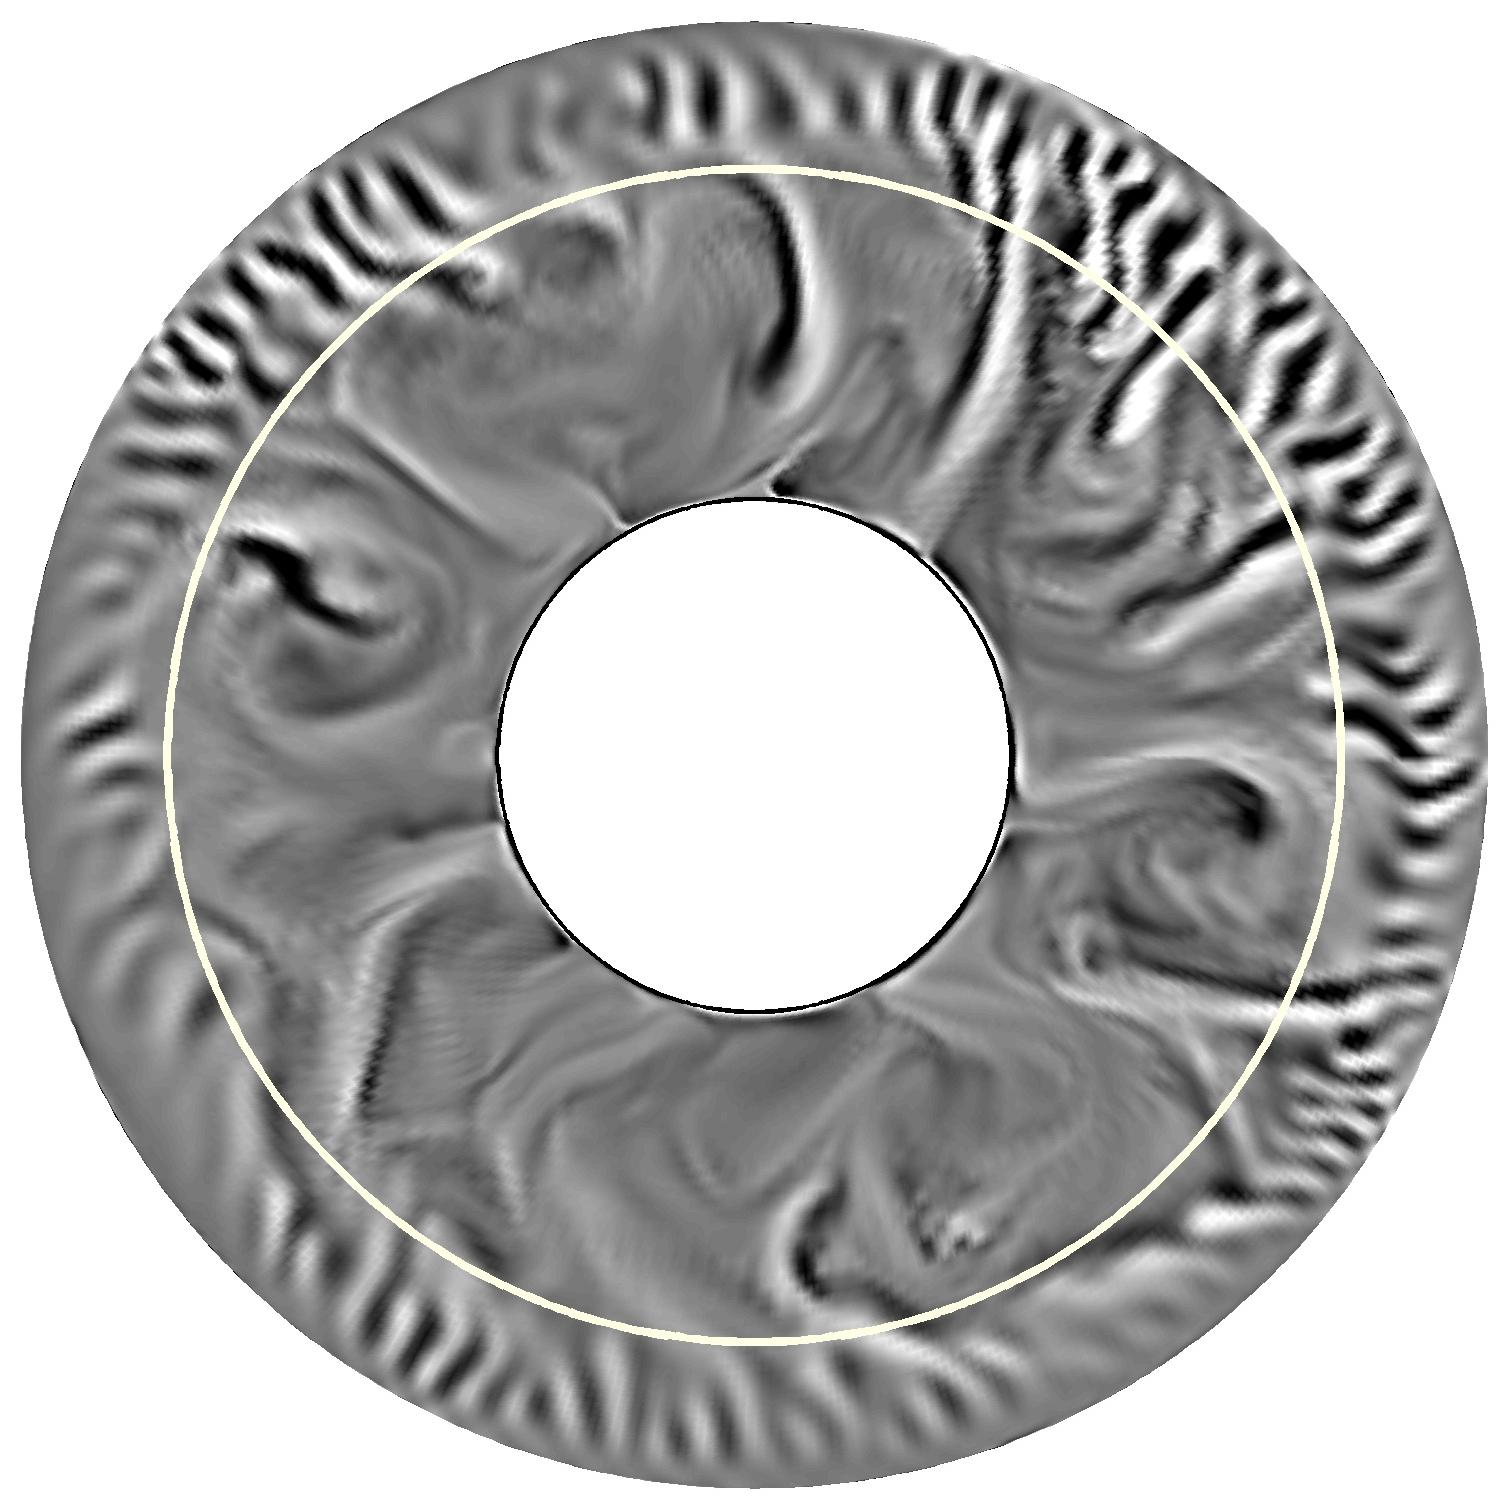
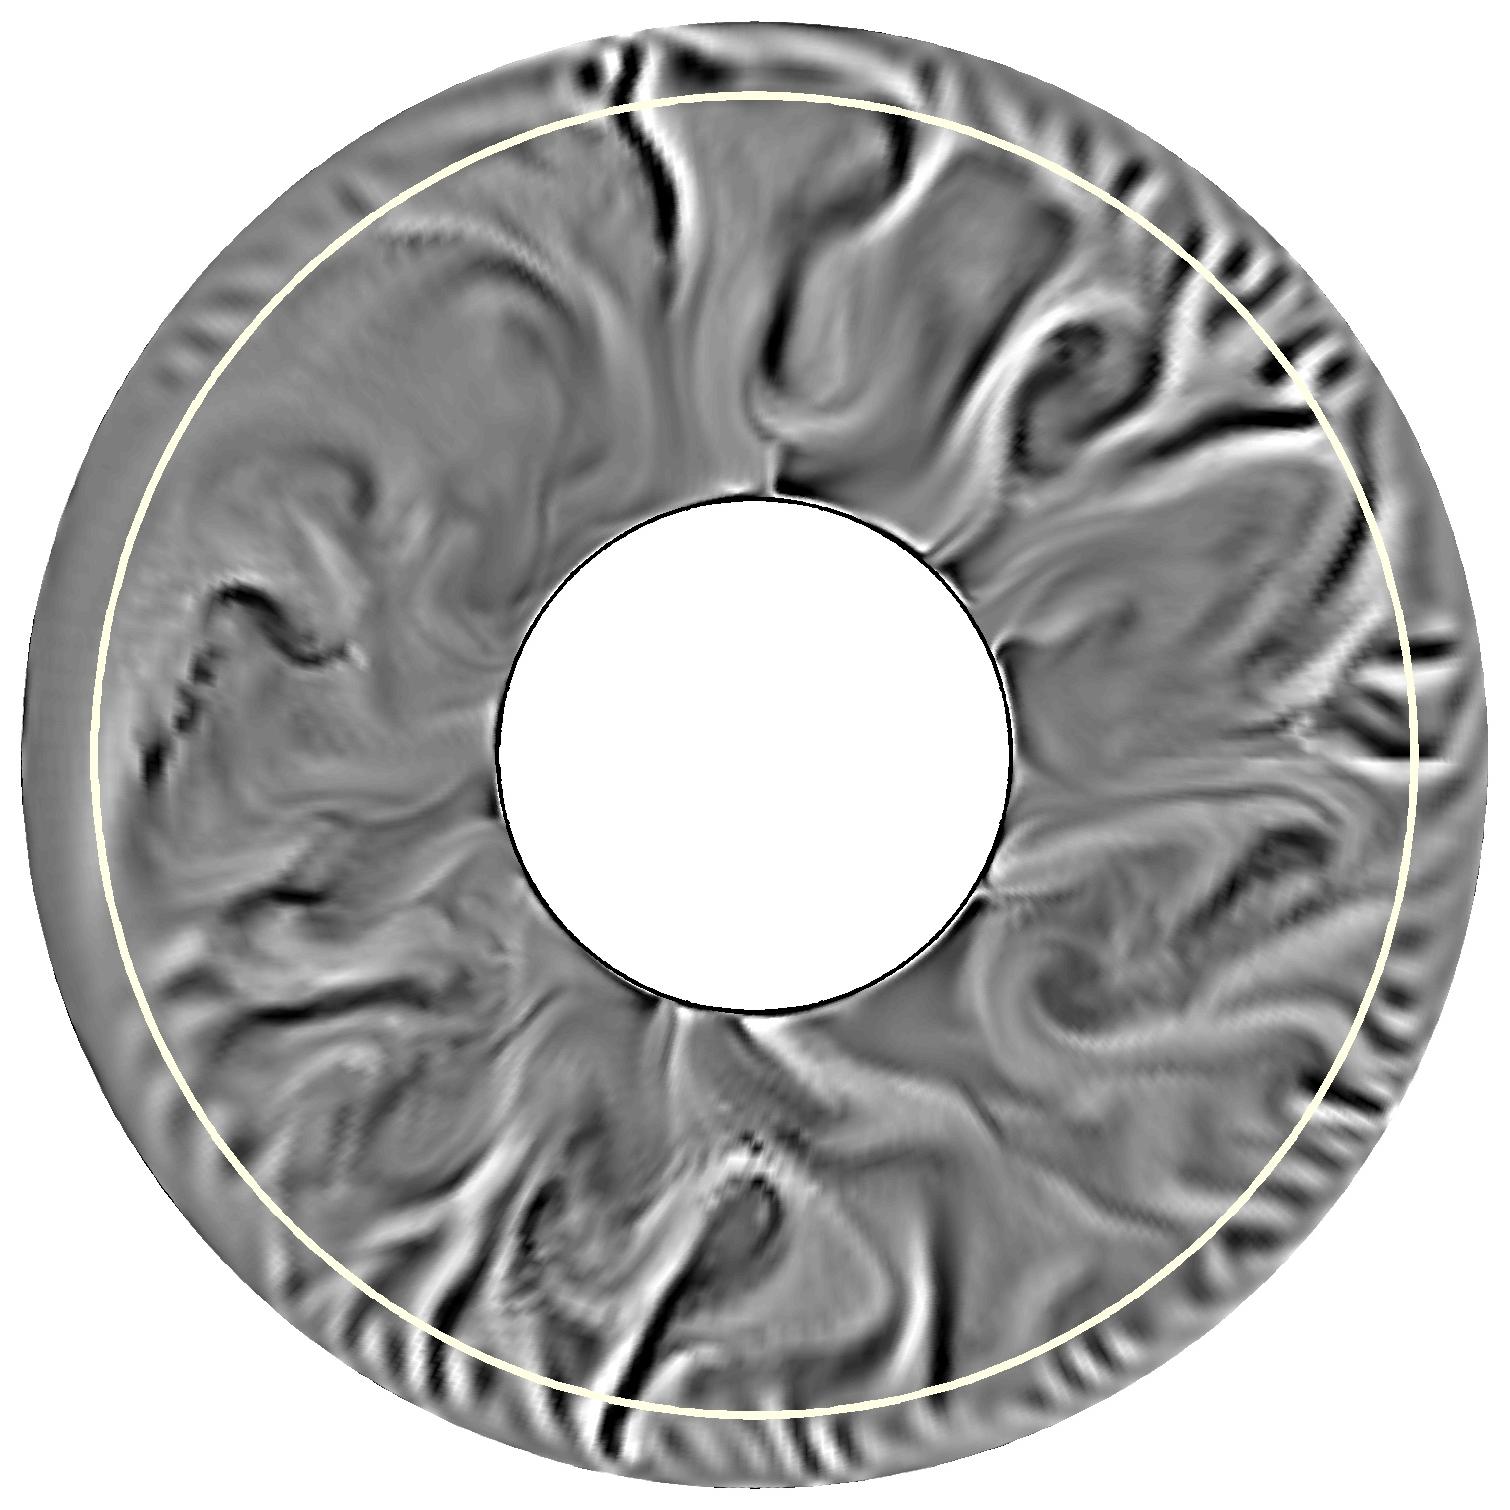
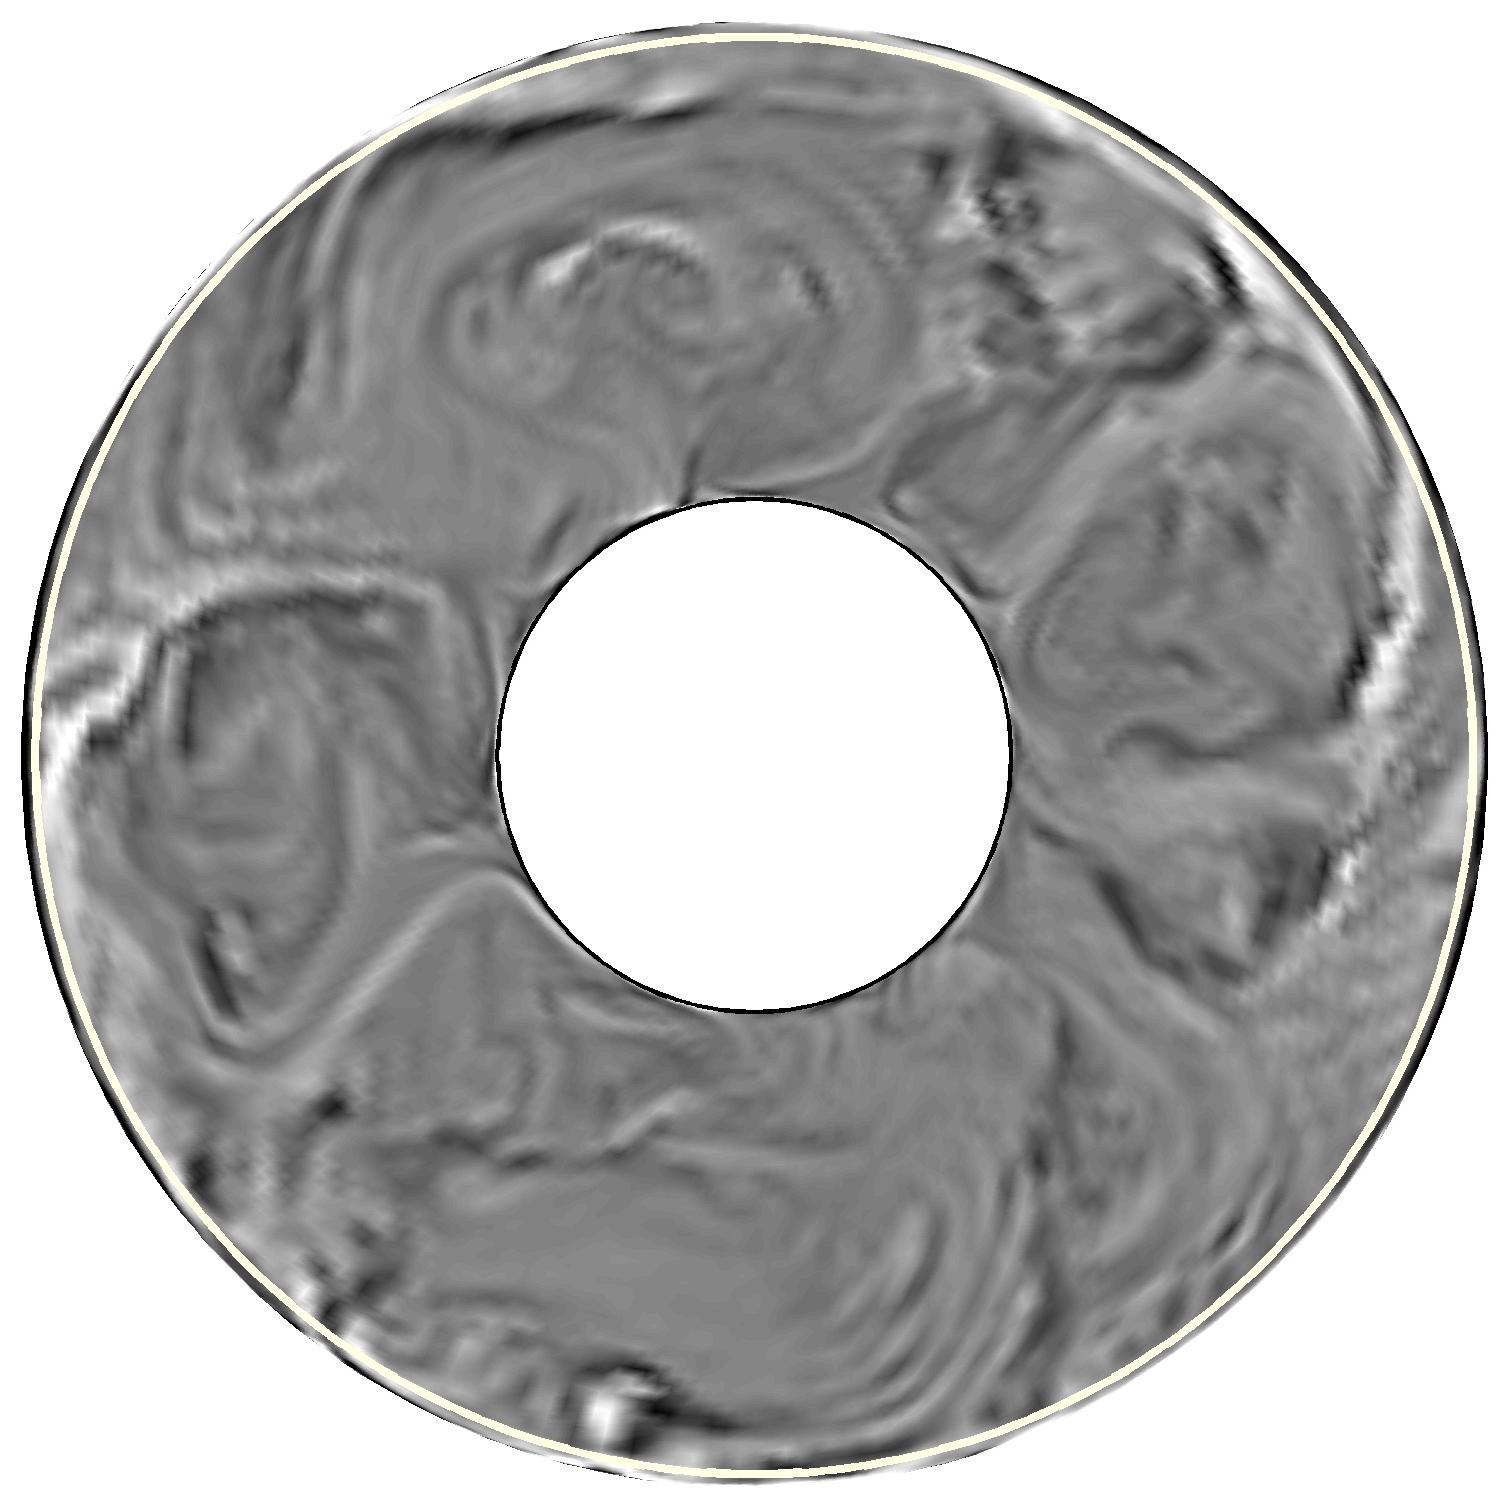
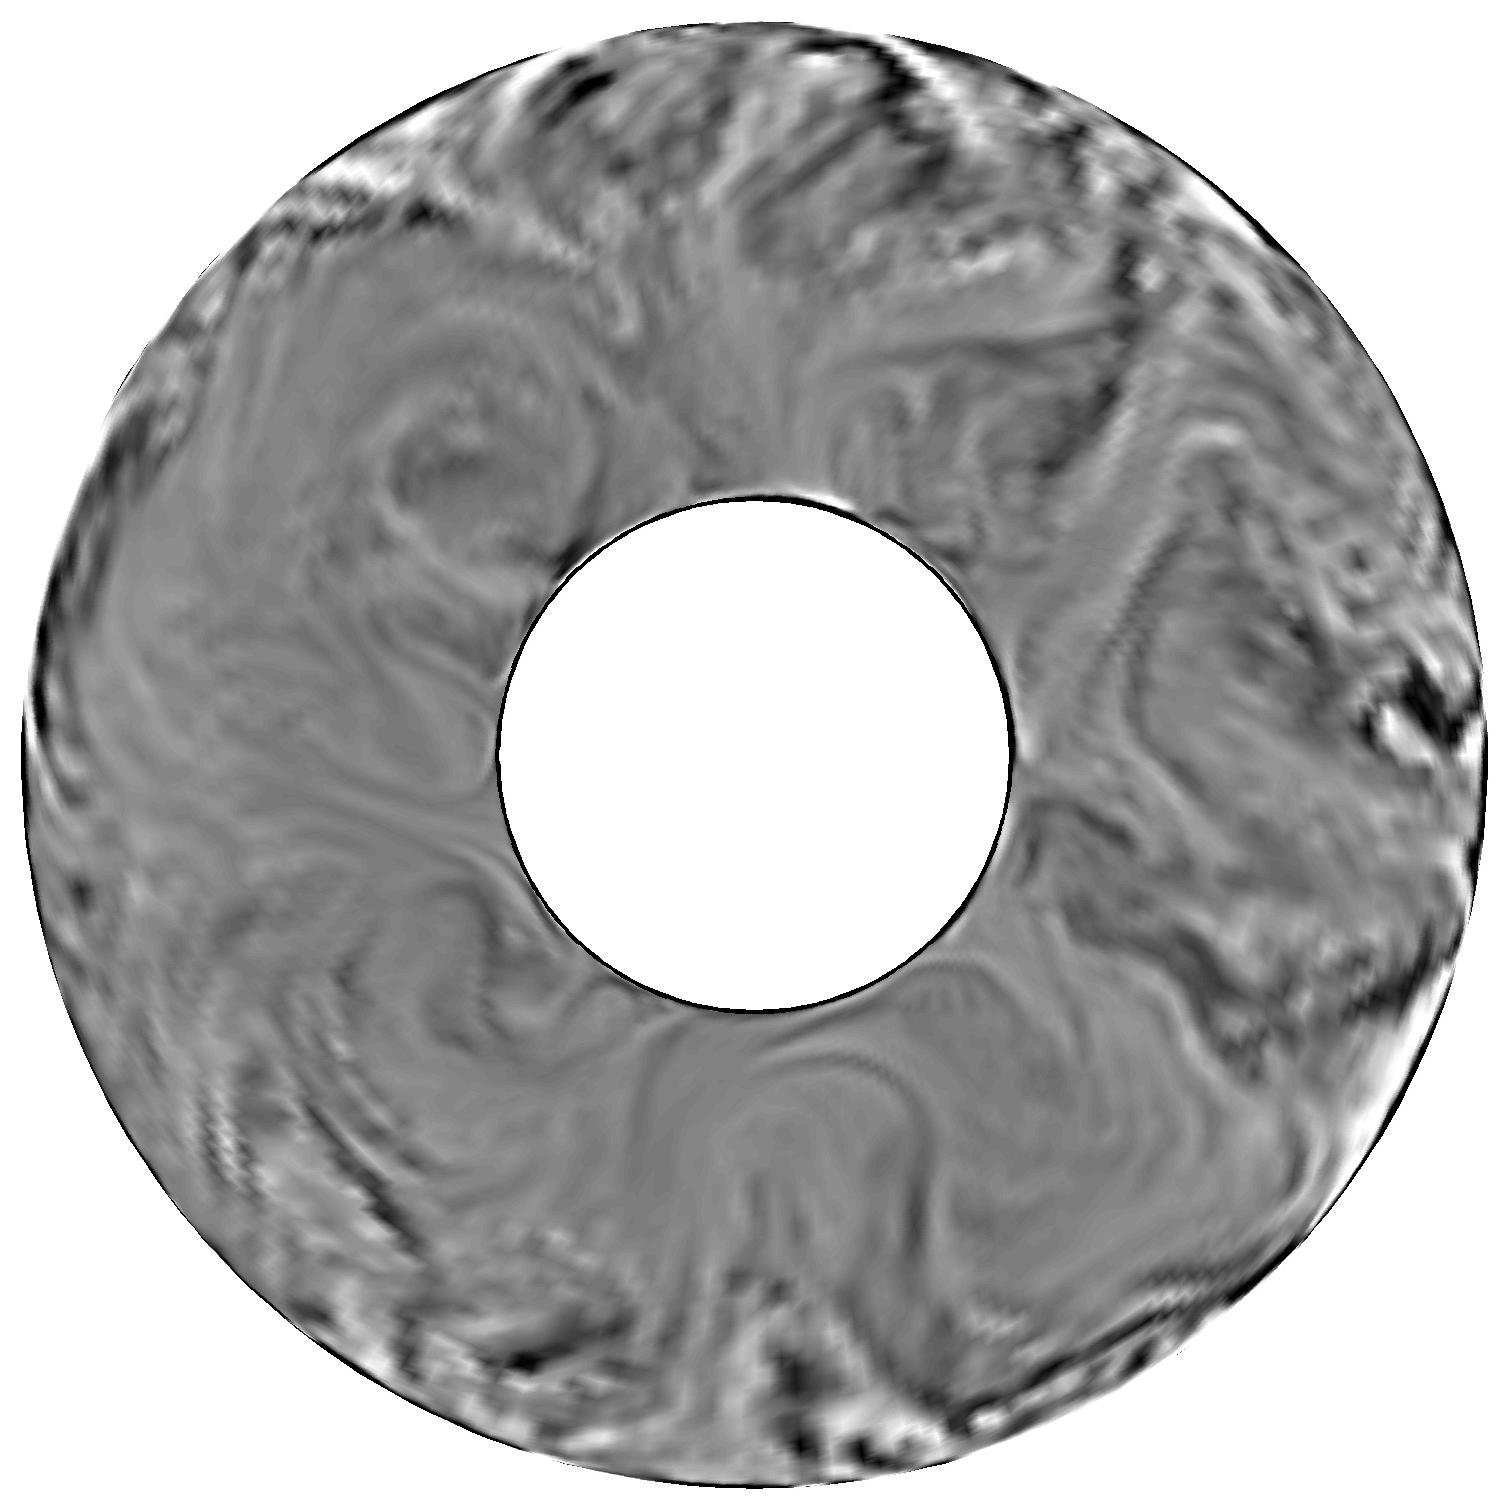
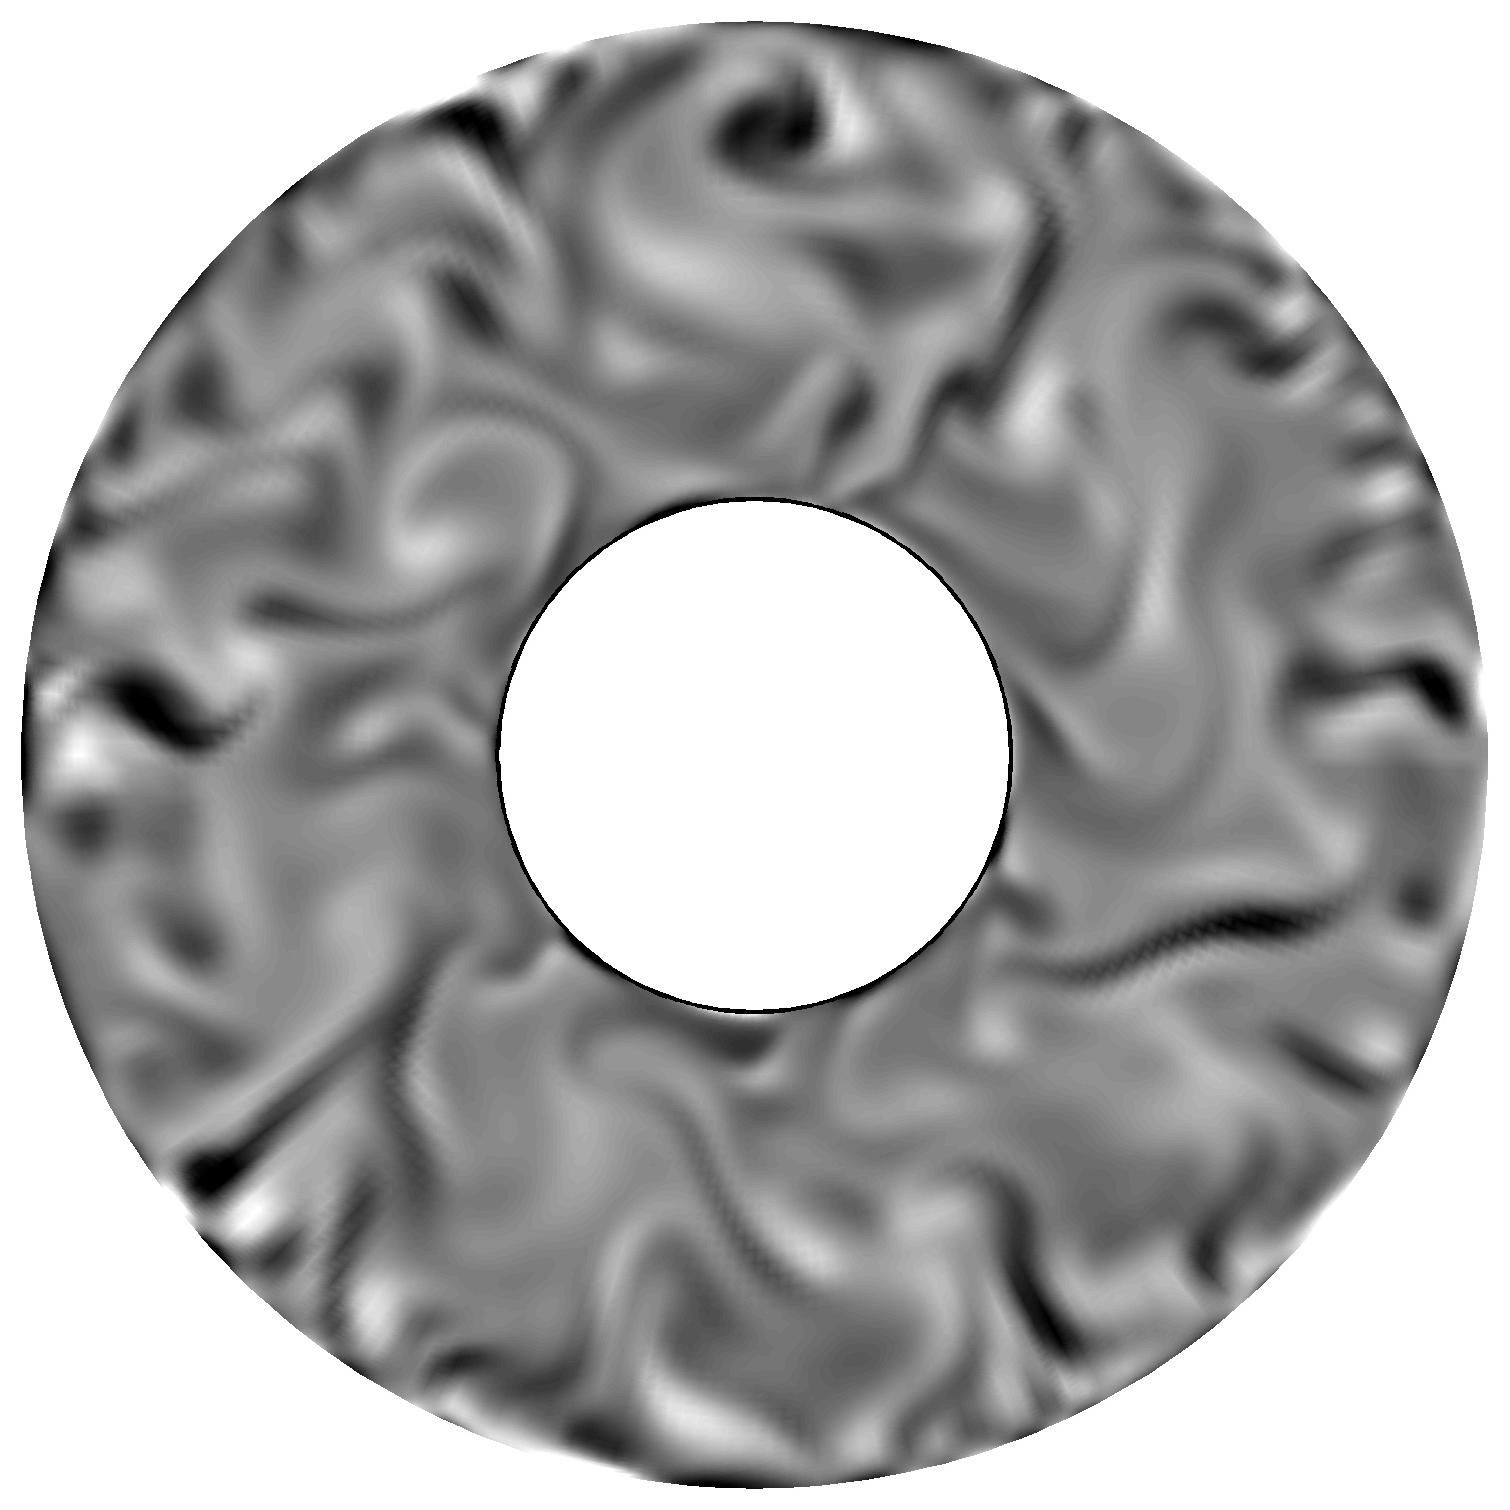
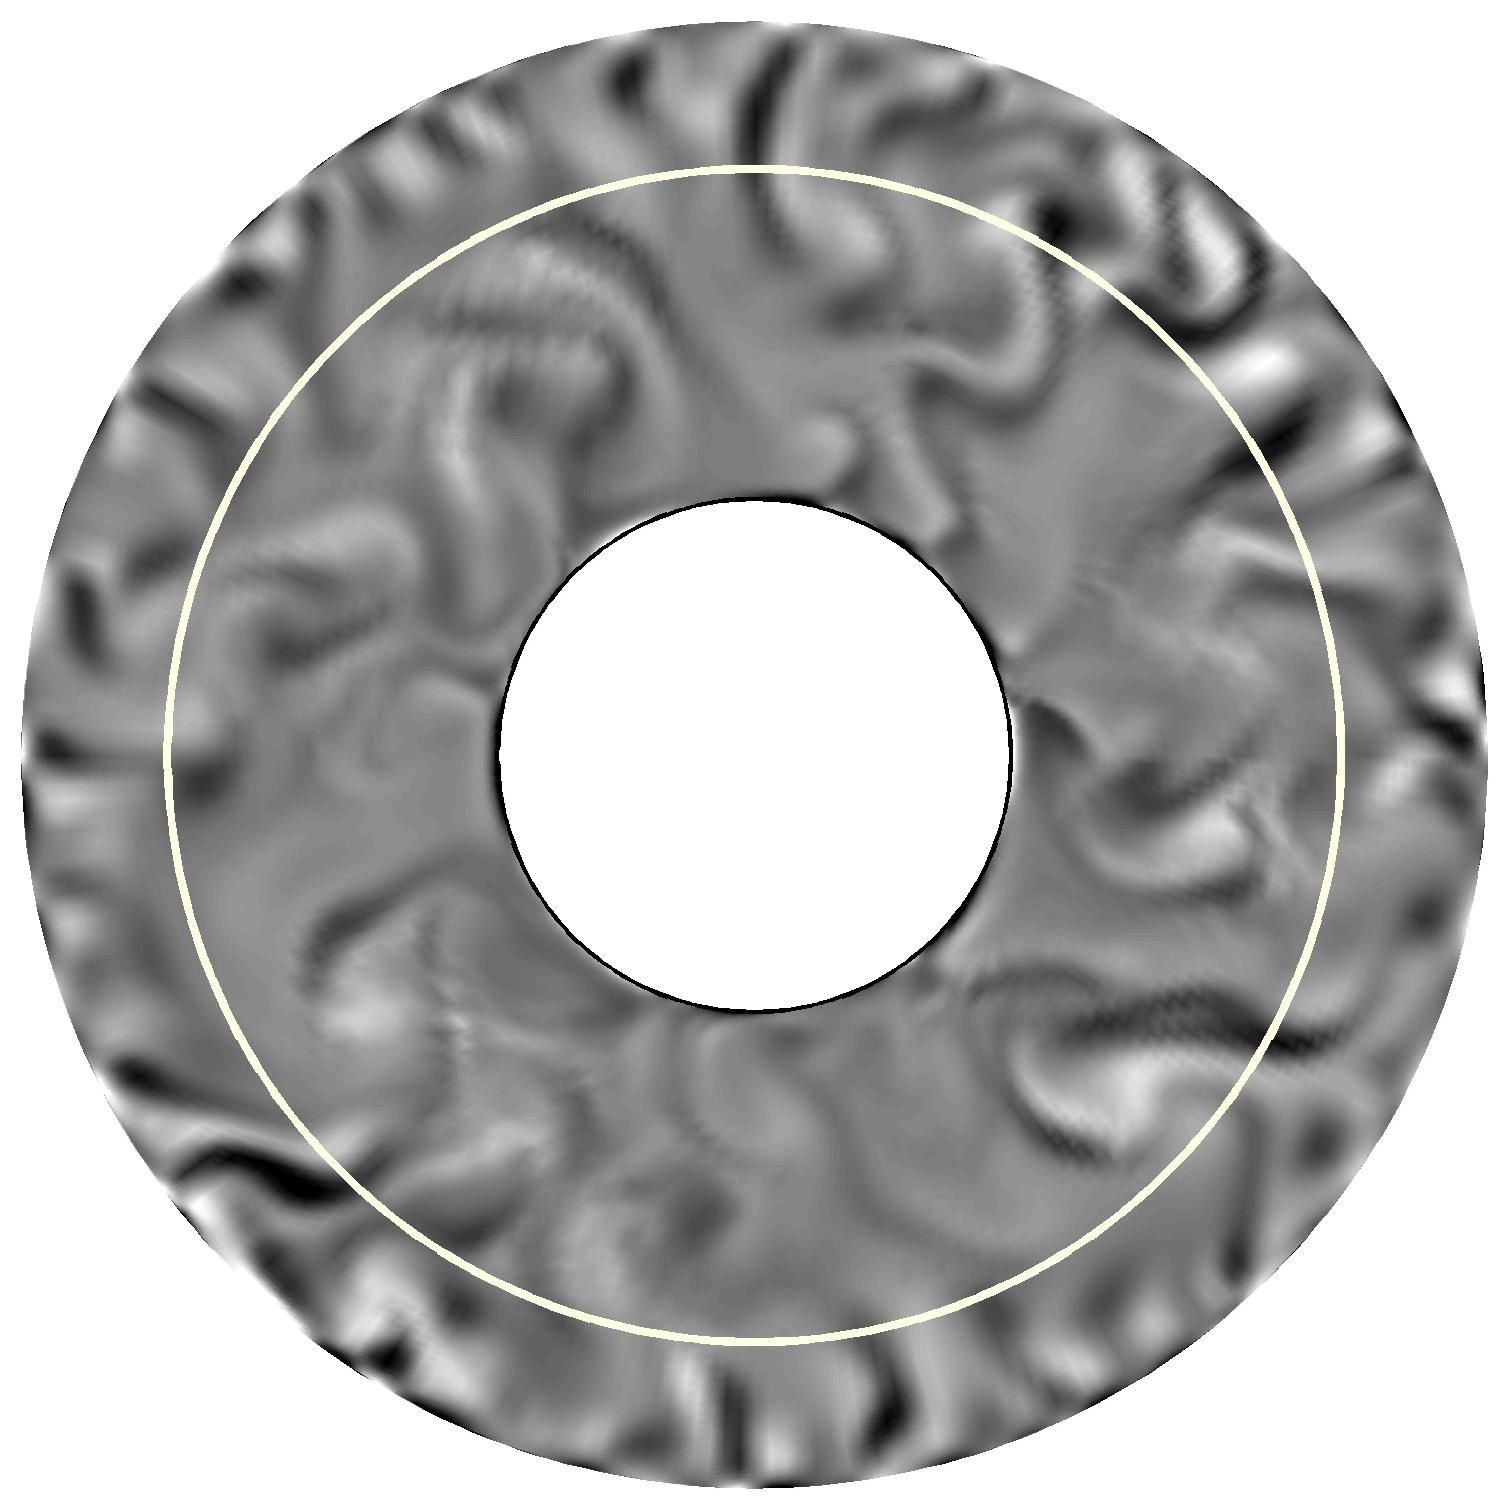
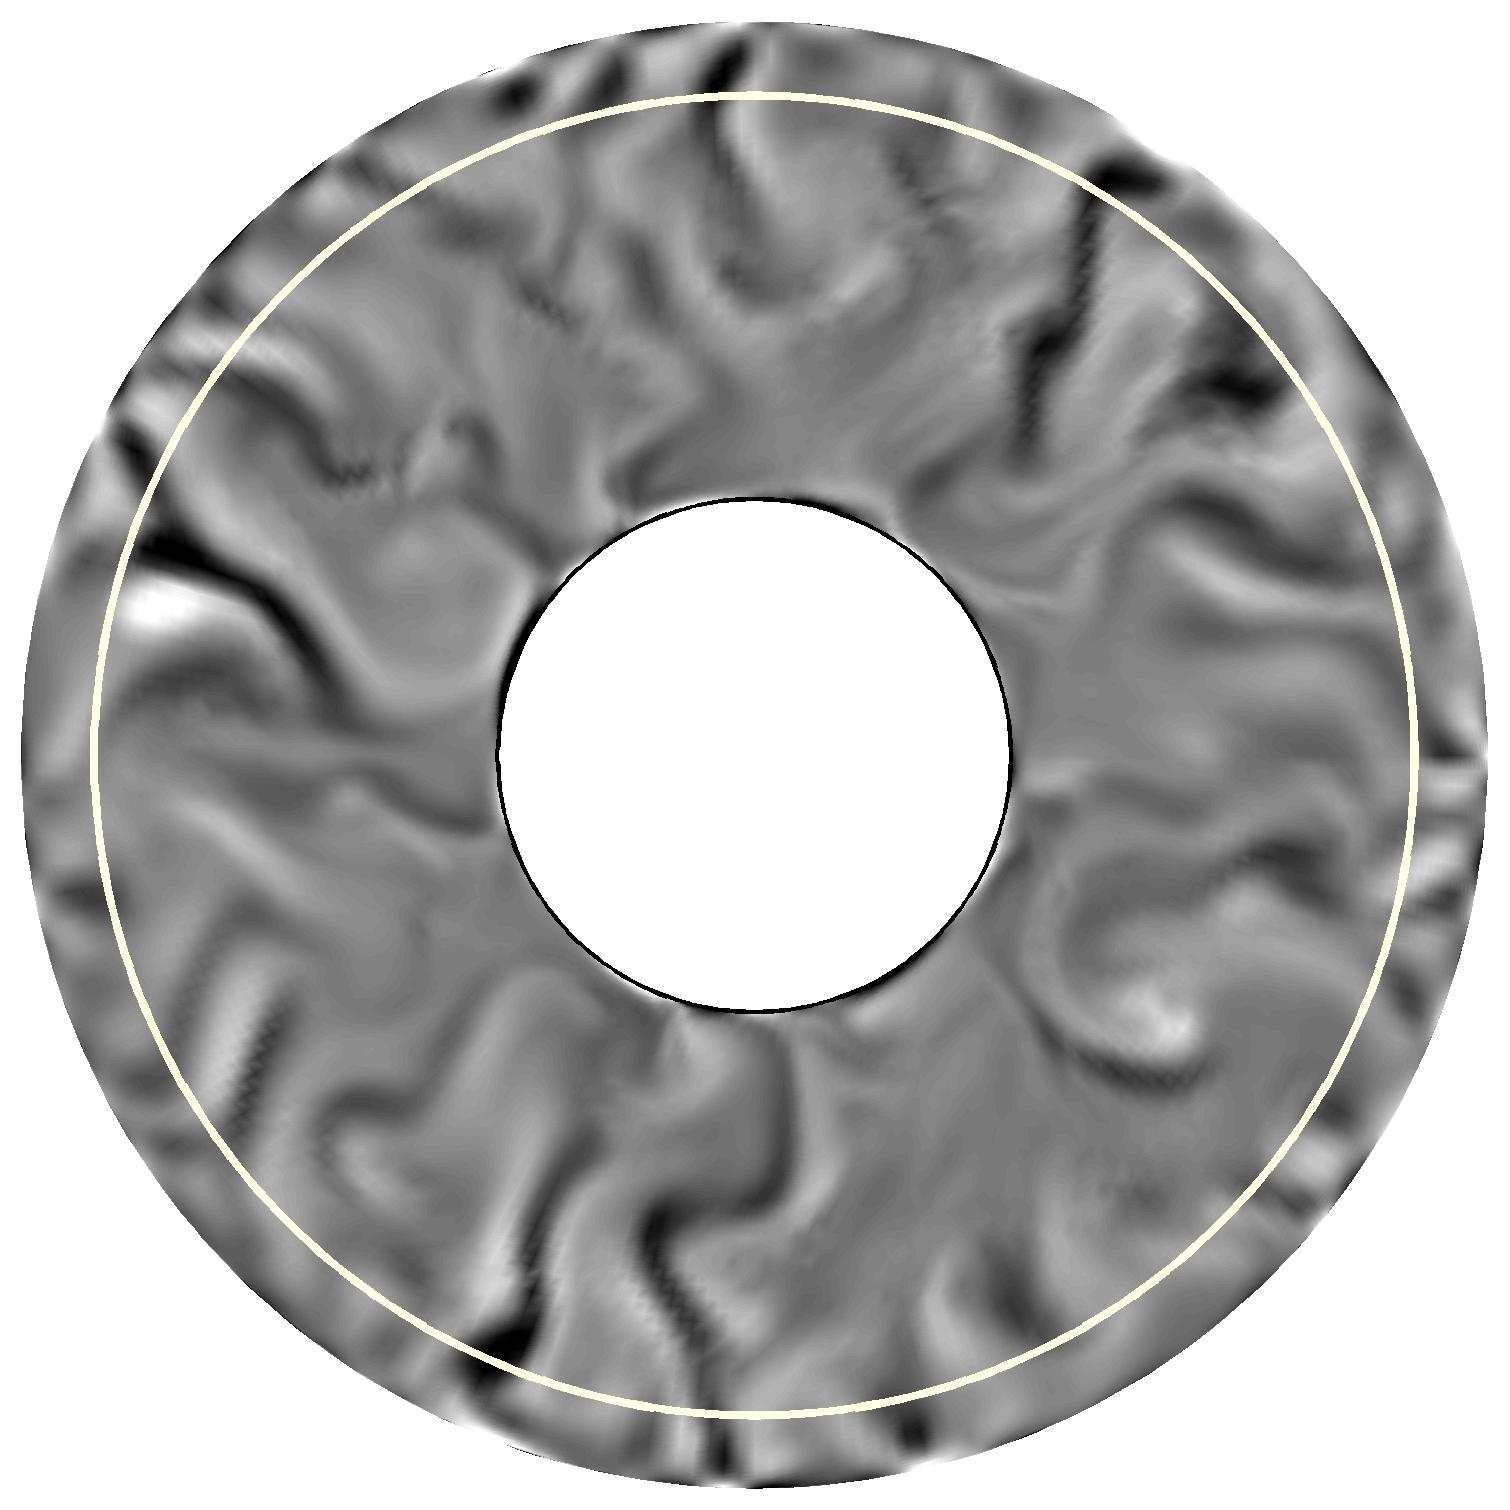
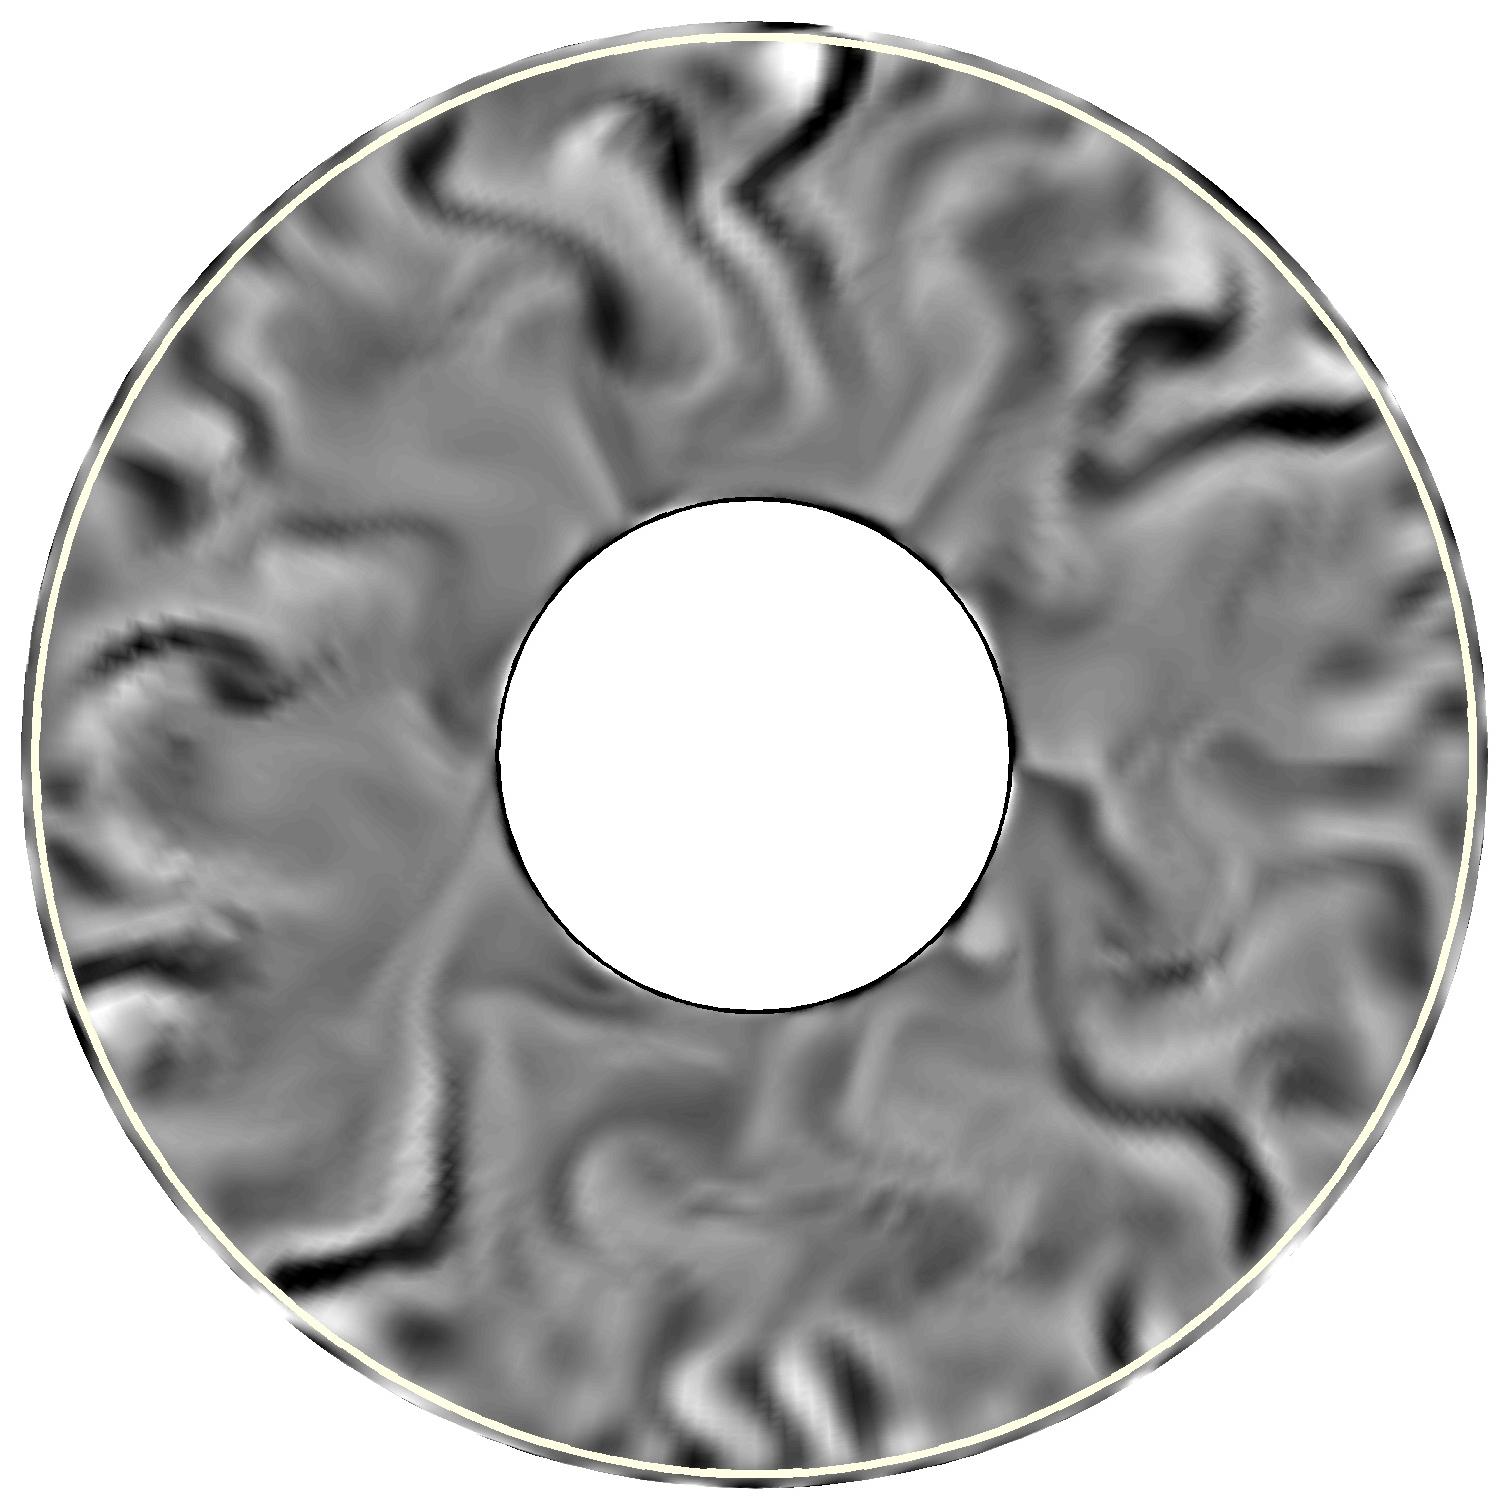
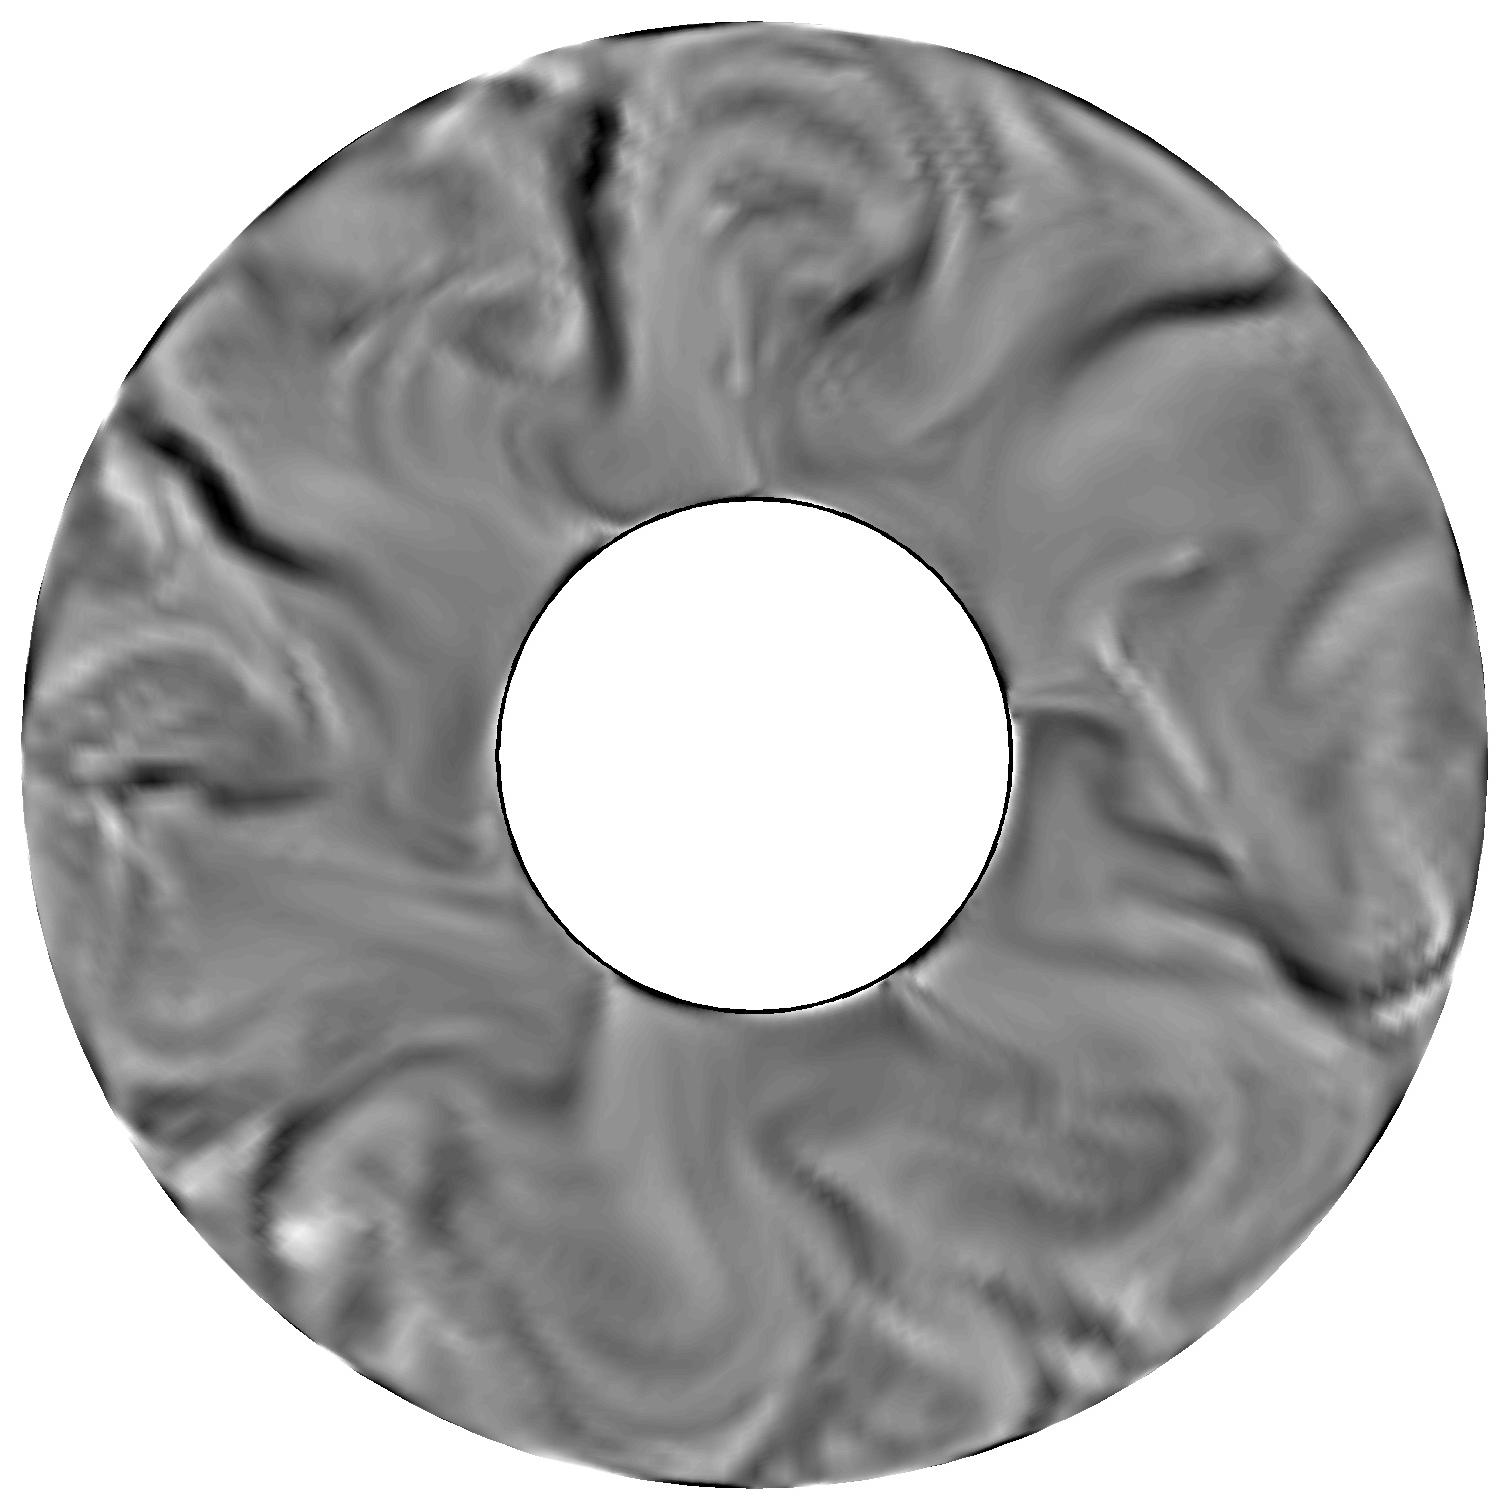
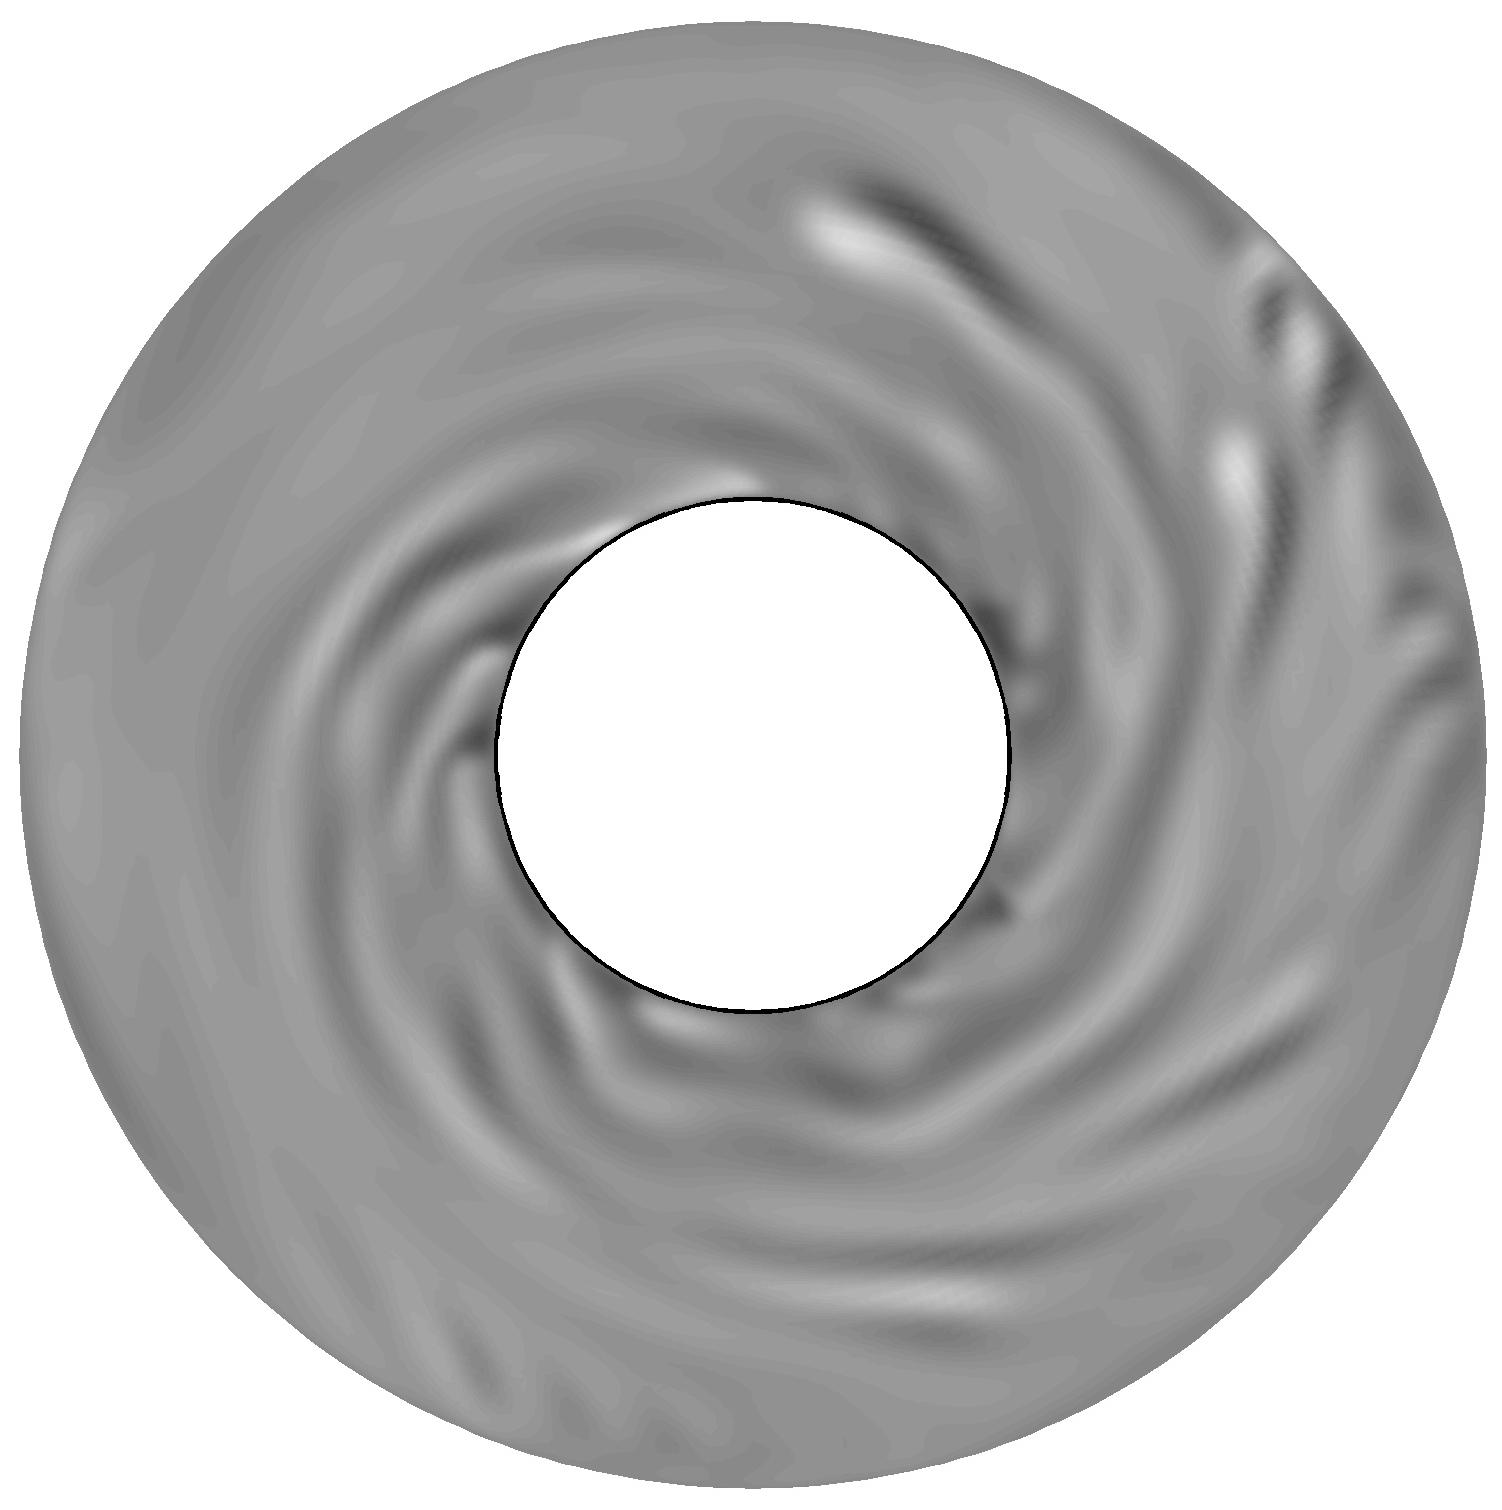
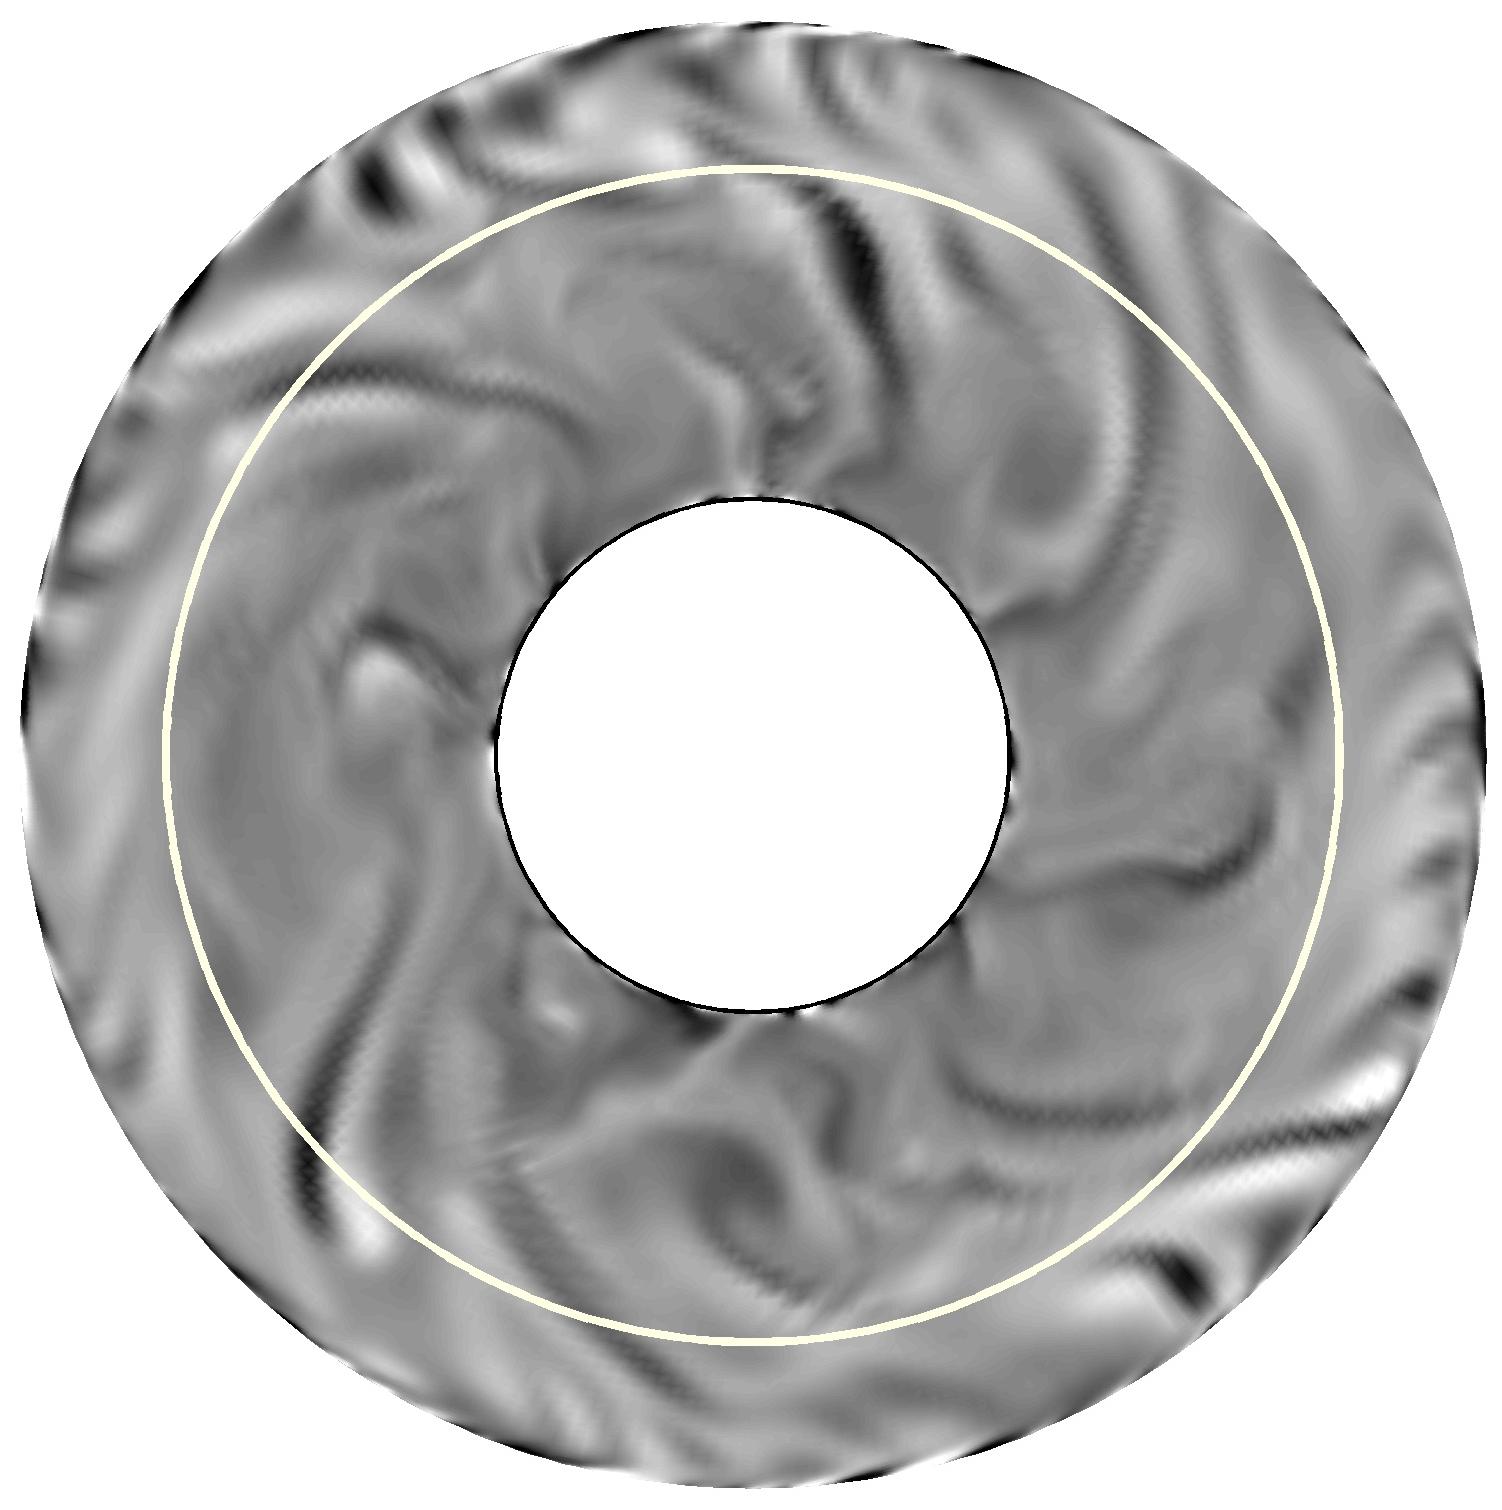
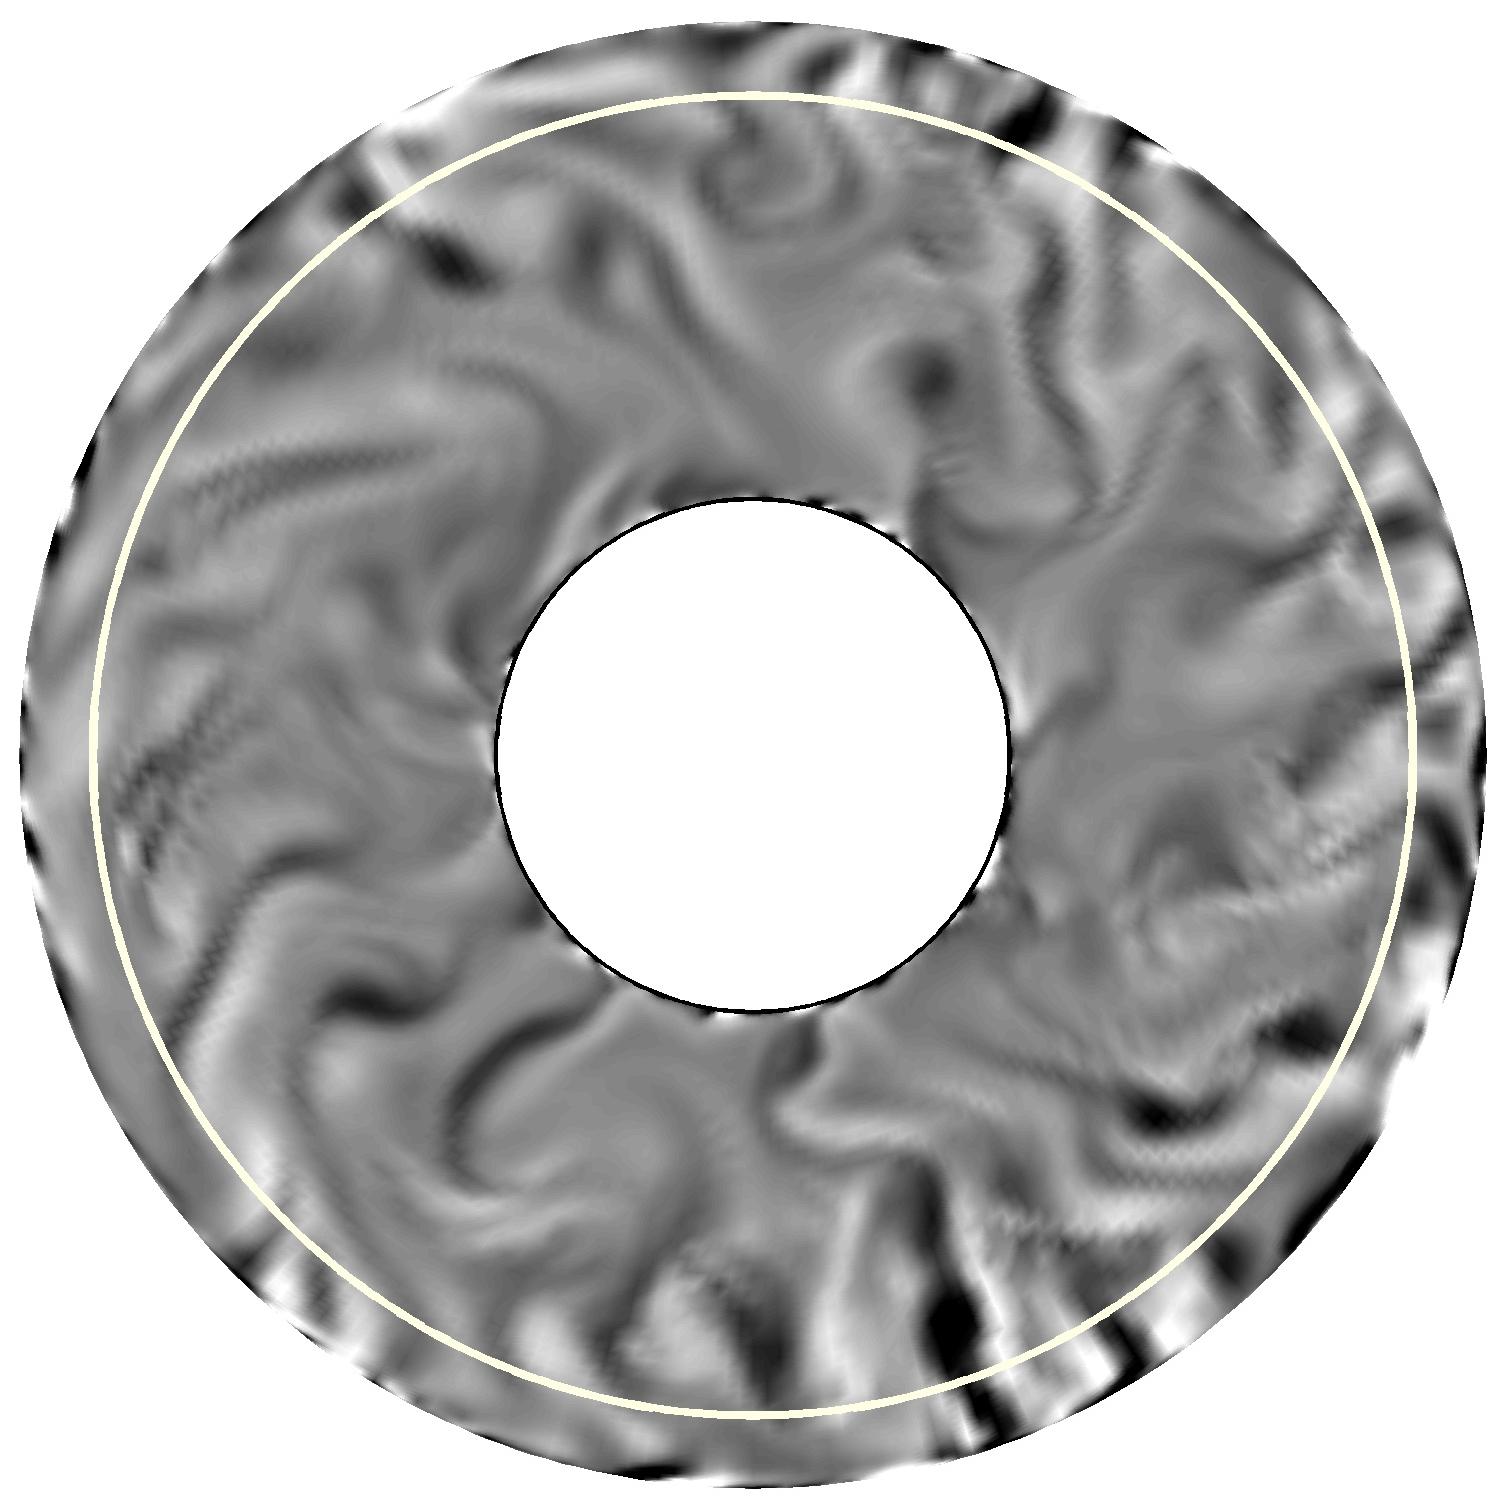
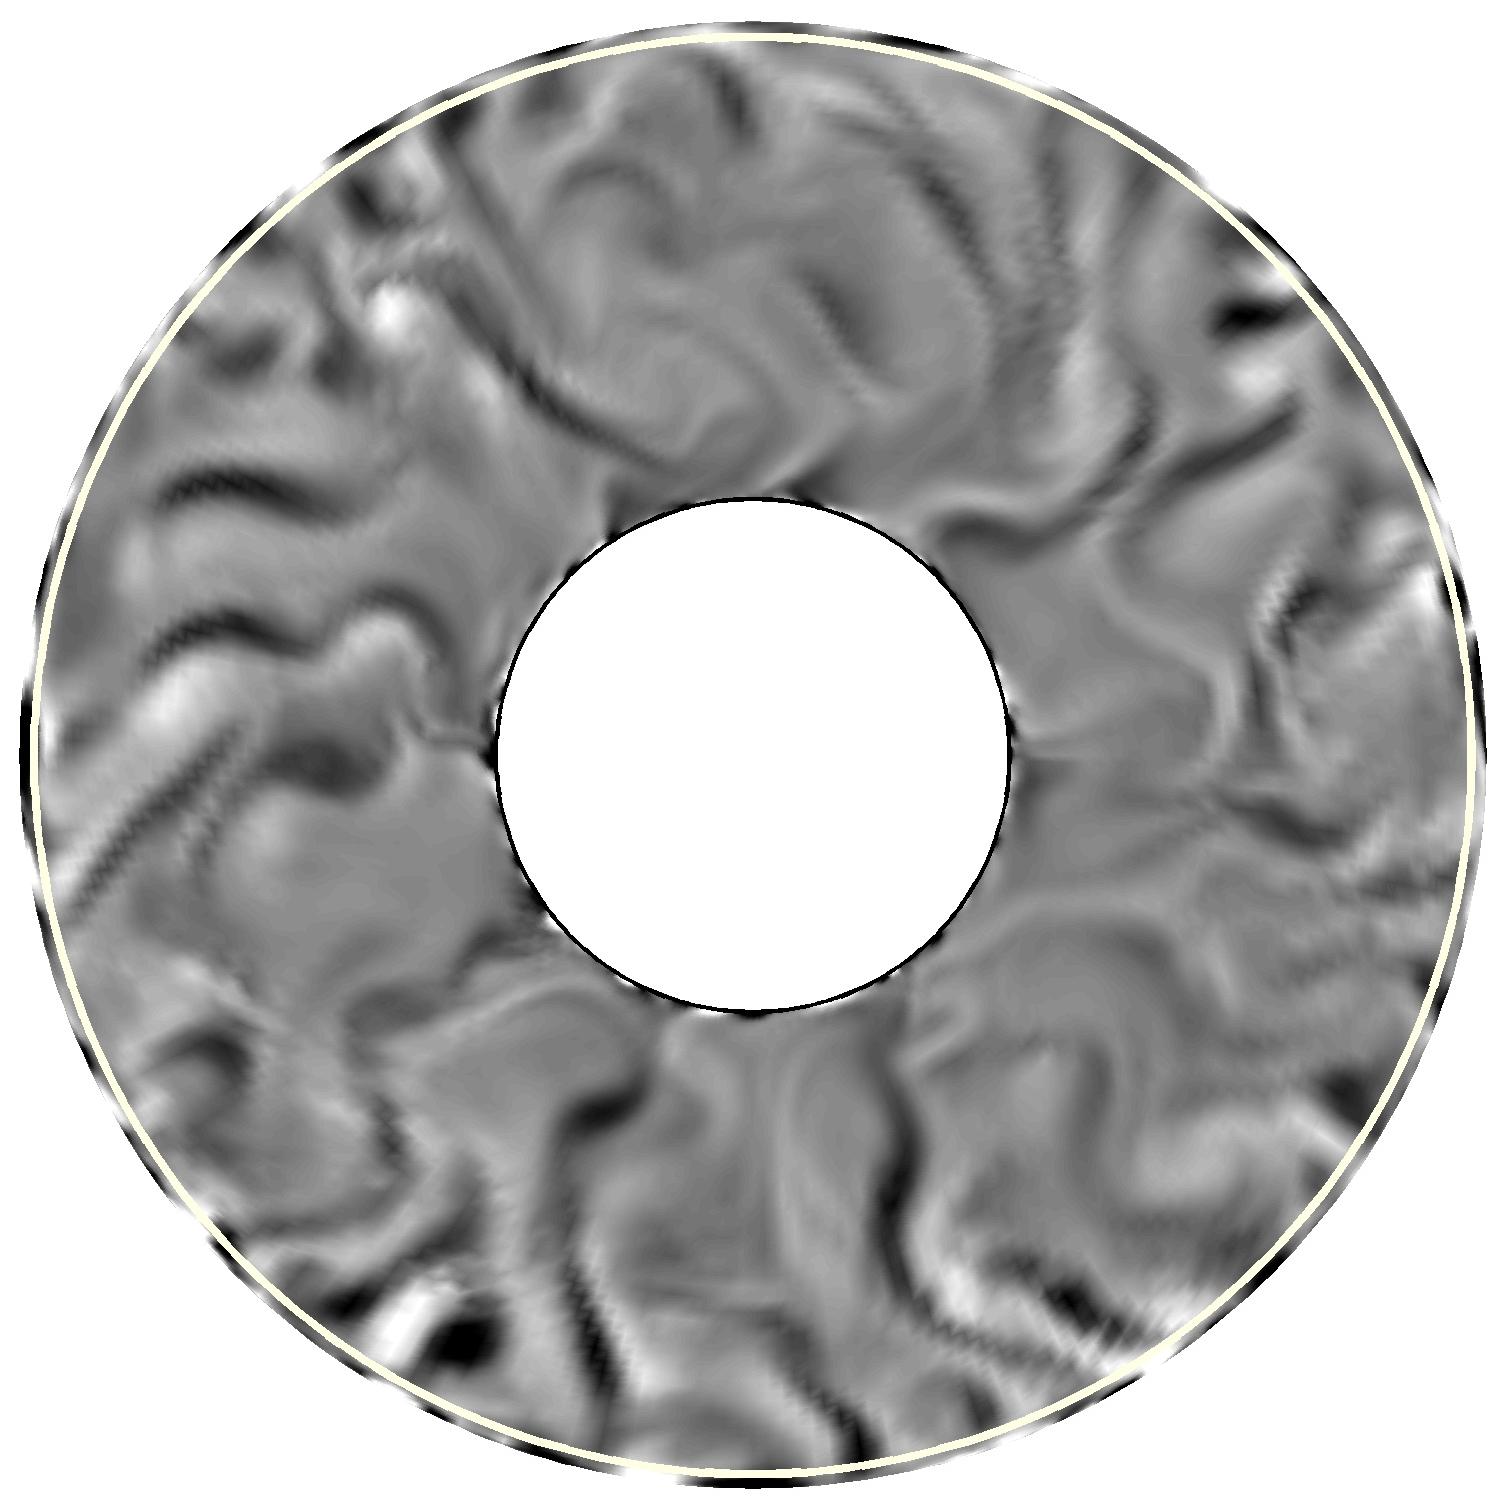
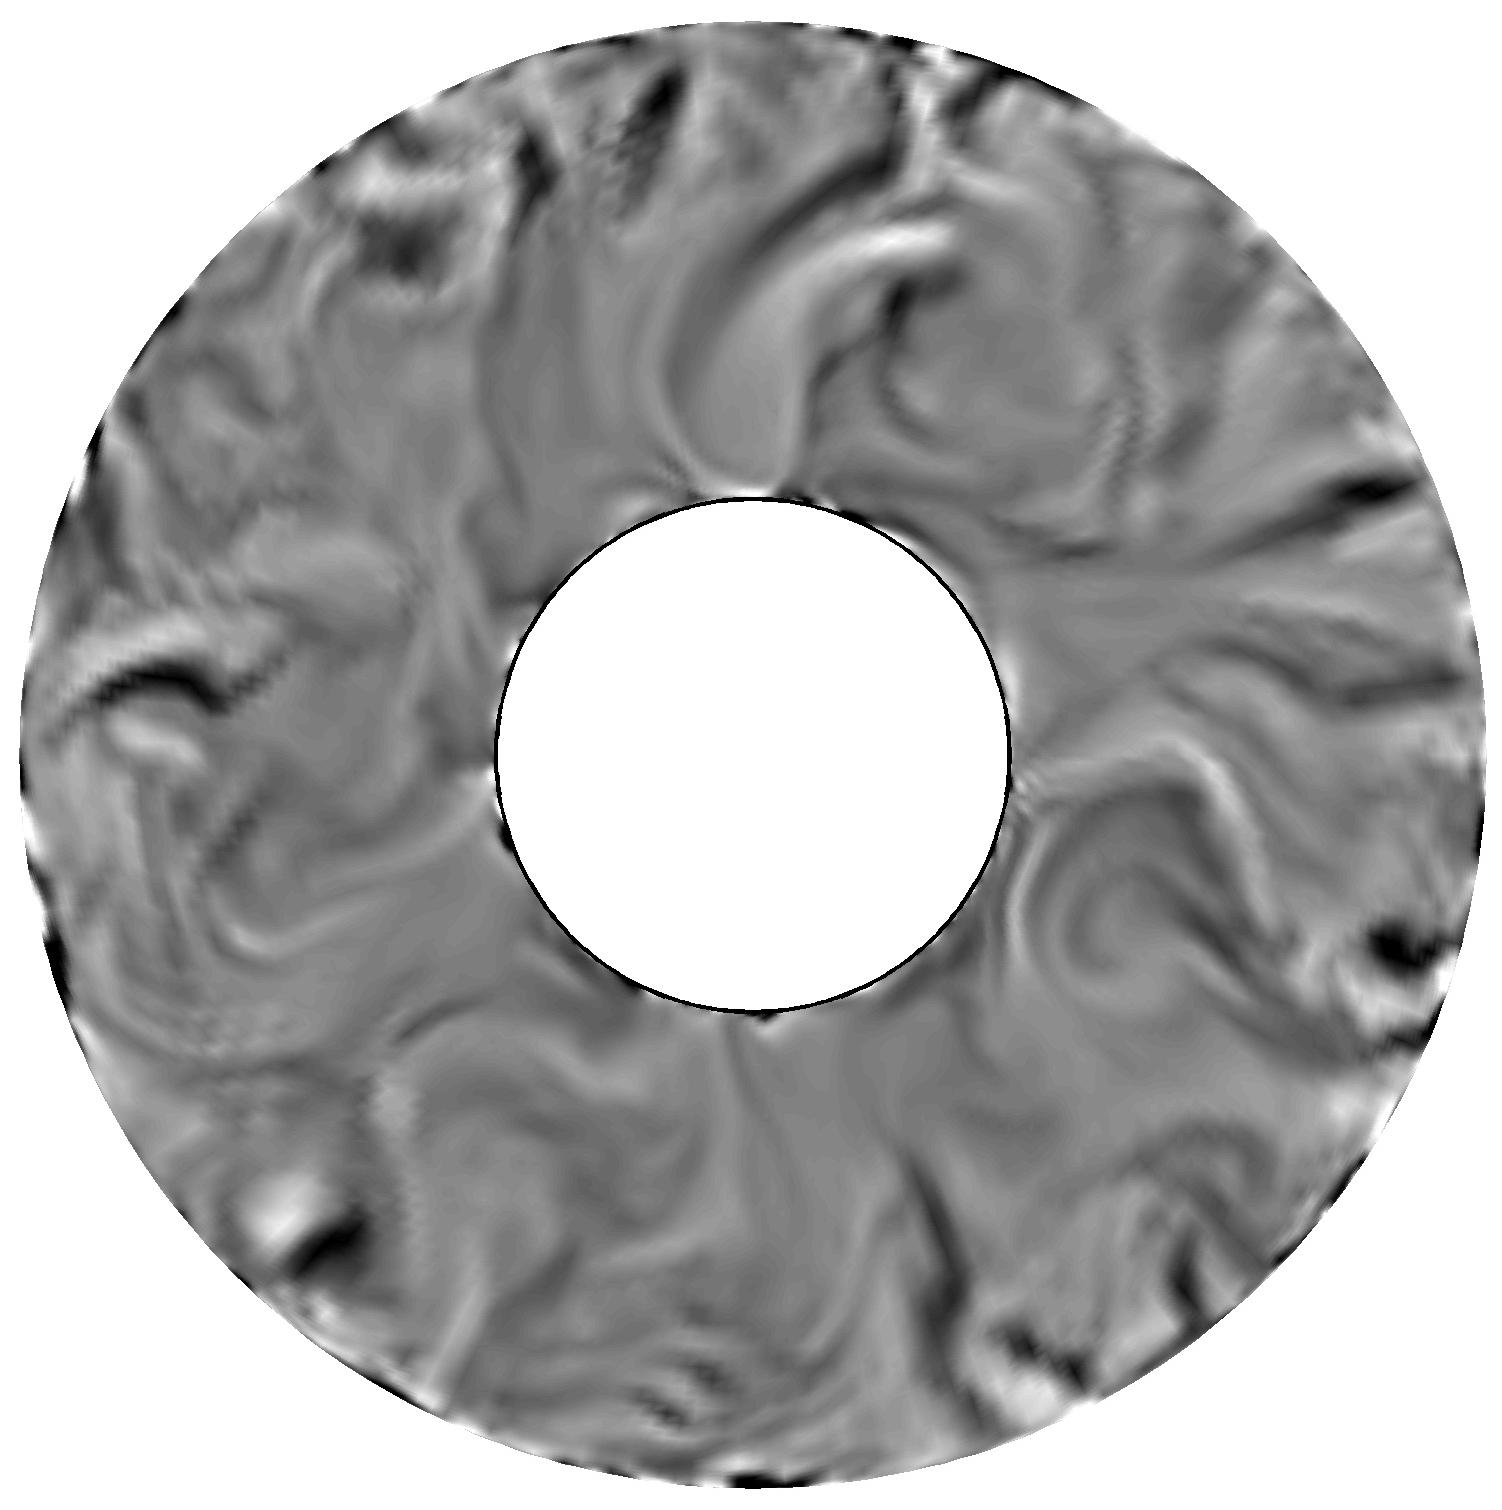
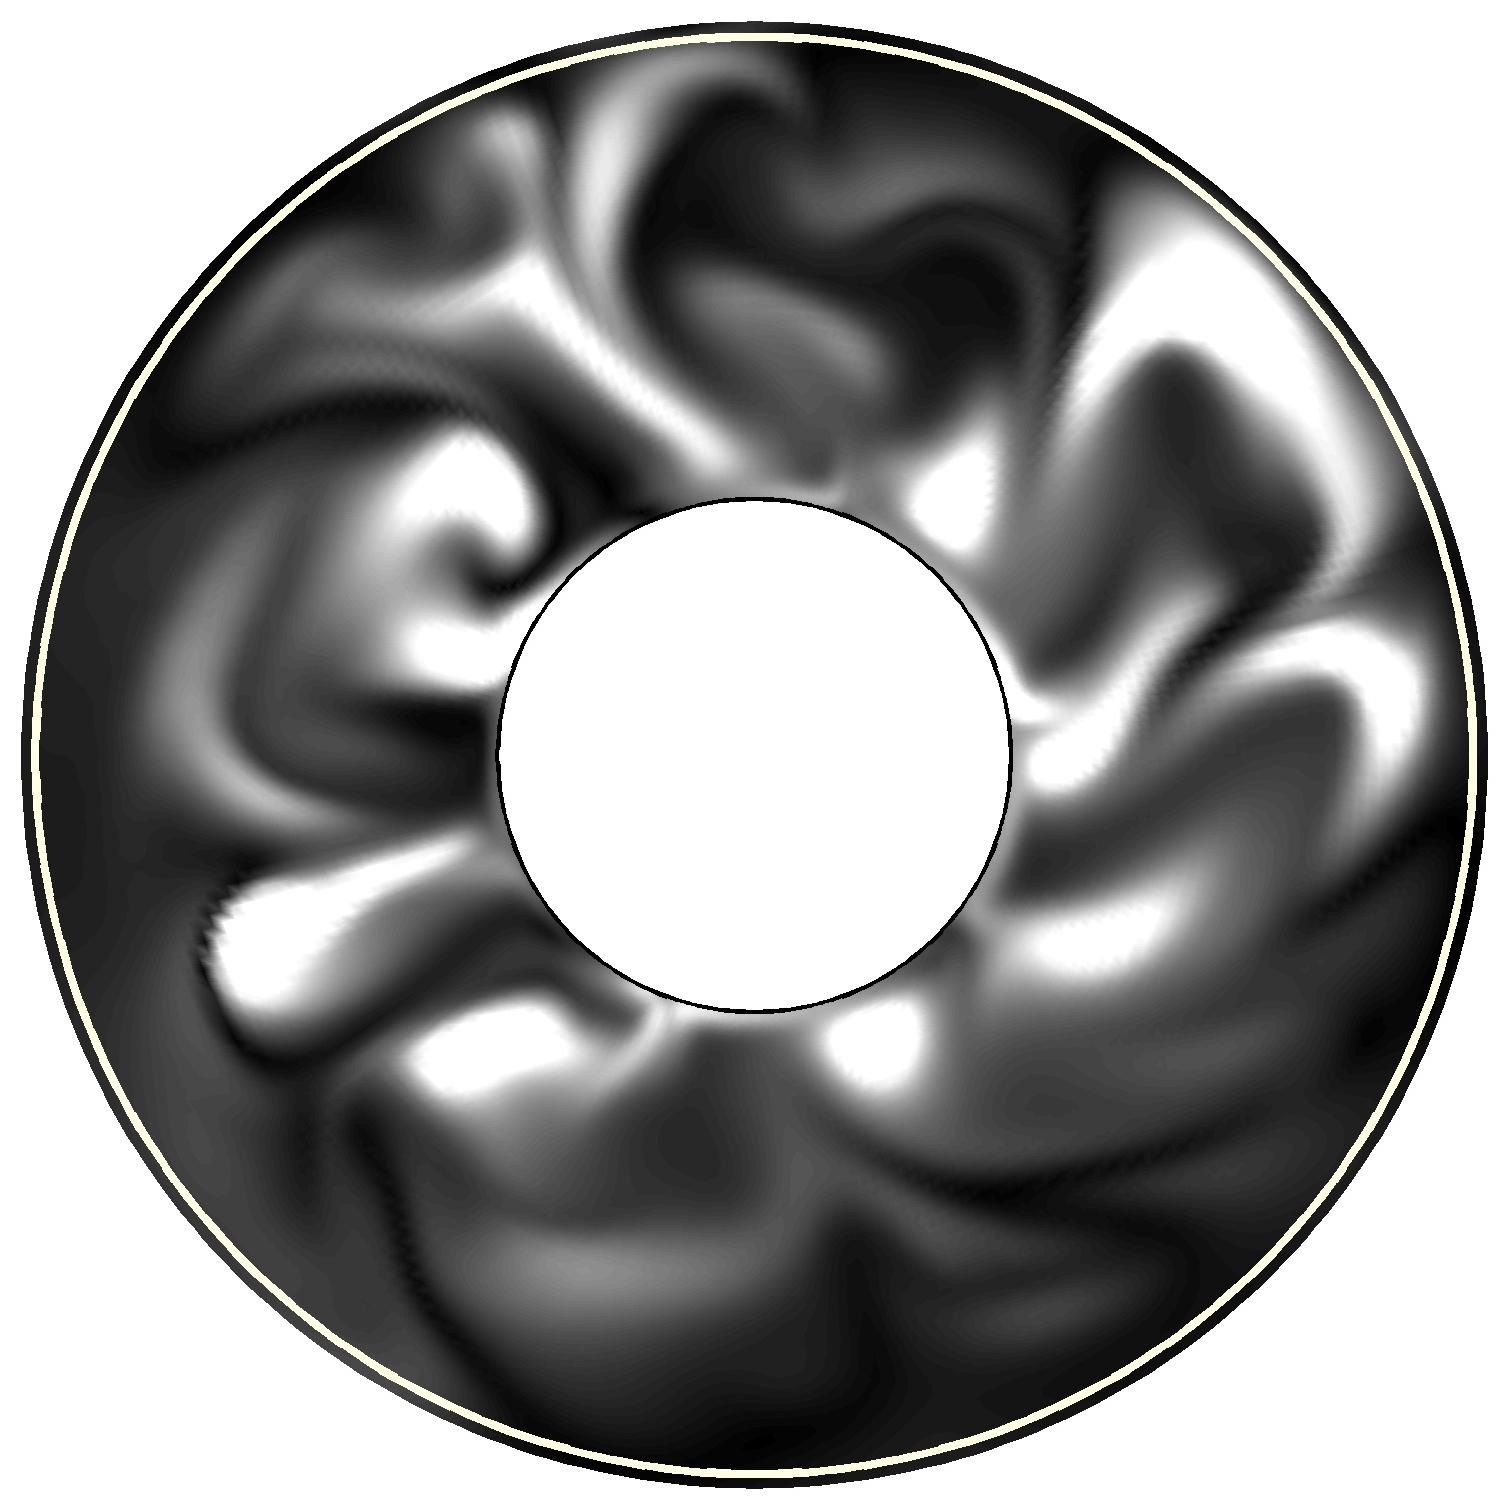
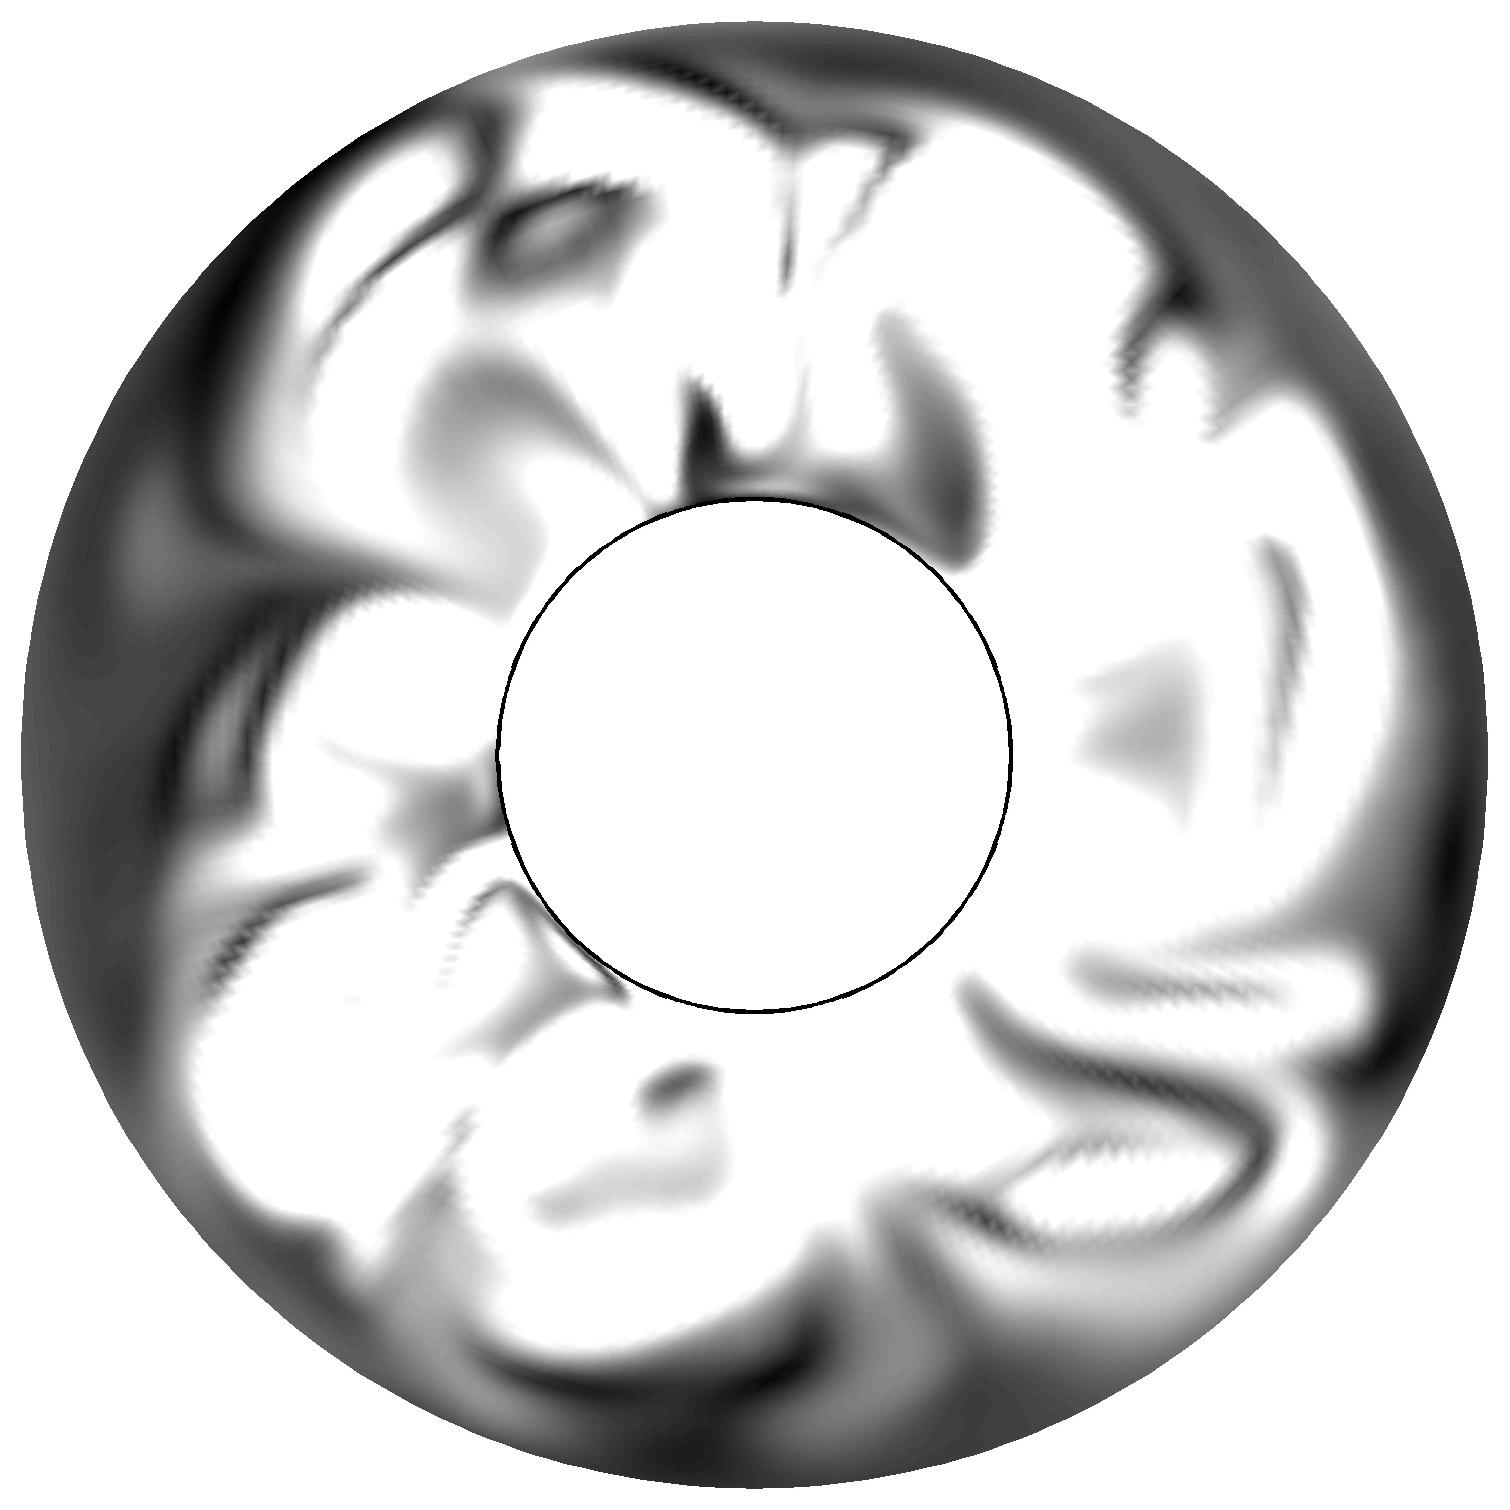
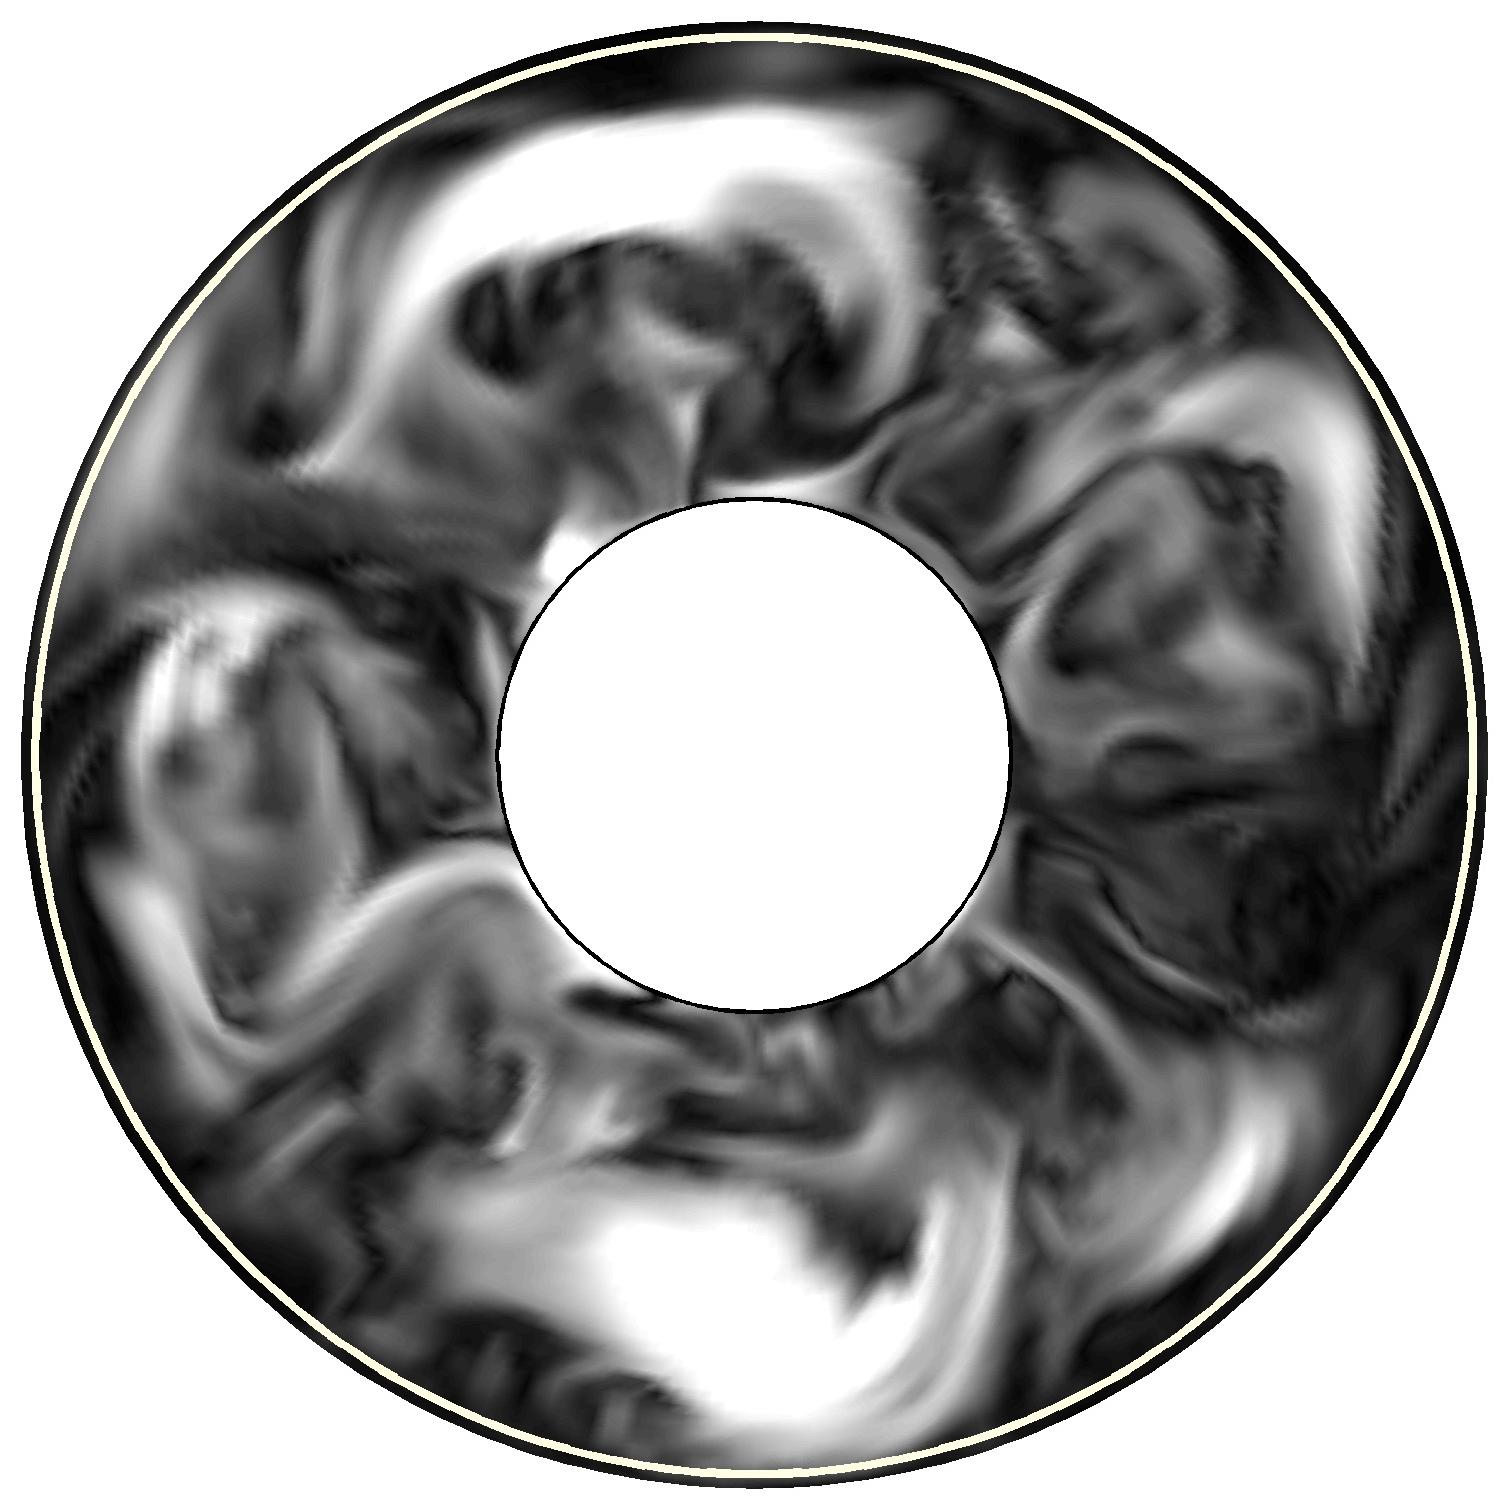
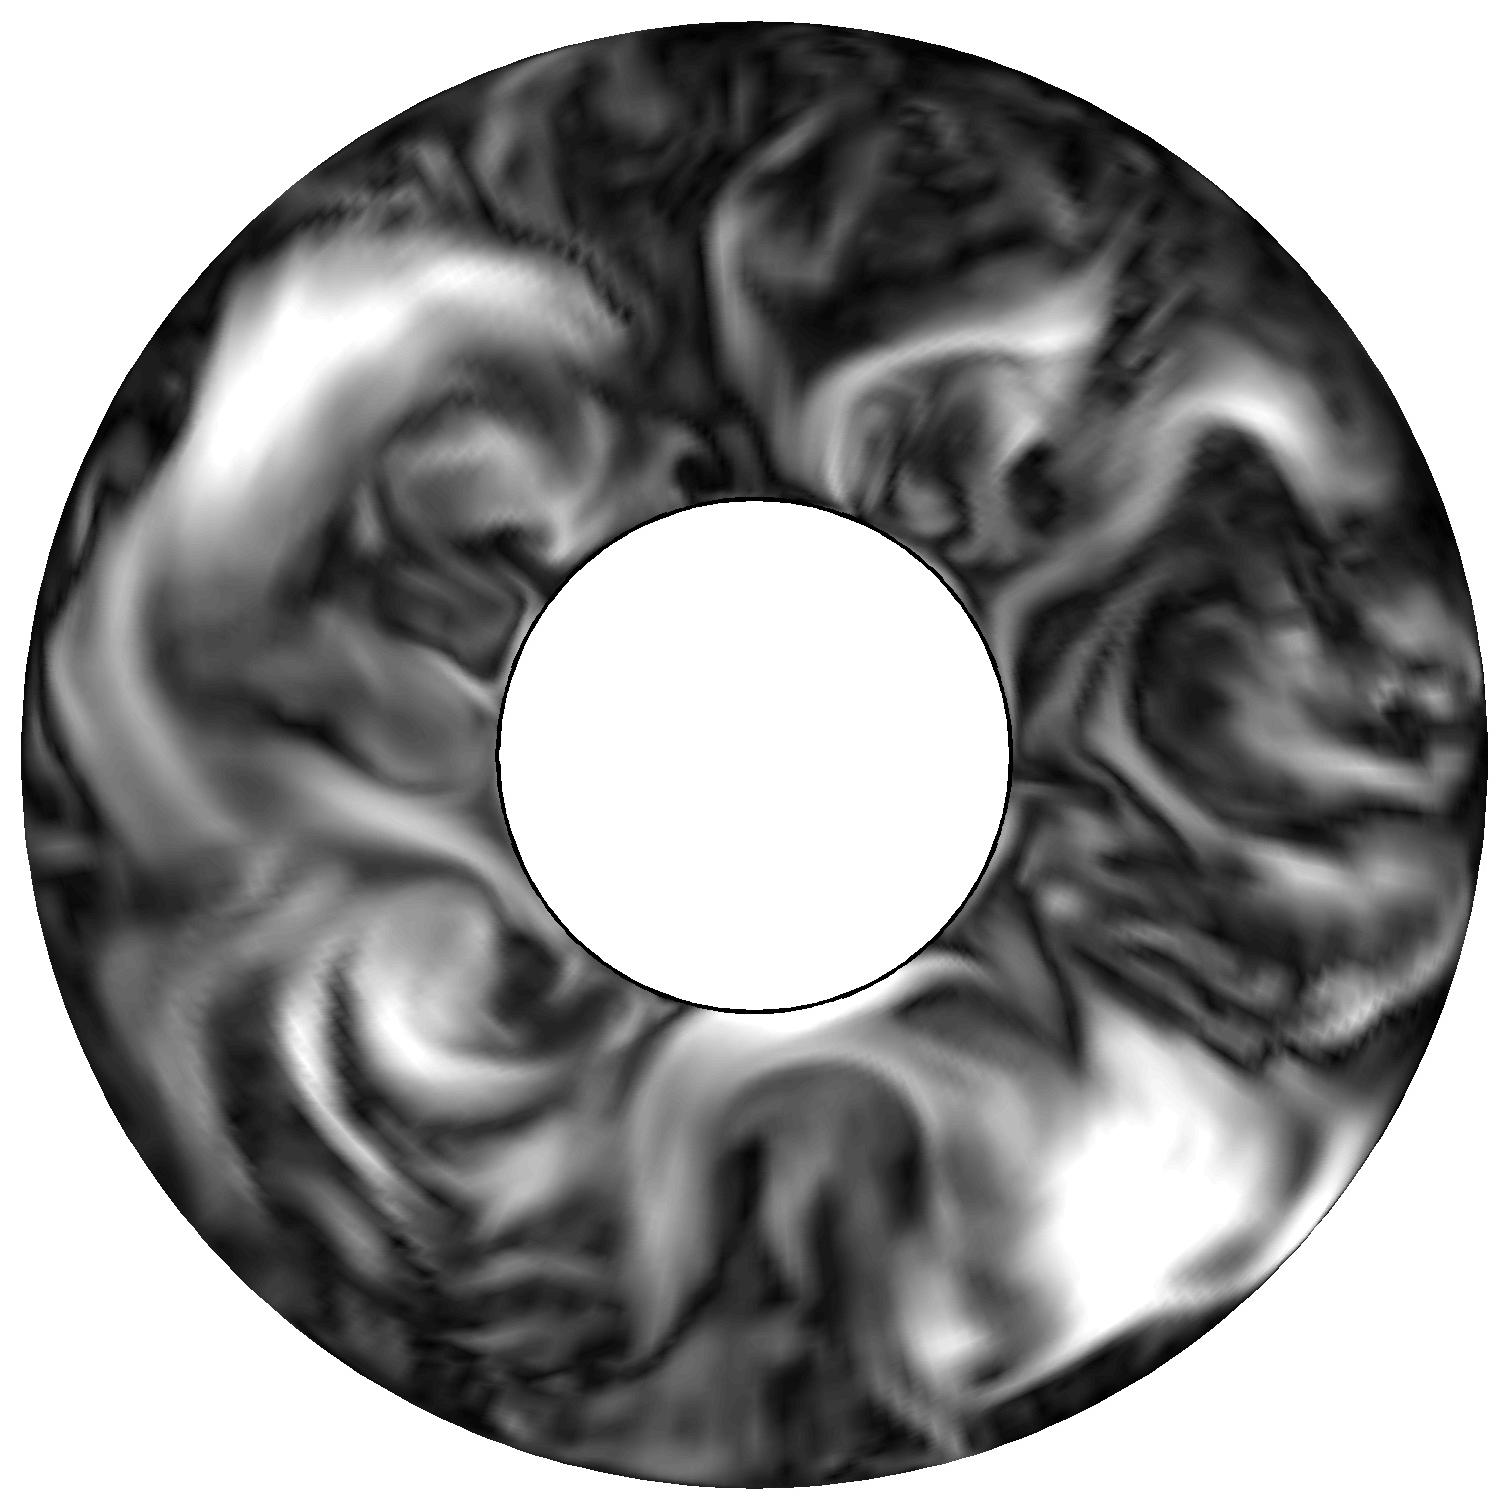
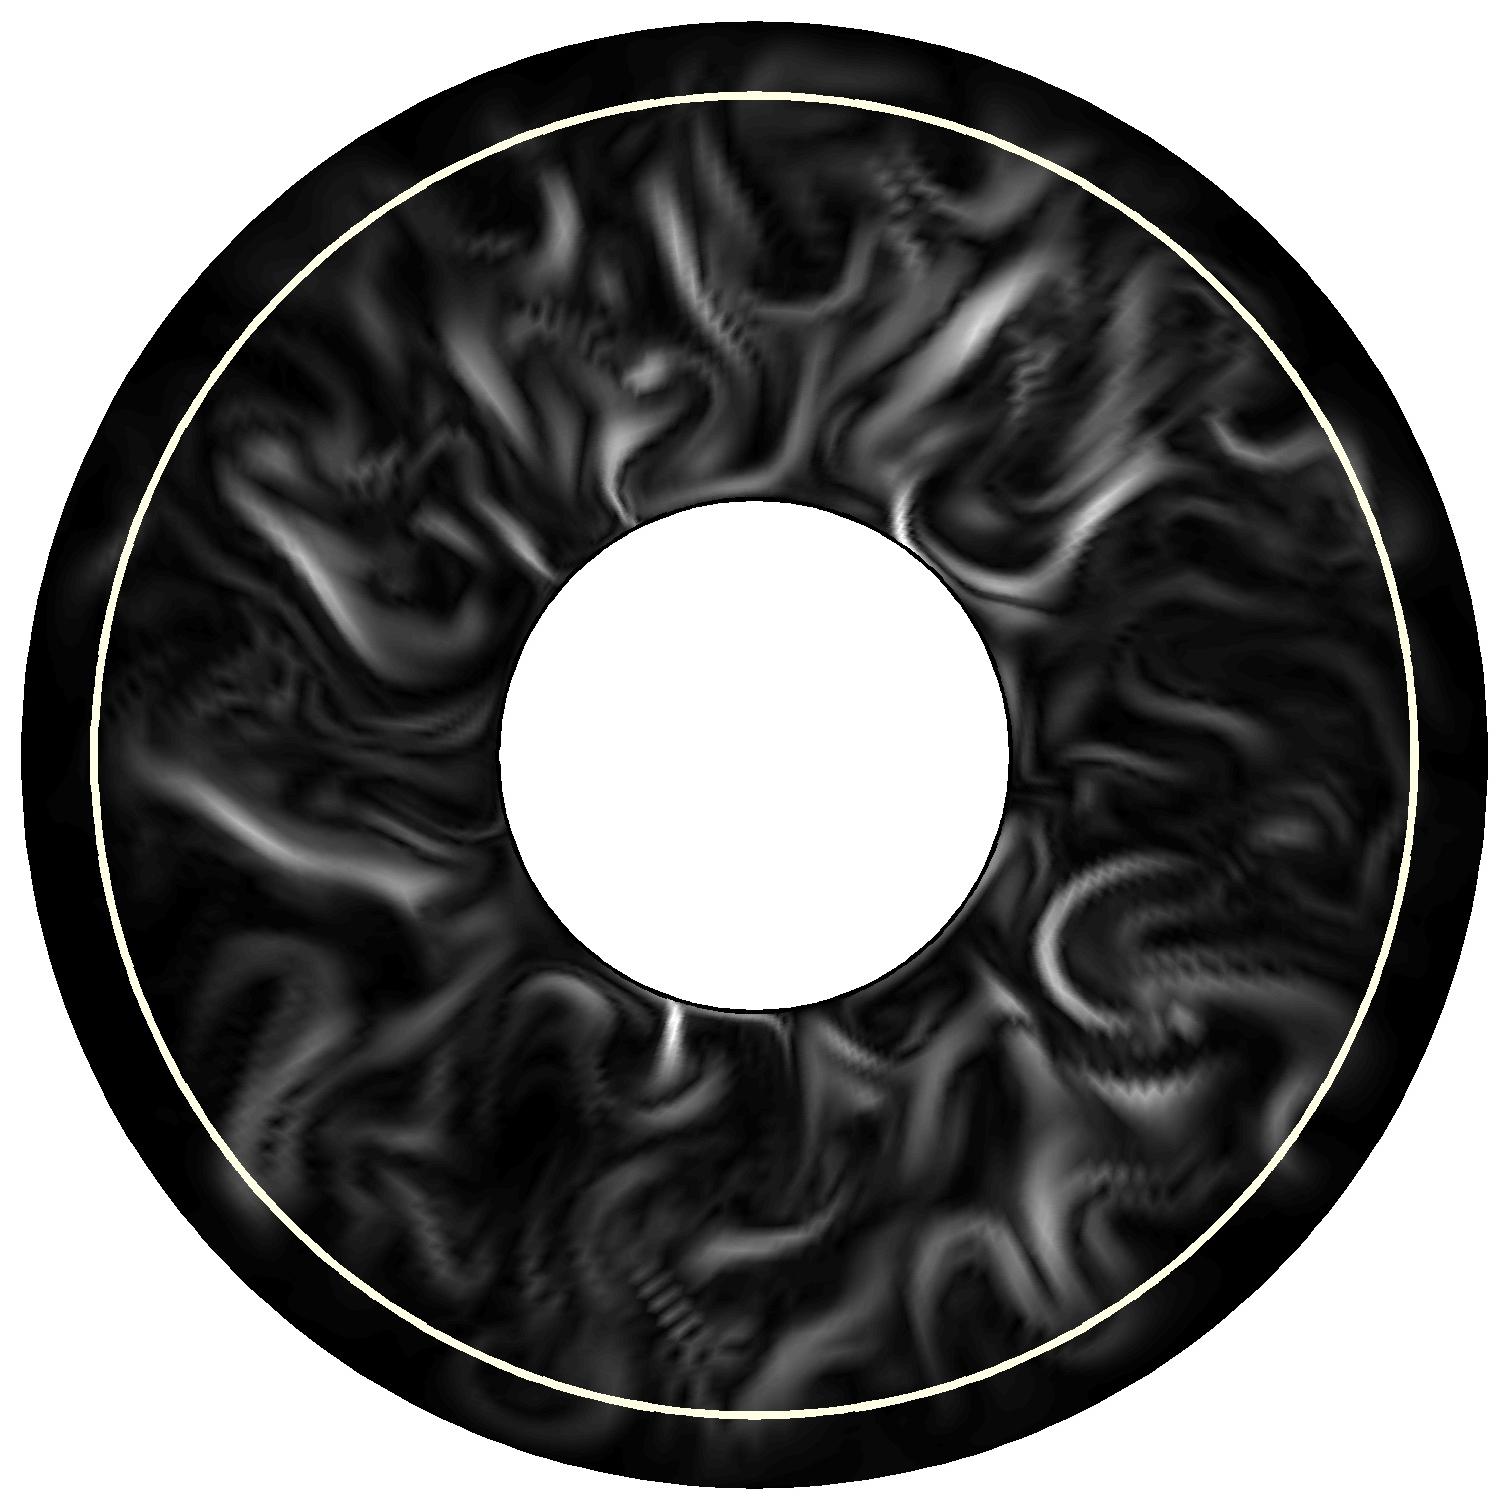
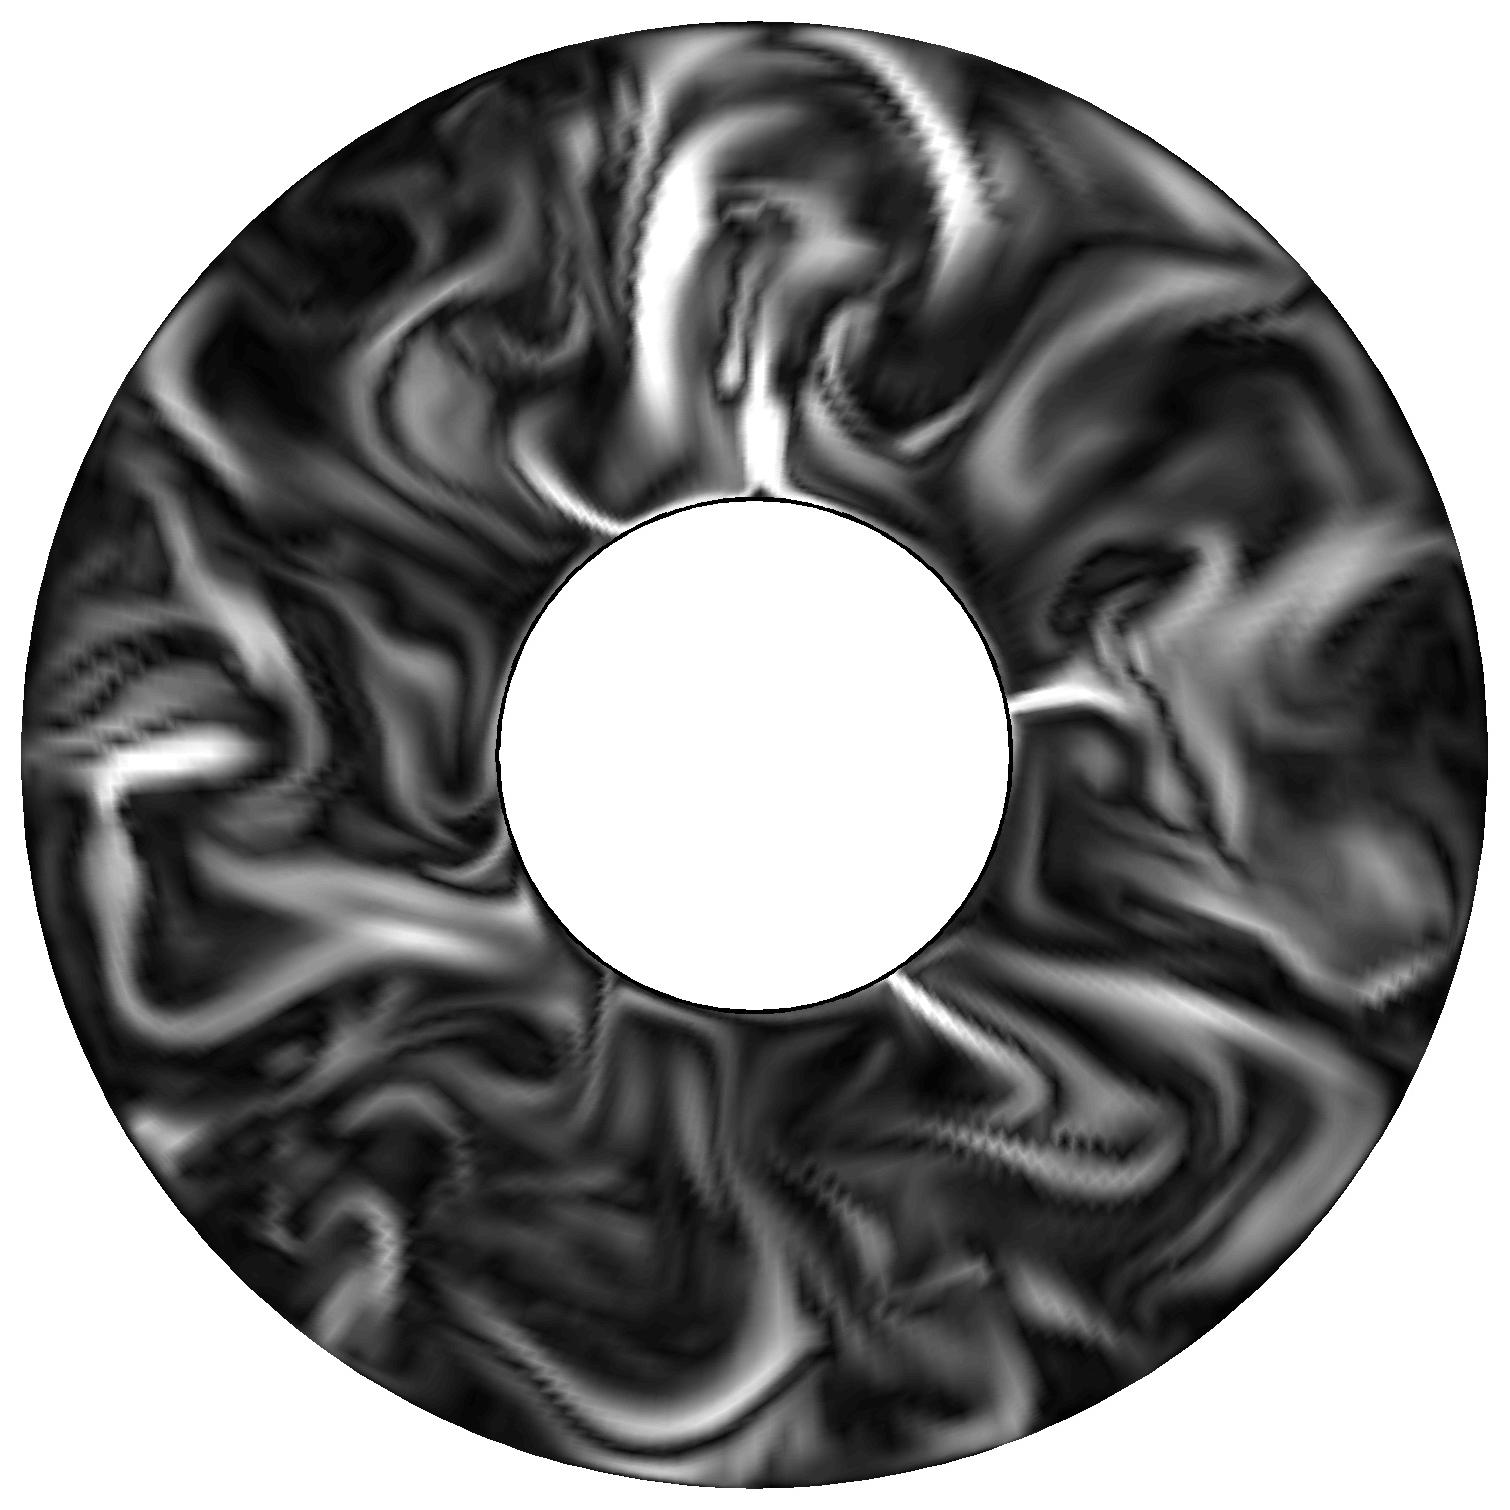
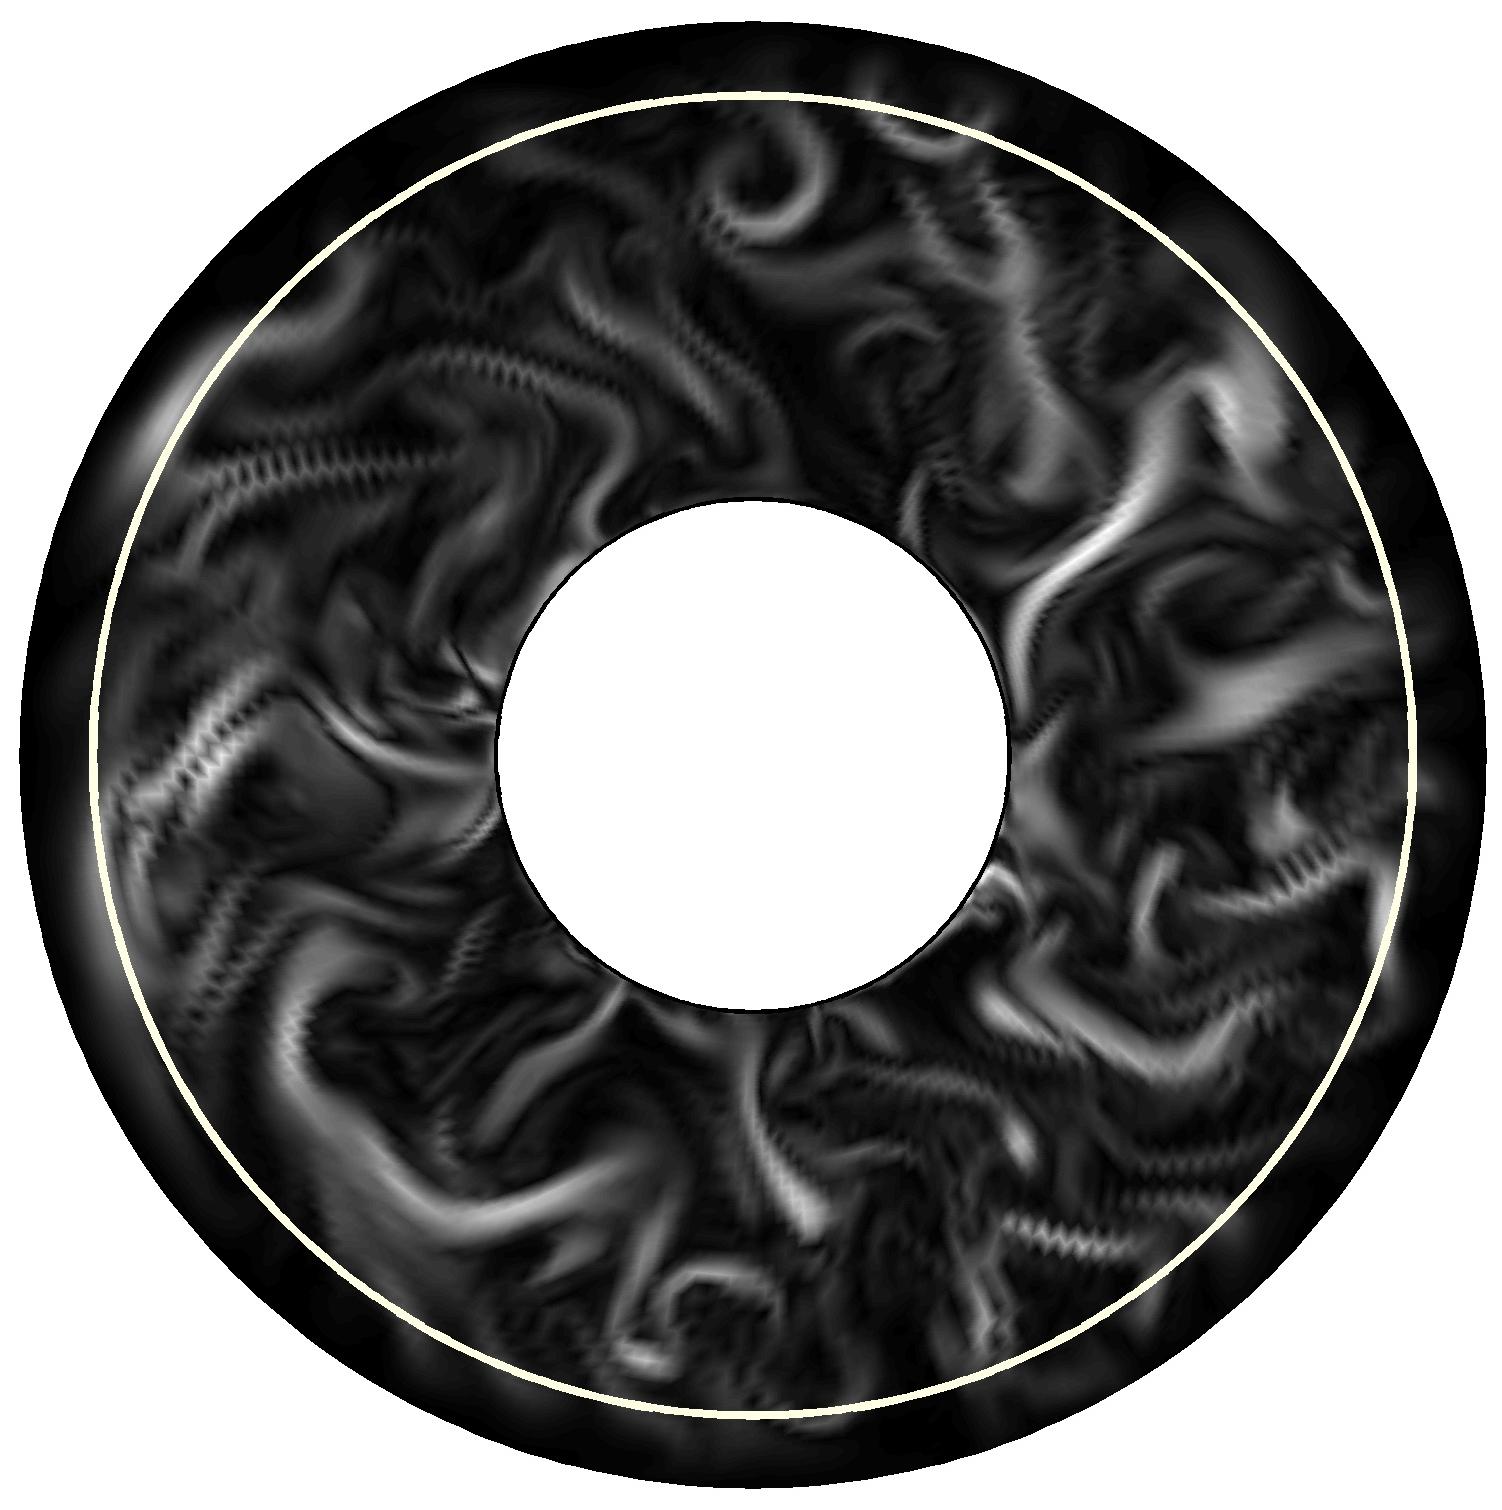
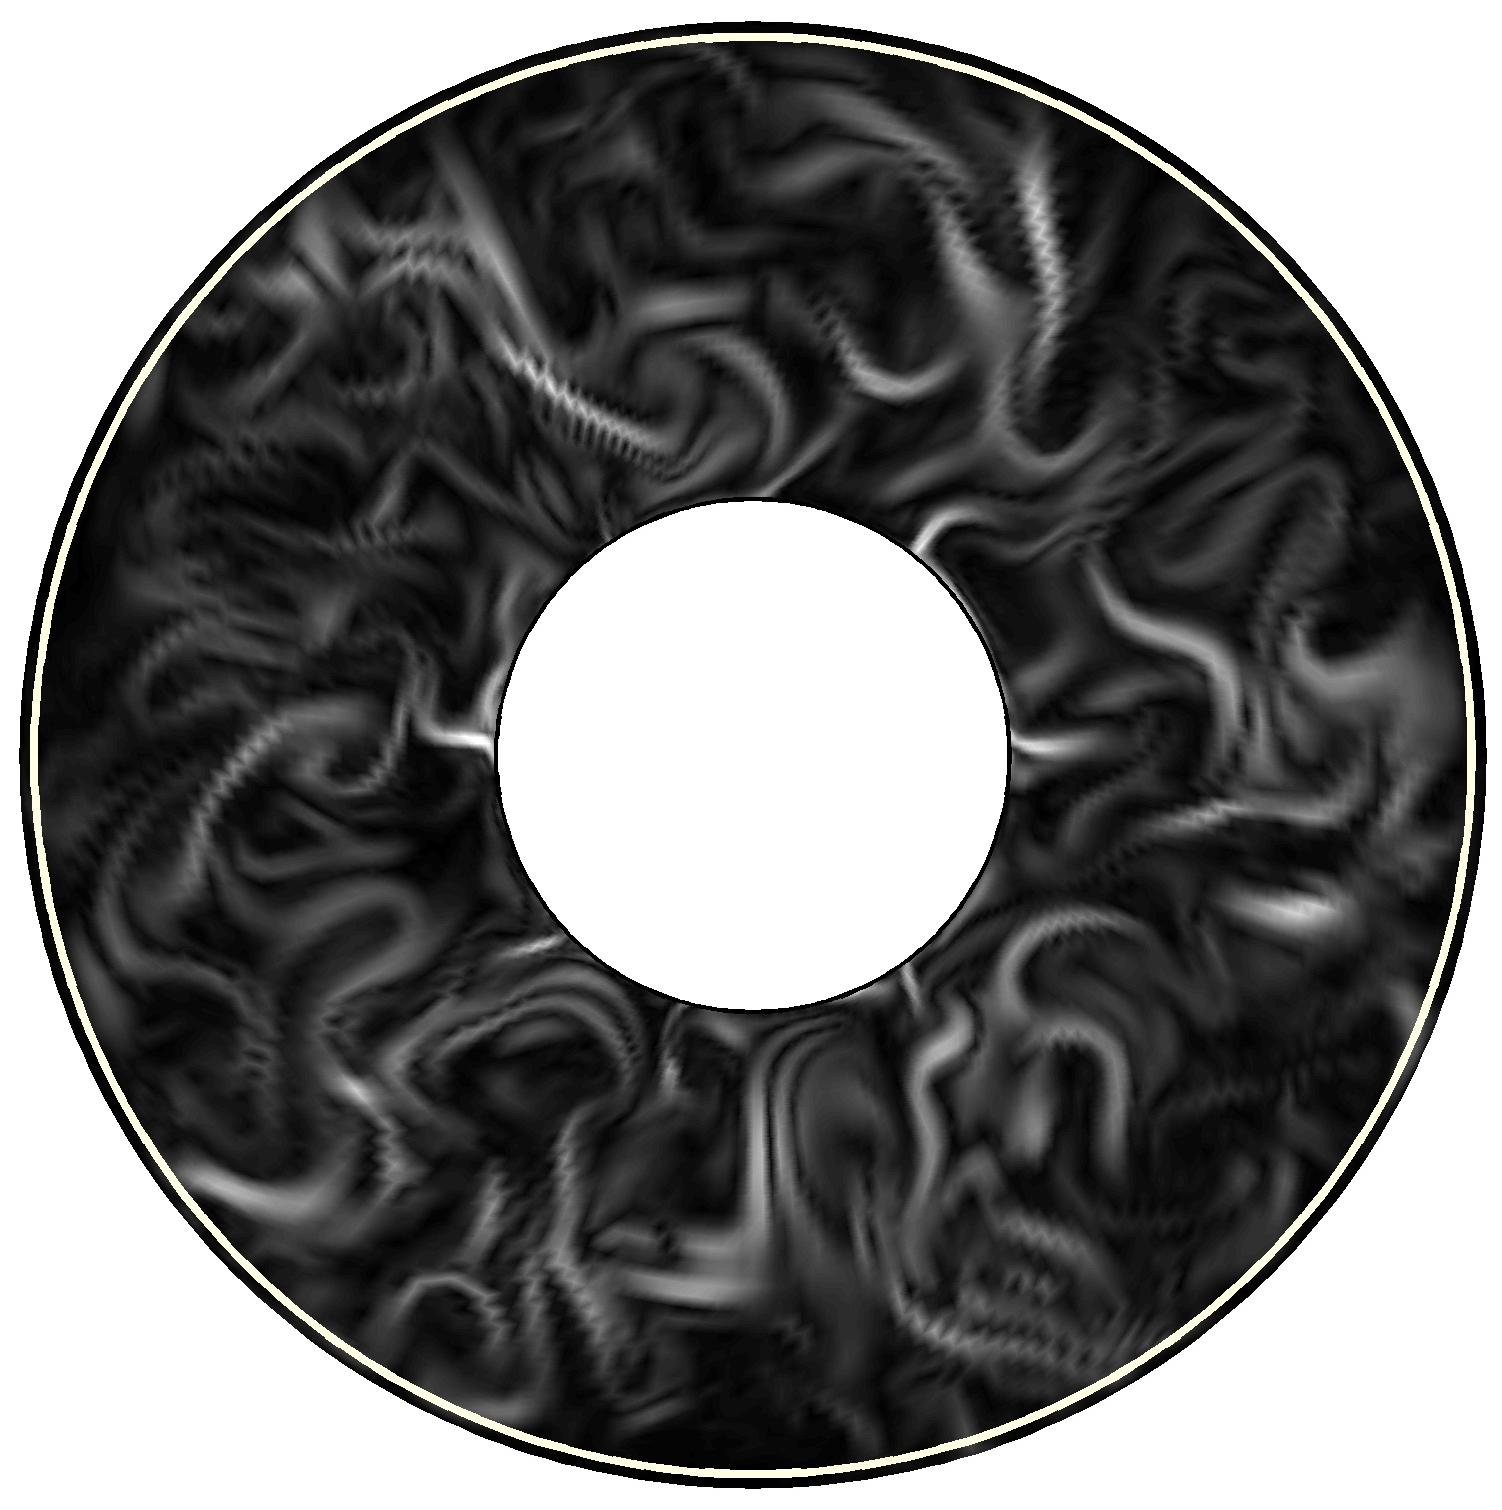
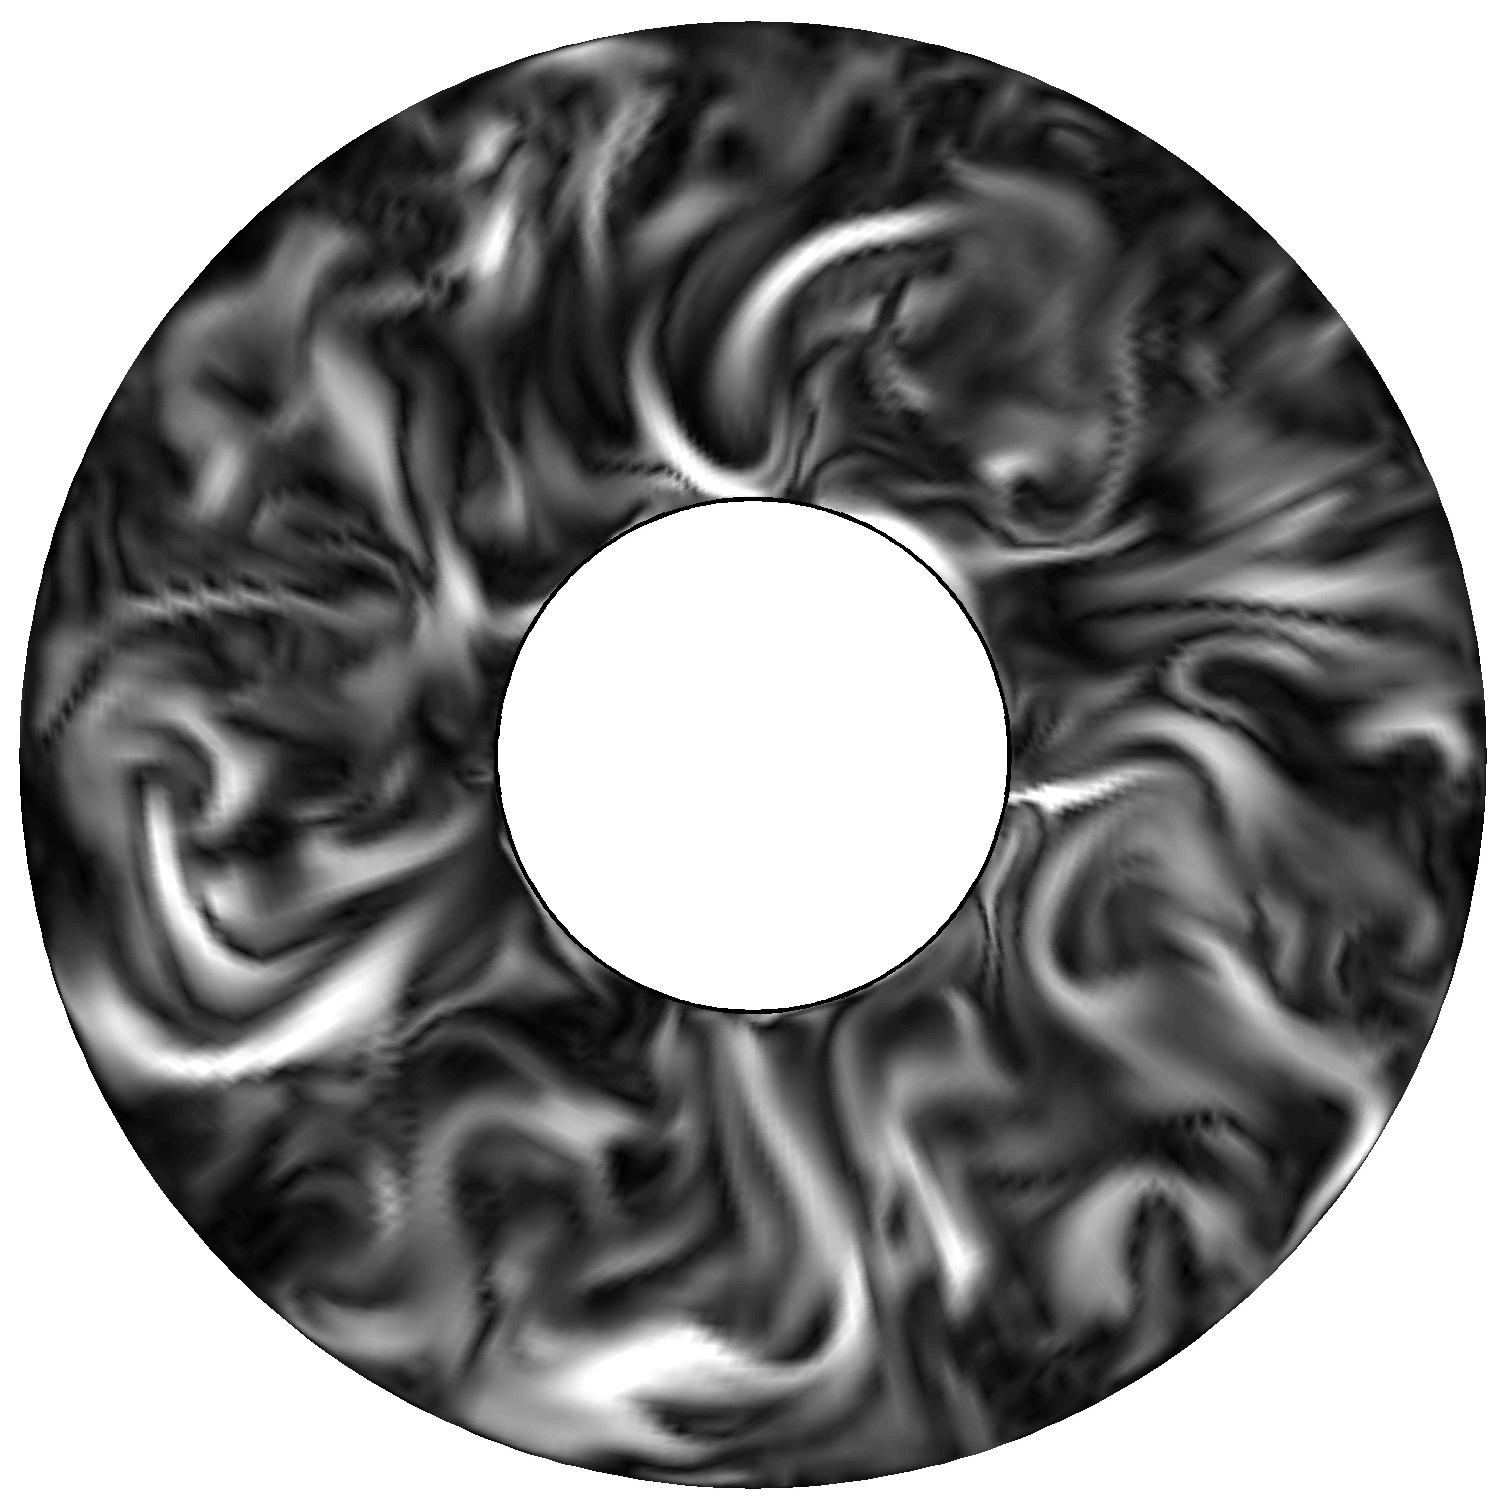
In figure 6, snapshots (at the same instants as for figure 5) of equatorial profiles of the axial vorticity are shown. Corresponding equatorial profiles of in figure 7 are included for all sets.
| A |
|
|
|
|
|
| B |
|
|
|
|
|
| C |
|
|
|
|
|
| C’ |
|
|
|
|
|
| A |

|

|
|
|
| B |

|

|
|
|
| C |

|
|

|
|
| C’ |

|
|
|
|
In set A there is a clear correlation between the cyclonic vortices (in black) with the magnetic field magnitude maxima (in white). Similarly to the temperature, the wave number of the vorticity profiles of the variable conductivity cases is equal to that of the non-magnetic case and allows for smaller scale features. For set A, as well as seen in the temperature profiles, the presence of zonal flow bends the vortices in a prograde direction. Runs with and mimic this prograde tendency and the magnetic field is regularly organized in azimuth with a dominant wave number of six. Runs and , do not show a clear prograde tilt with increasing radius, and have a higher dominant wave number than runs with lower values of . The correlation between cyclonic vortices and magnetic field maxima can be inferred for sets B, C and C’, but it is not as evident as for set A. The length scale of the magnetic field decreases with decreasing .
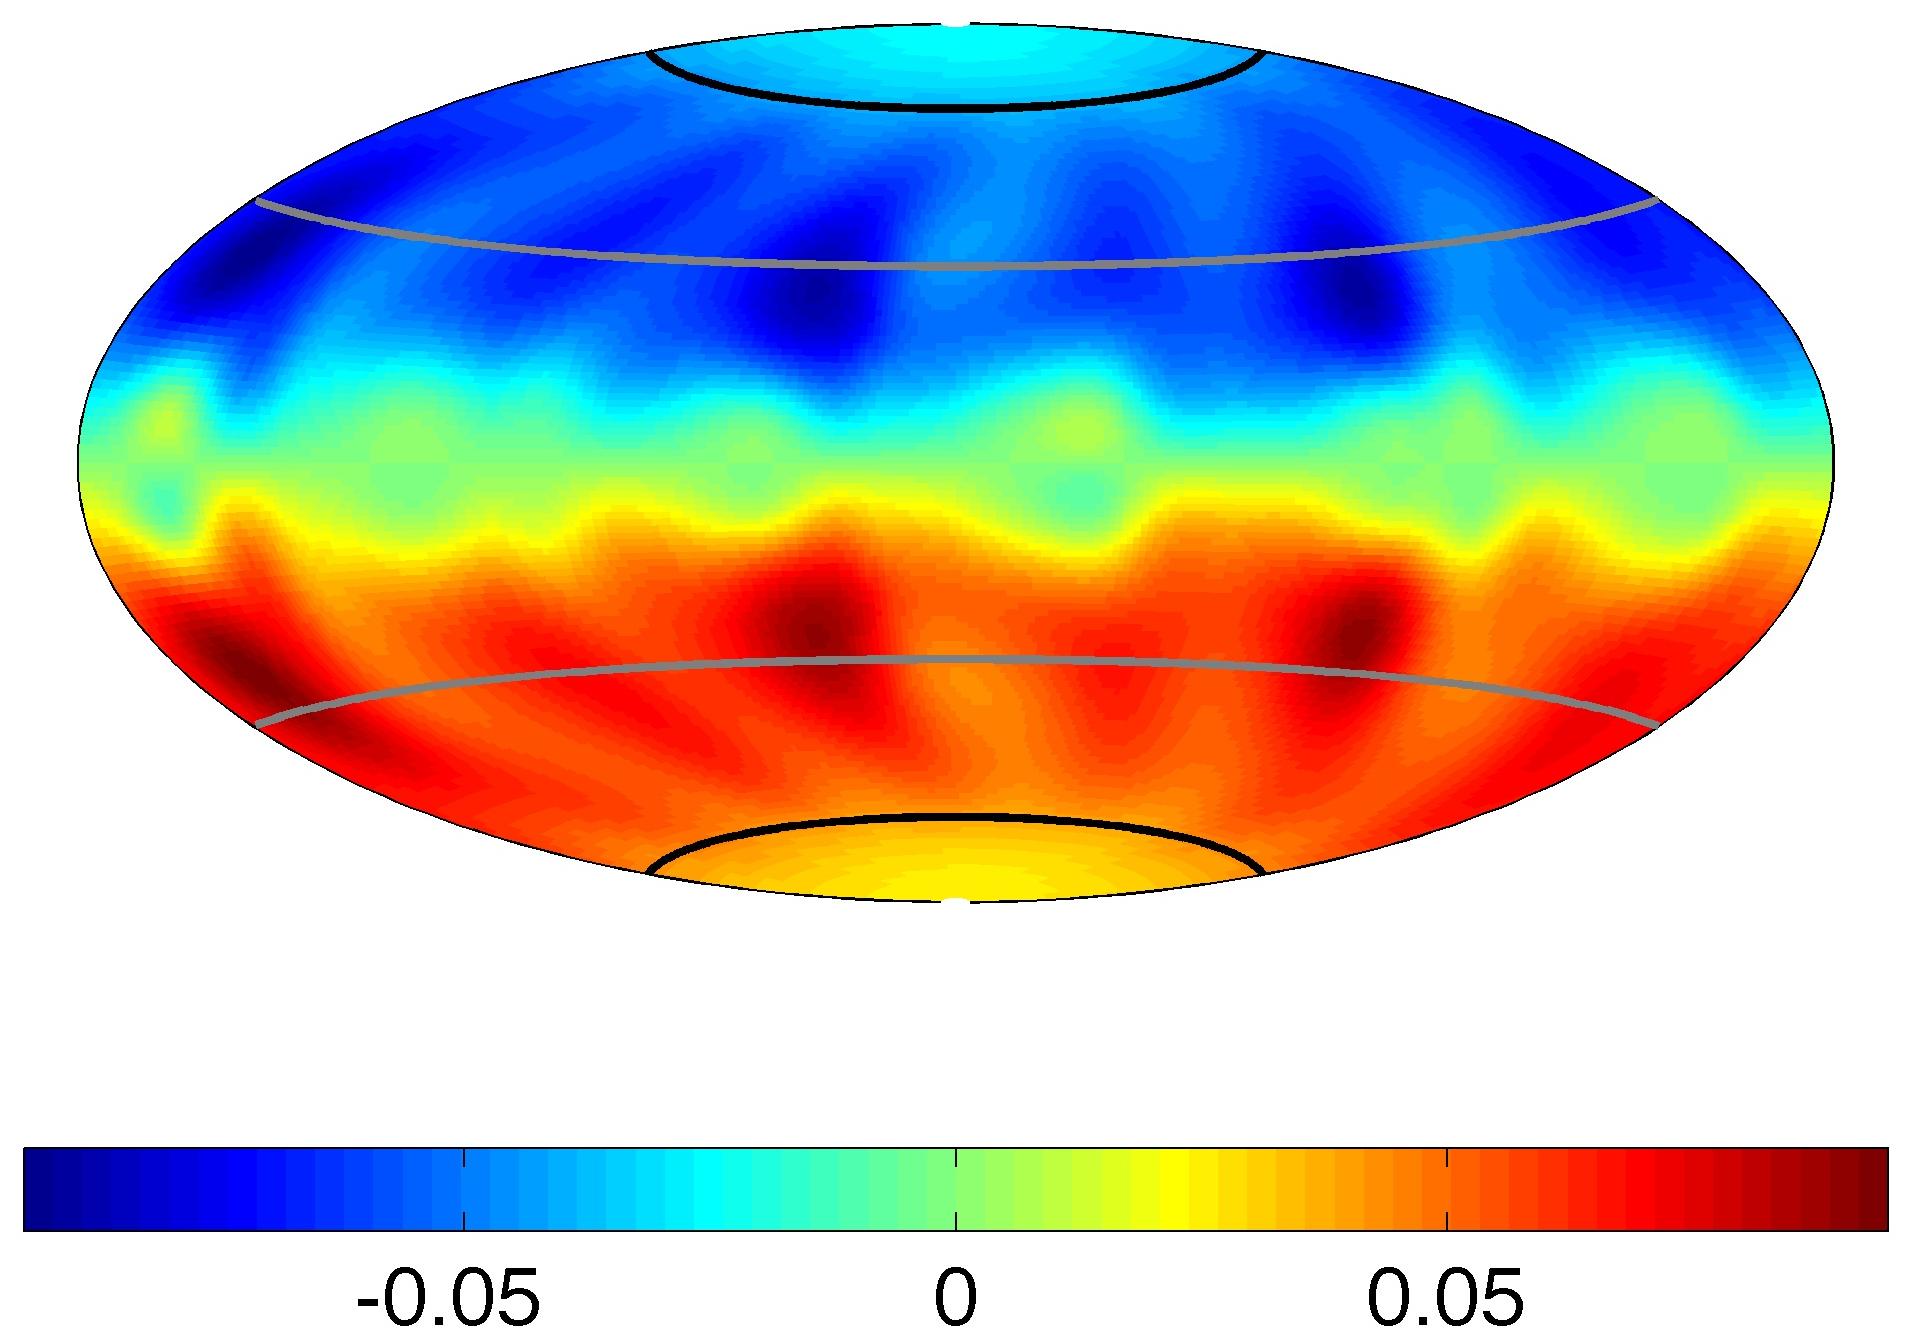
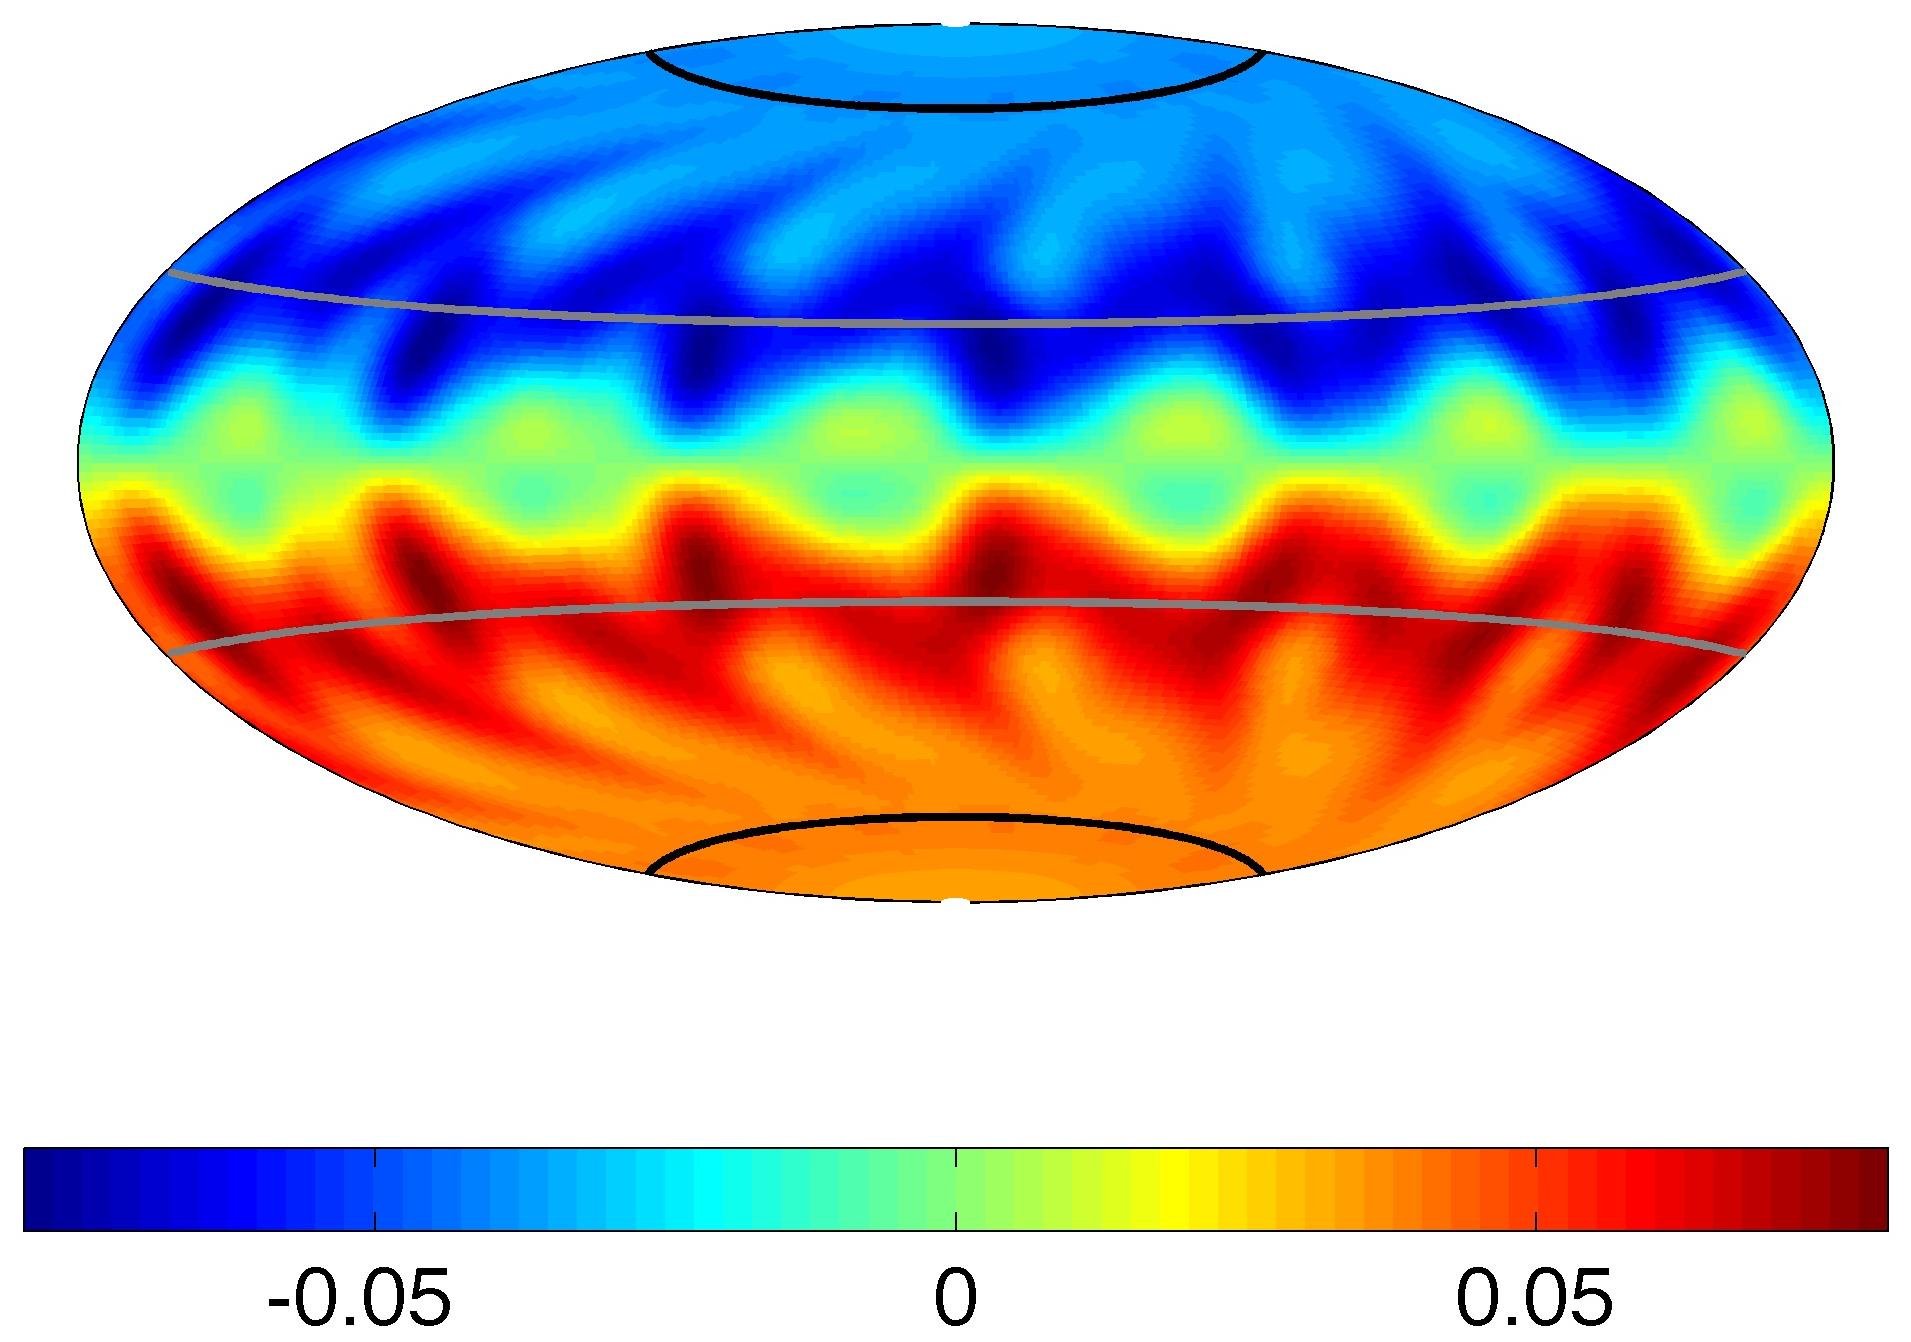
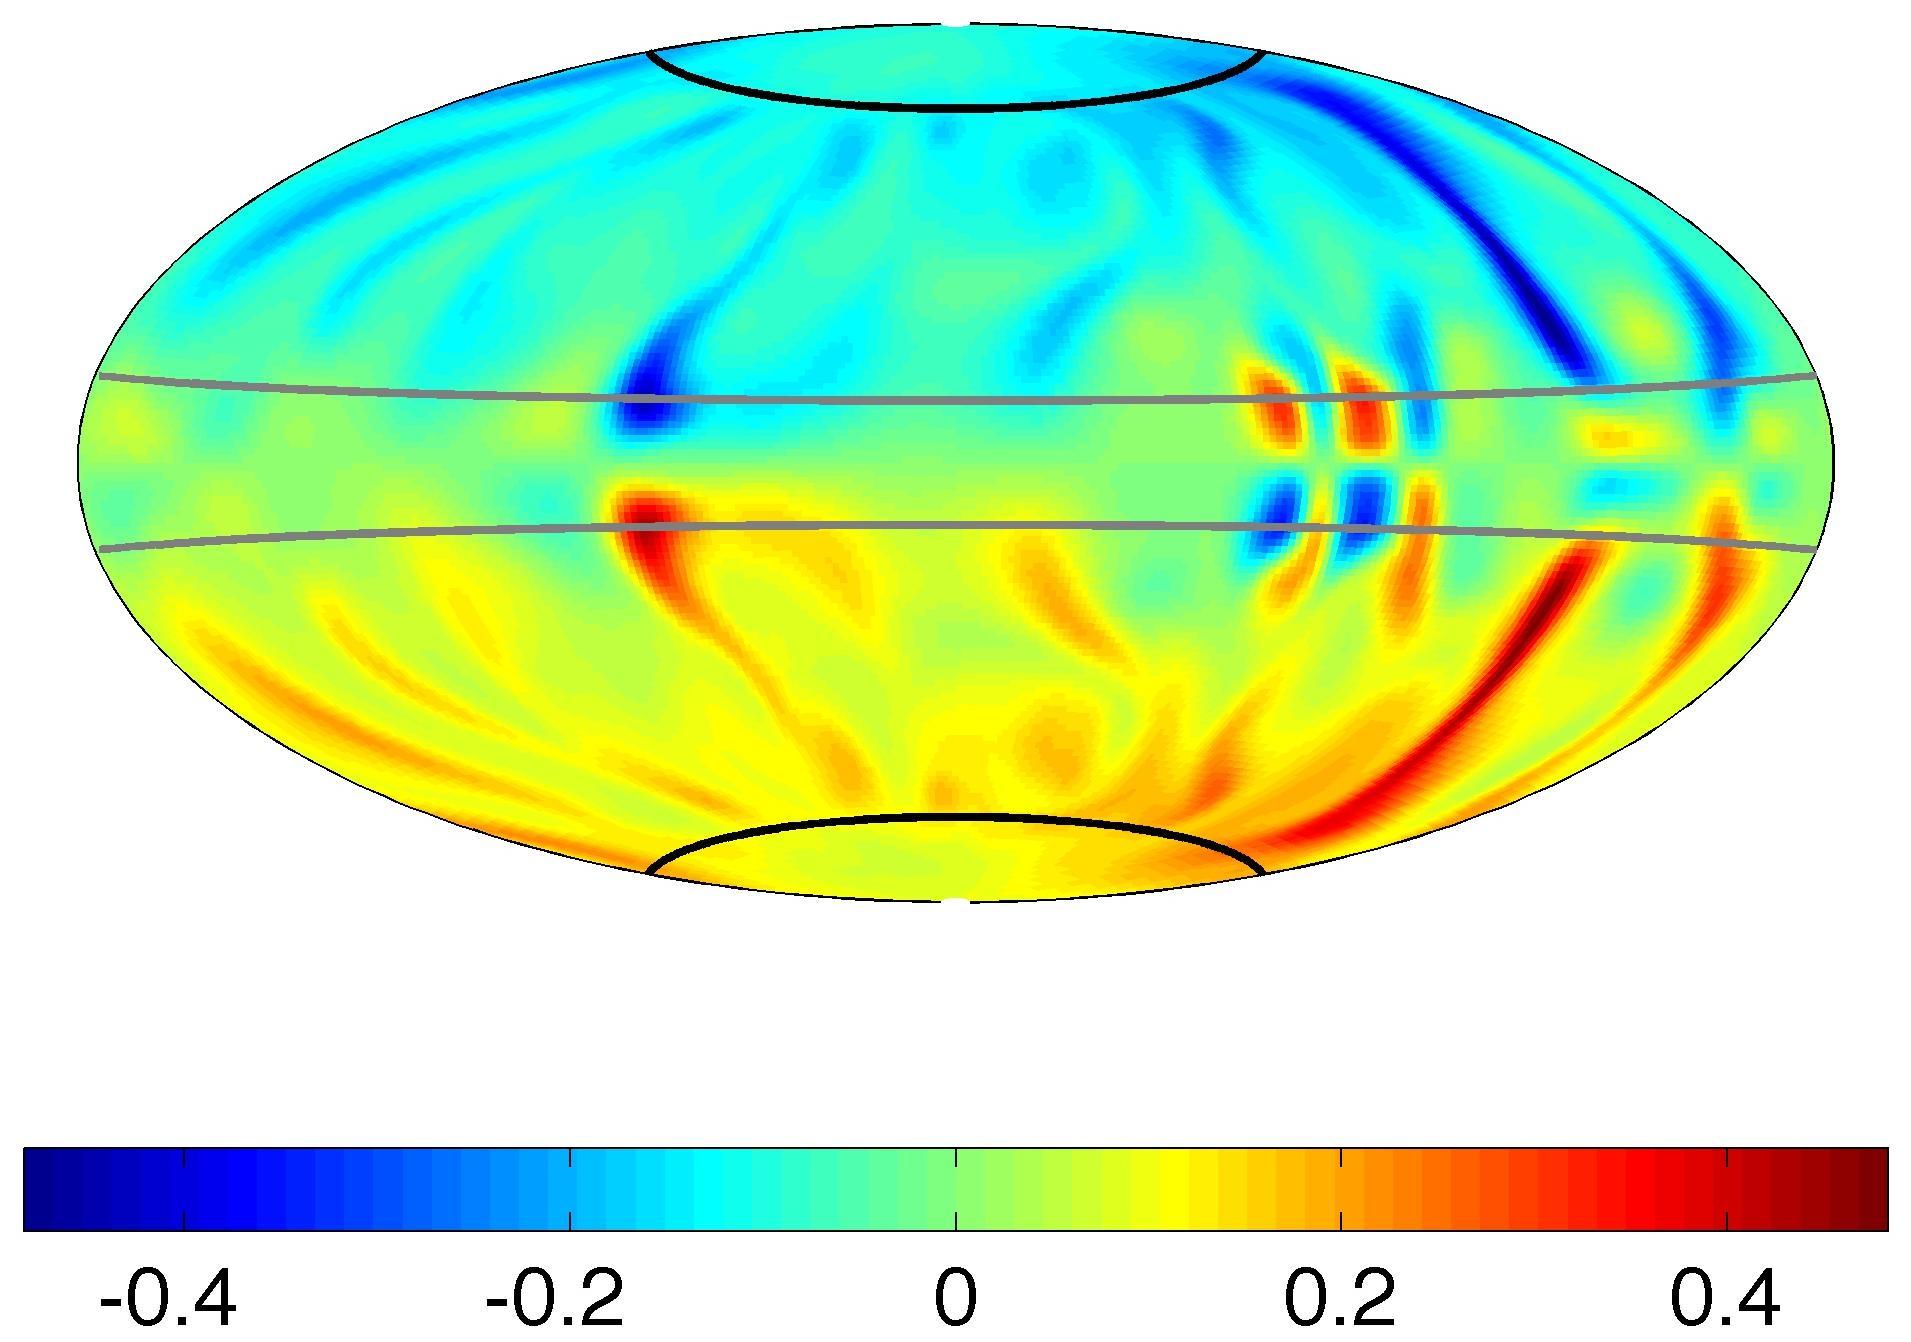
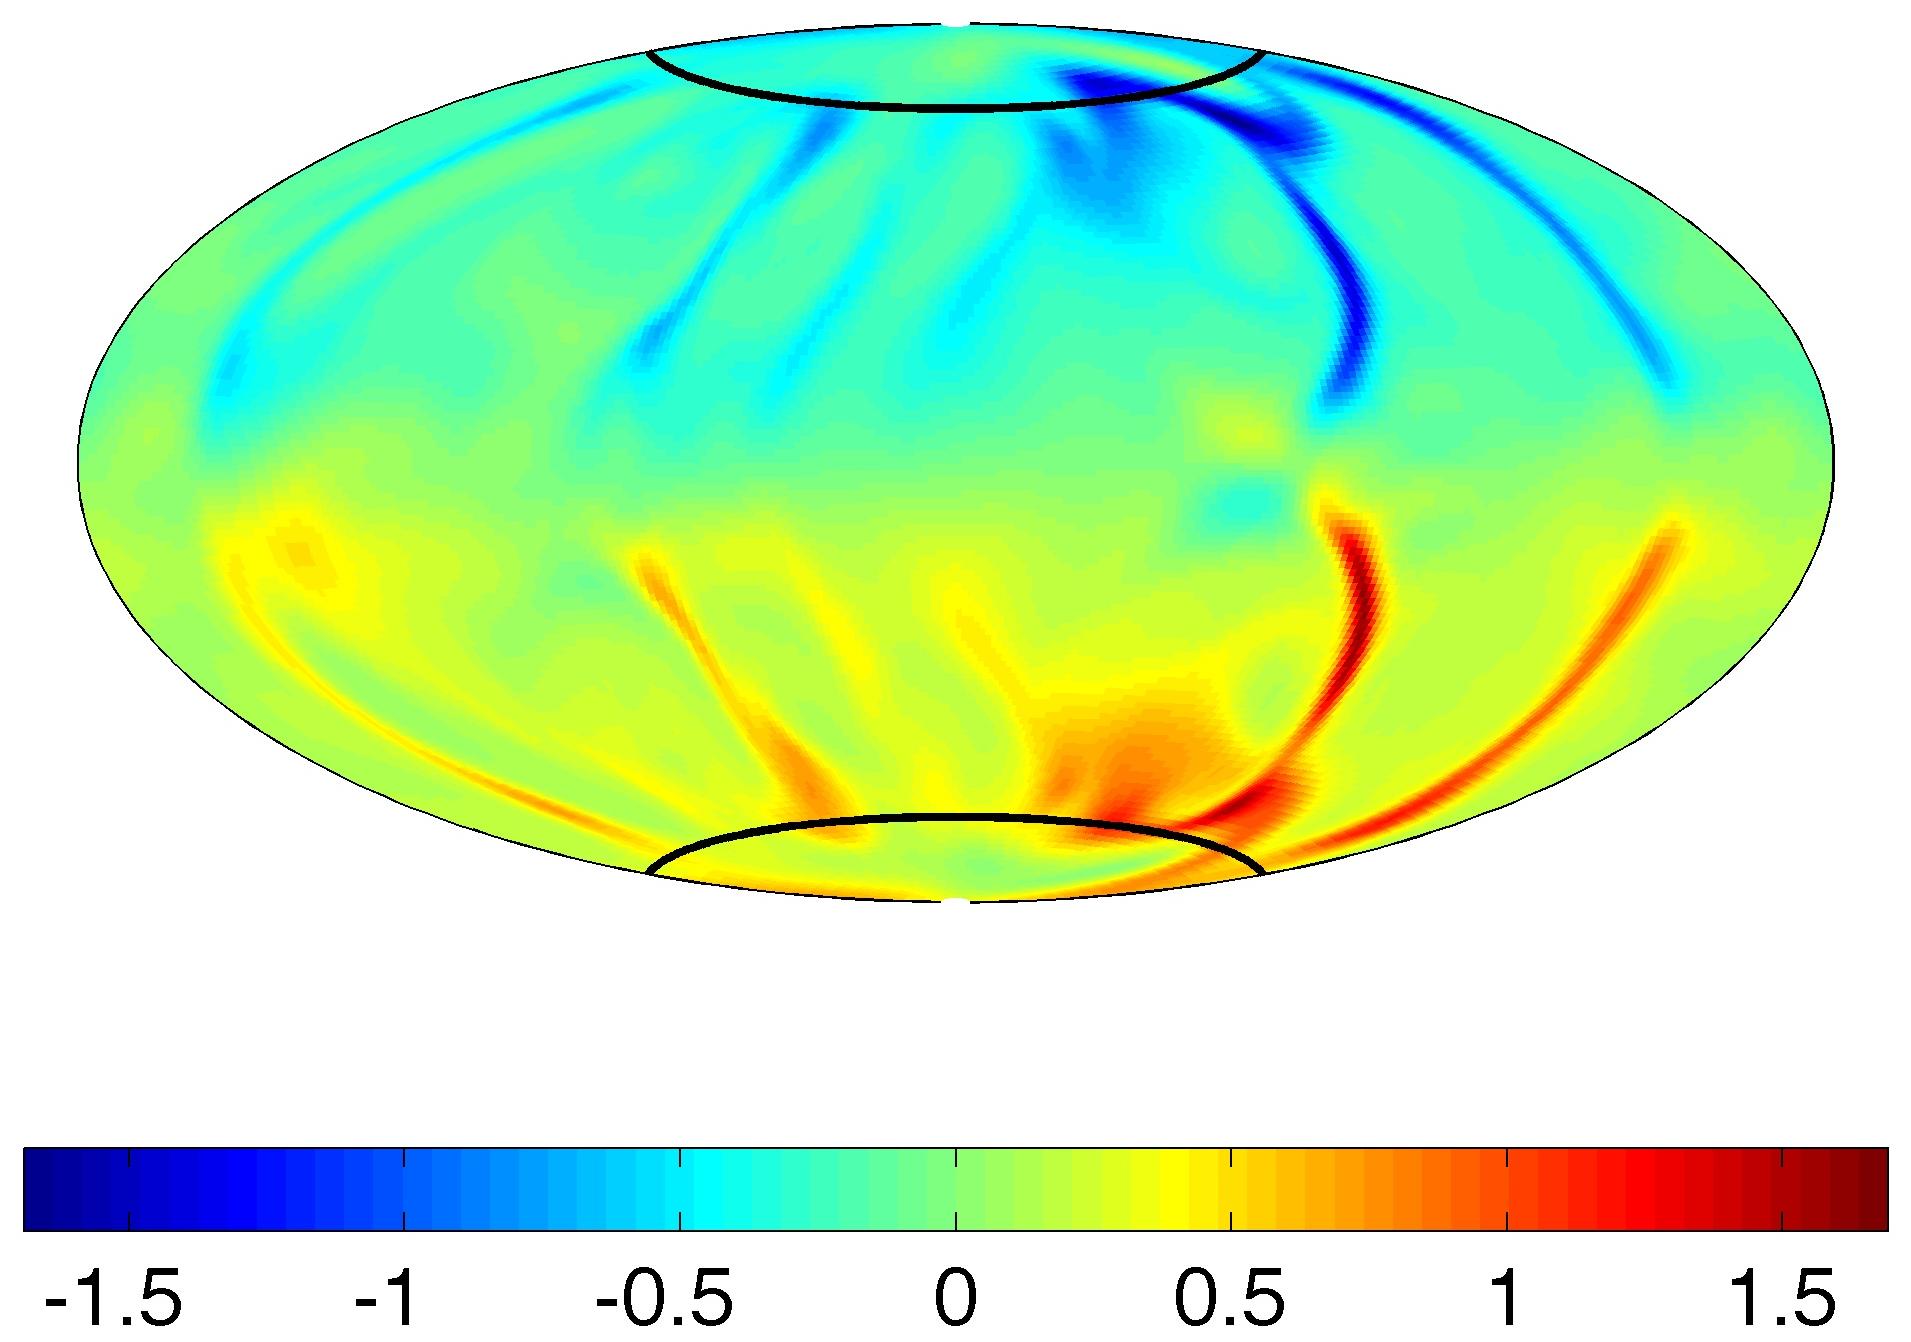
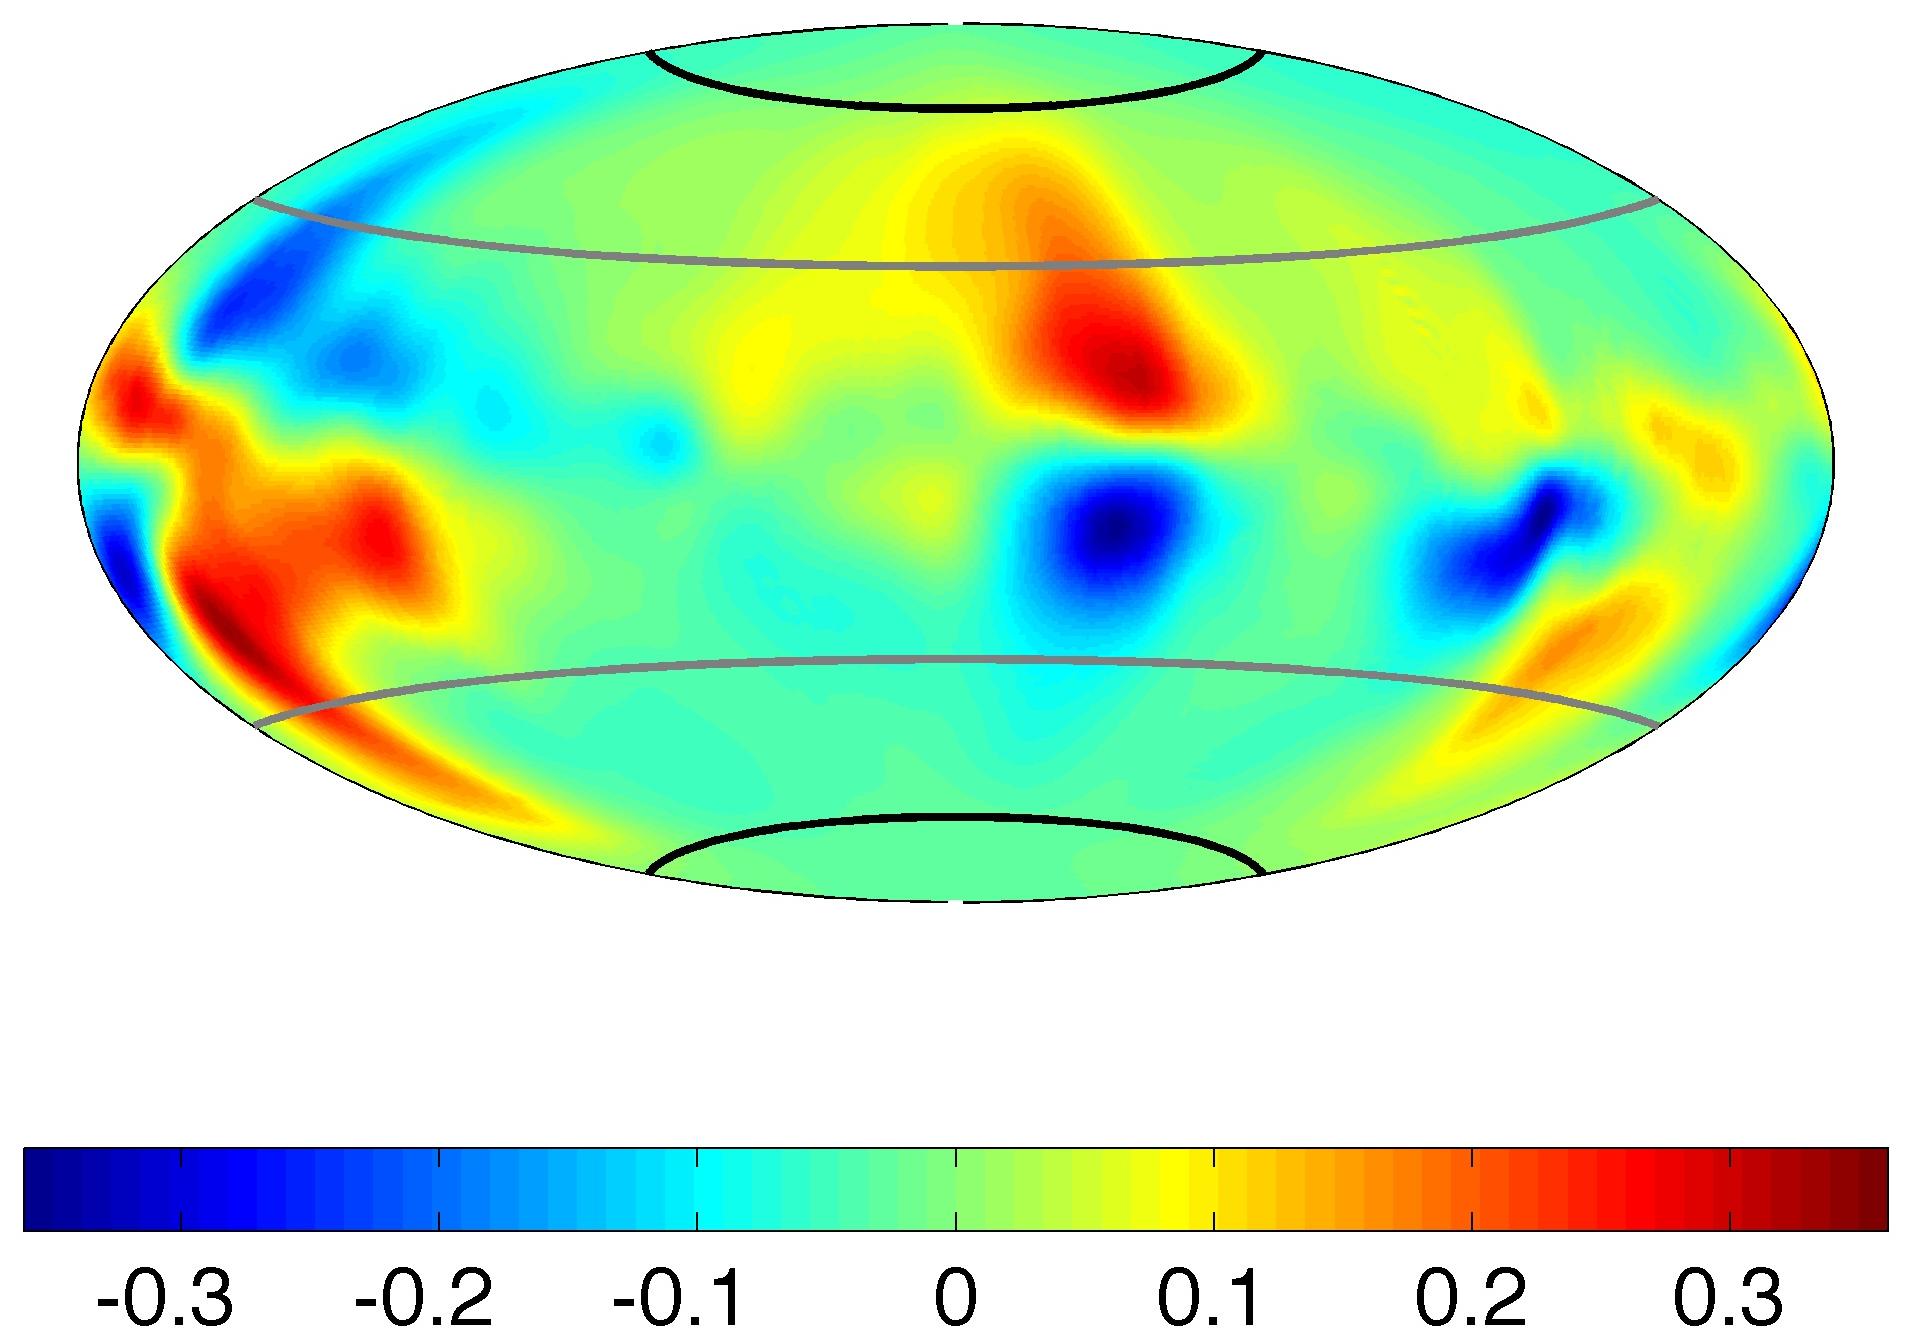
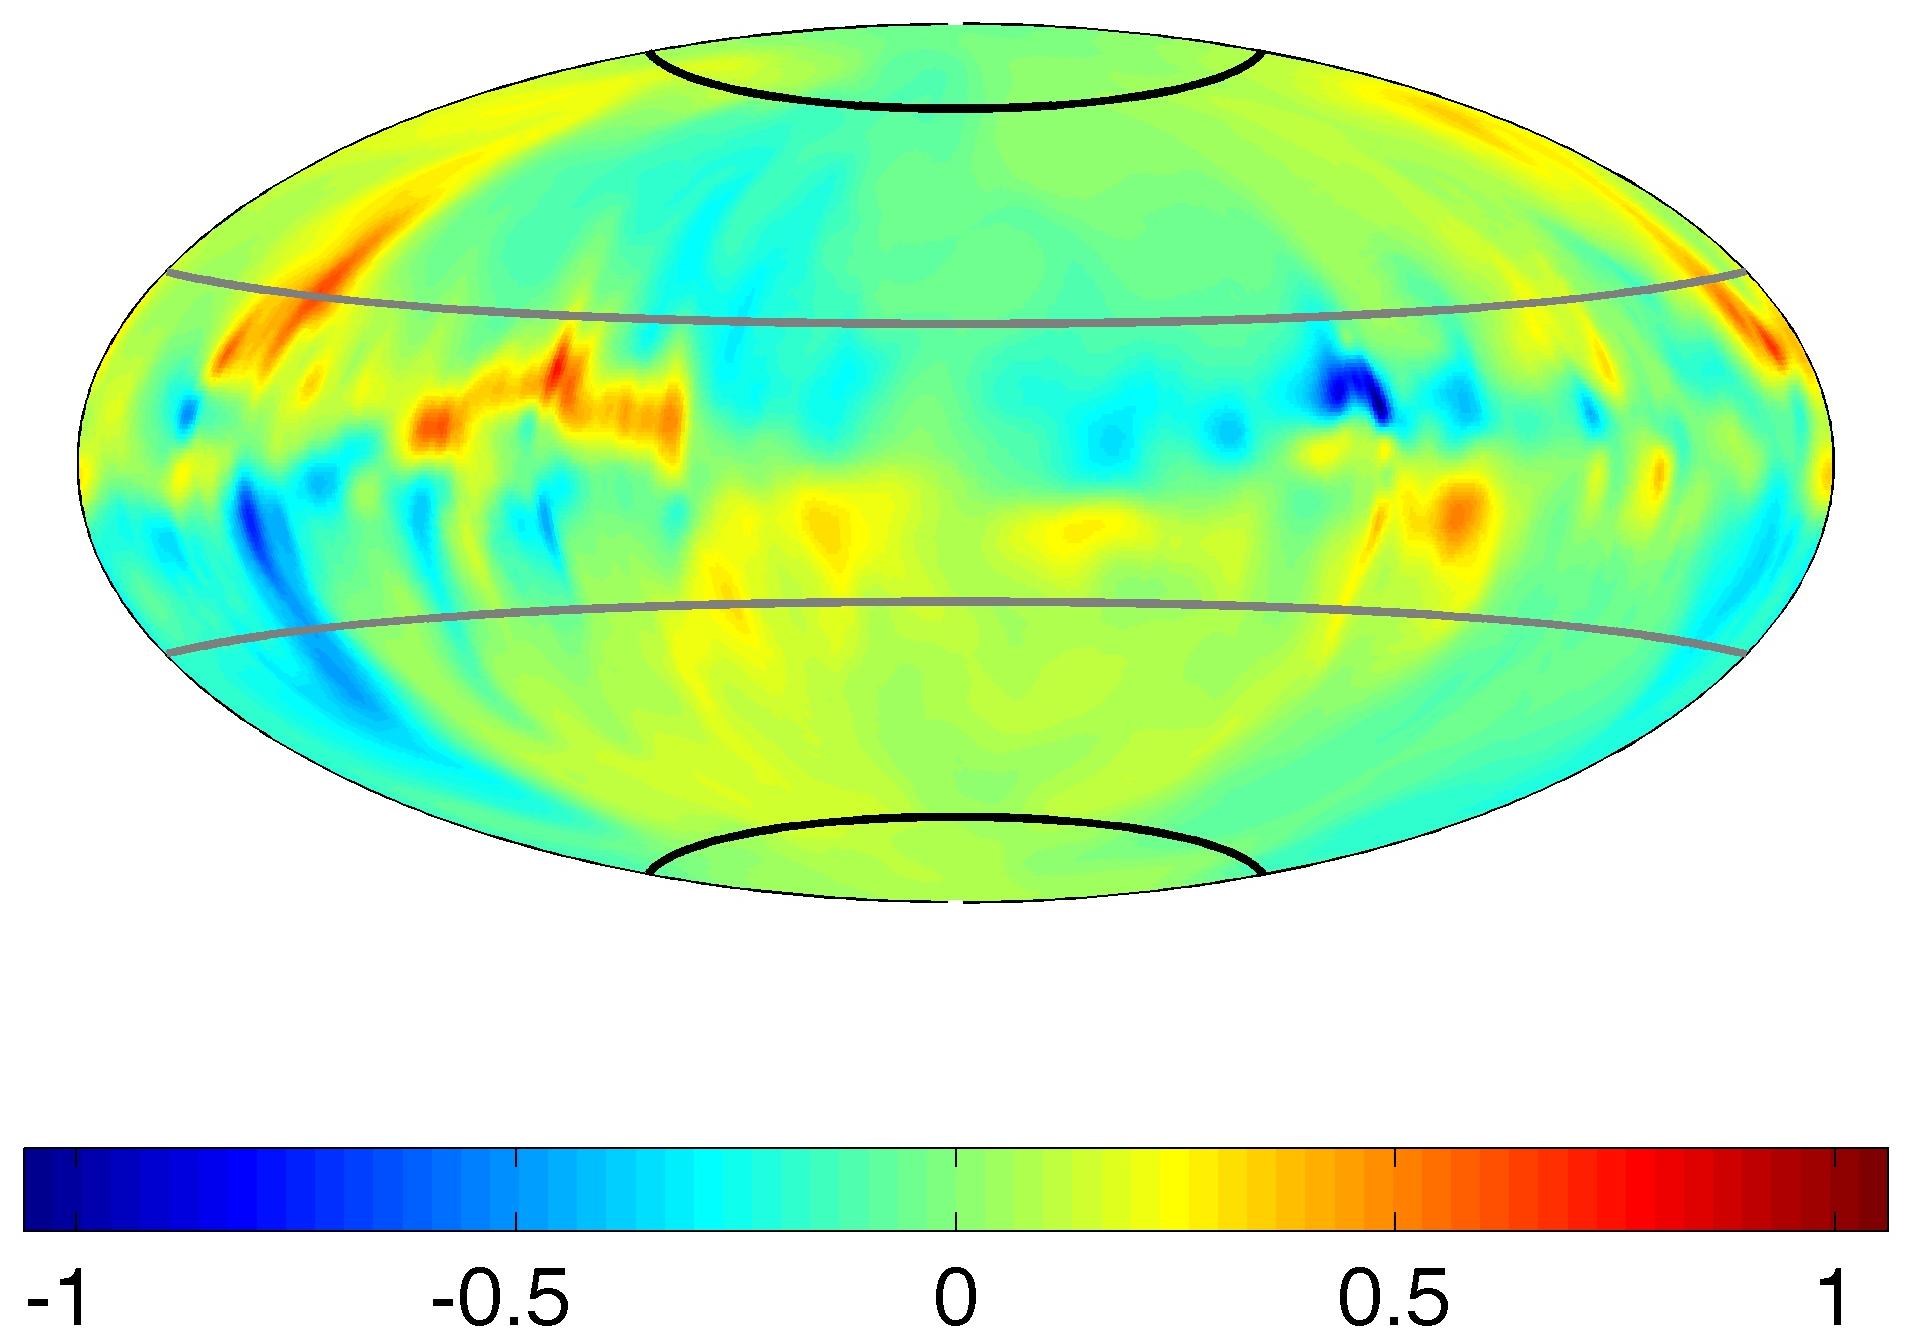
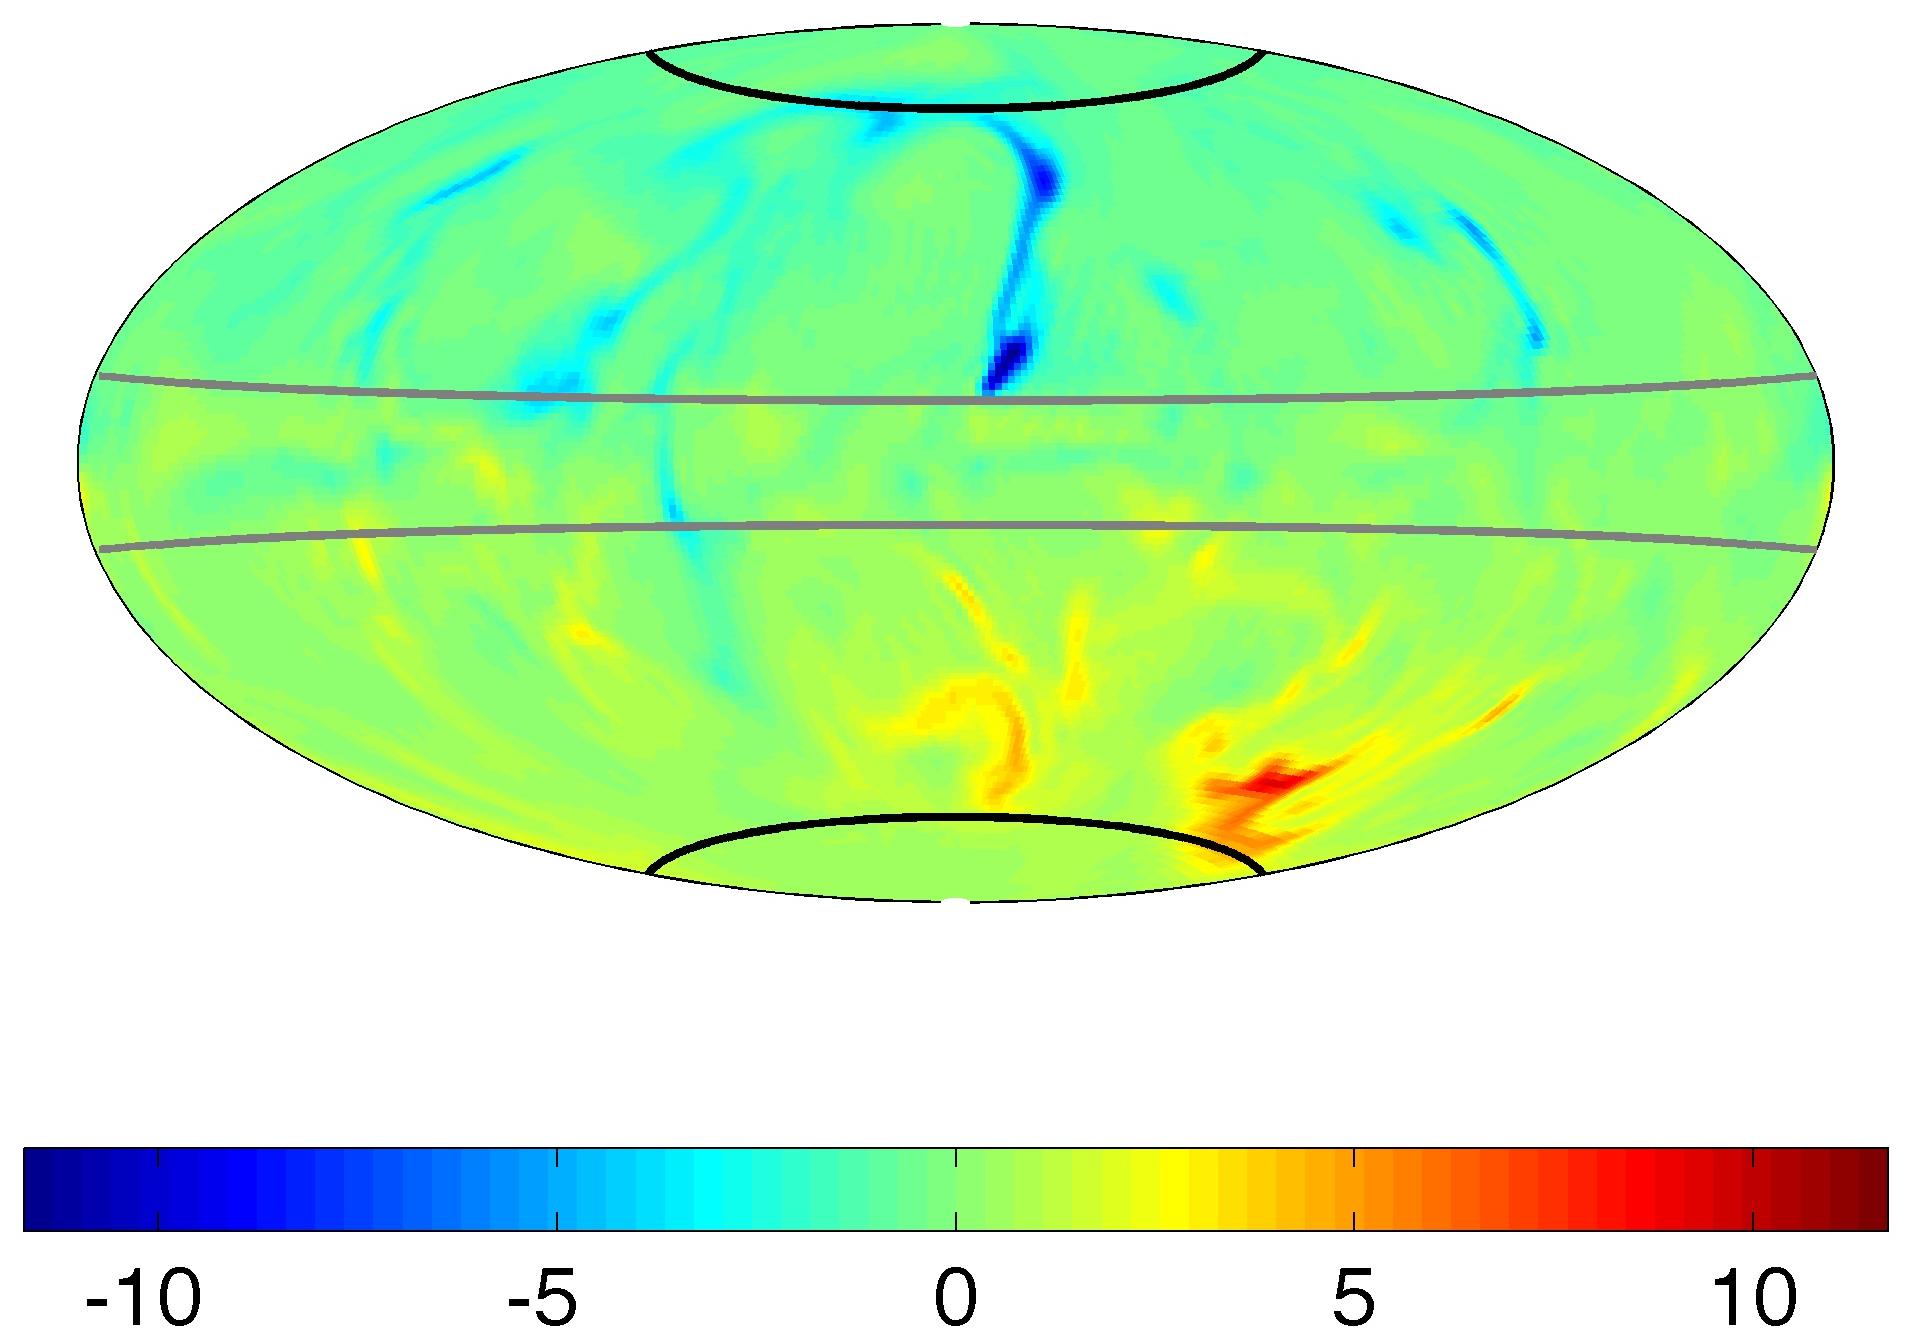
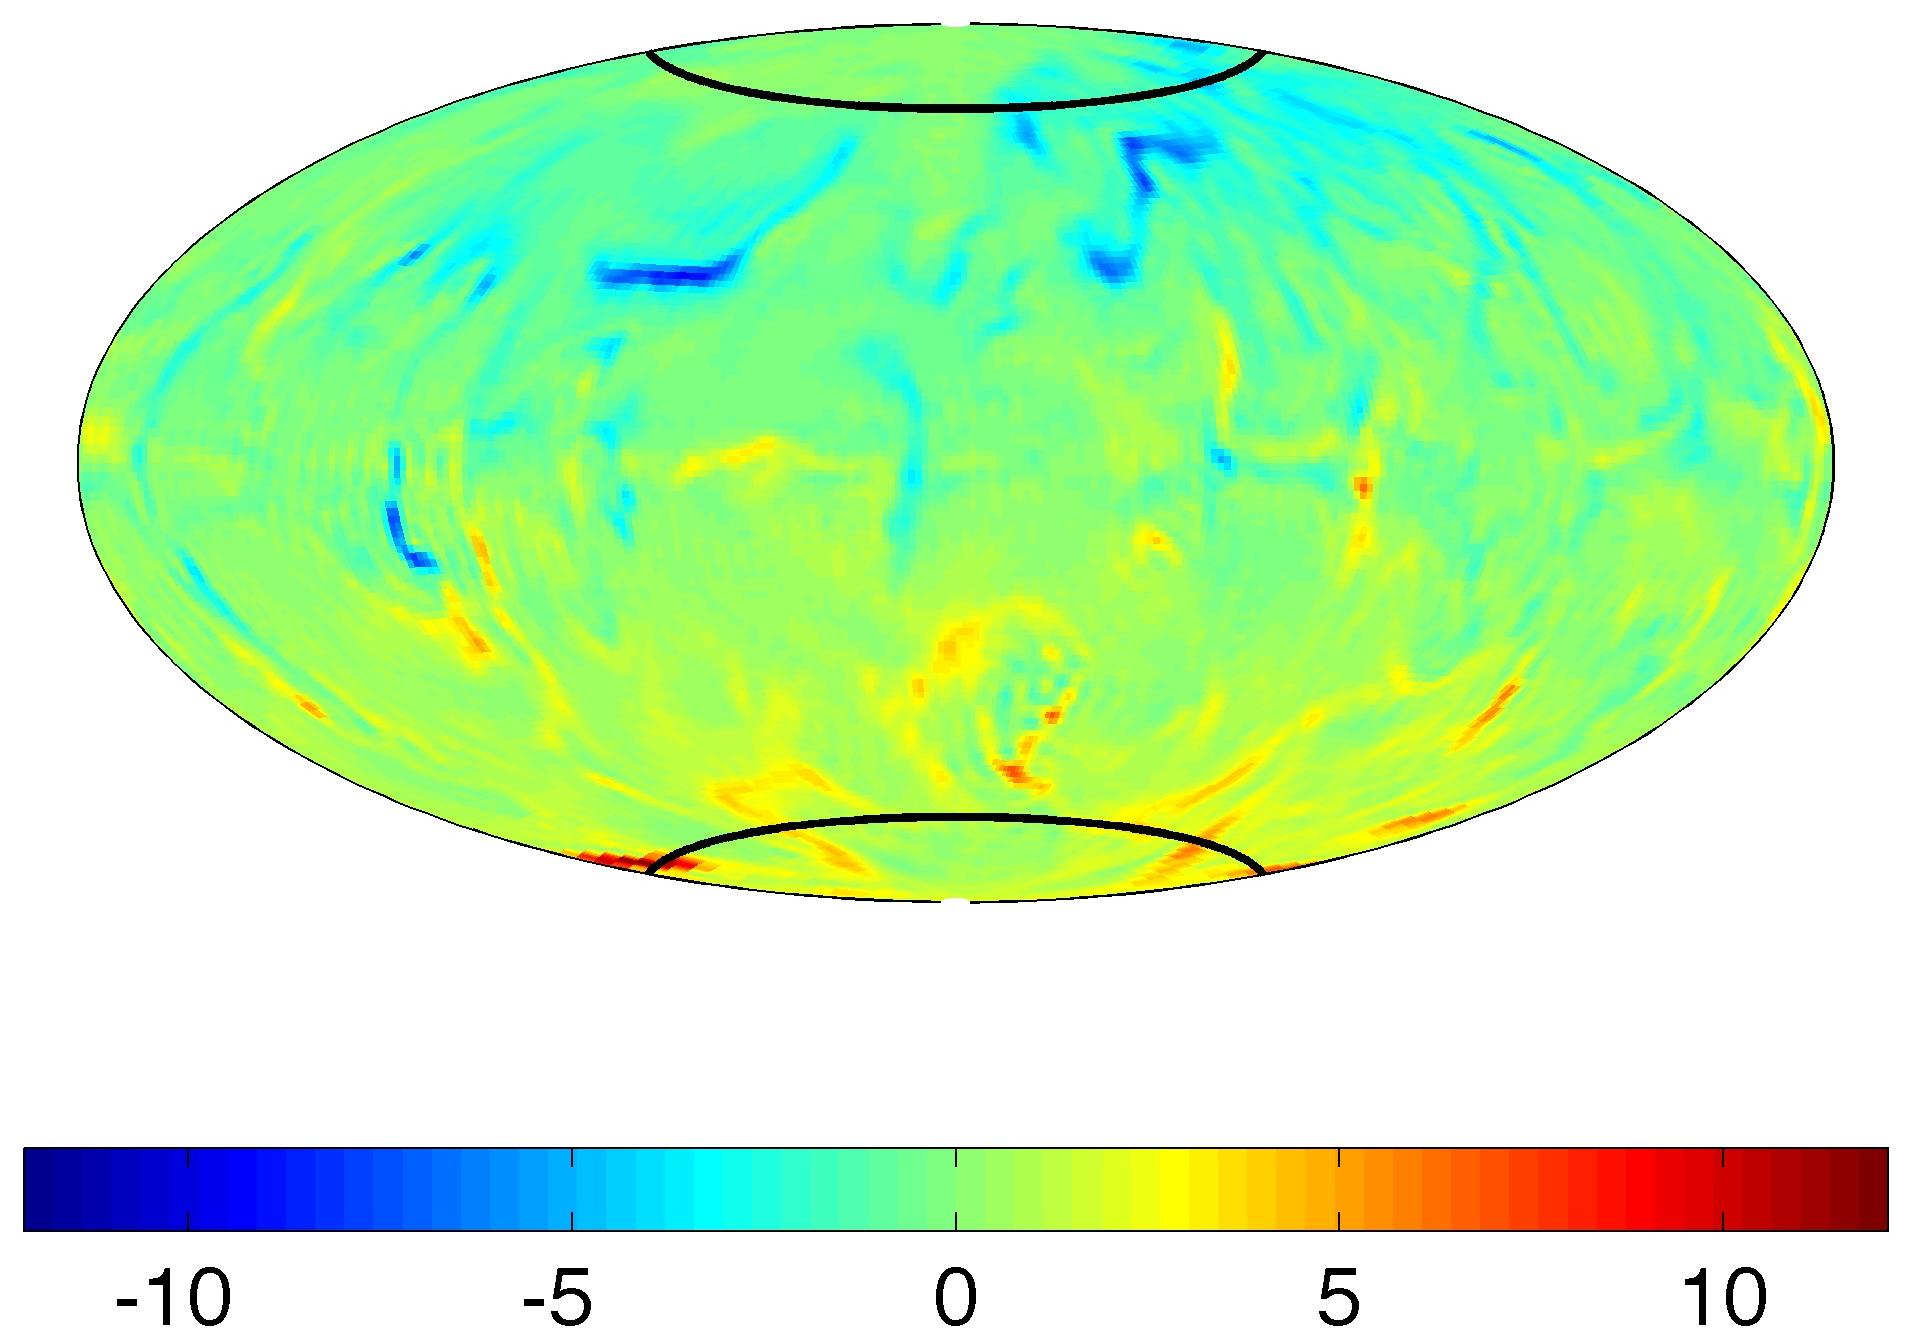
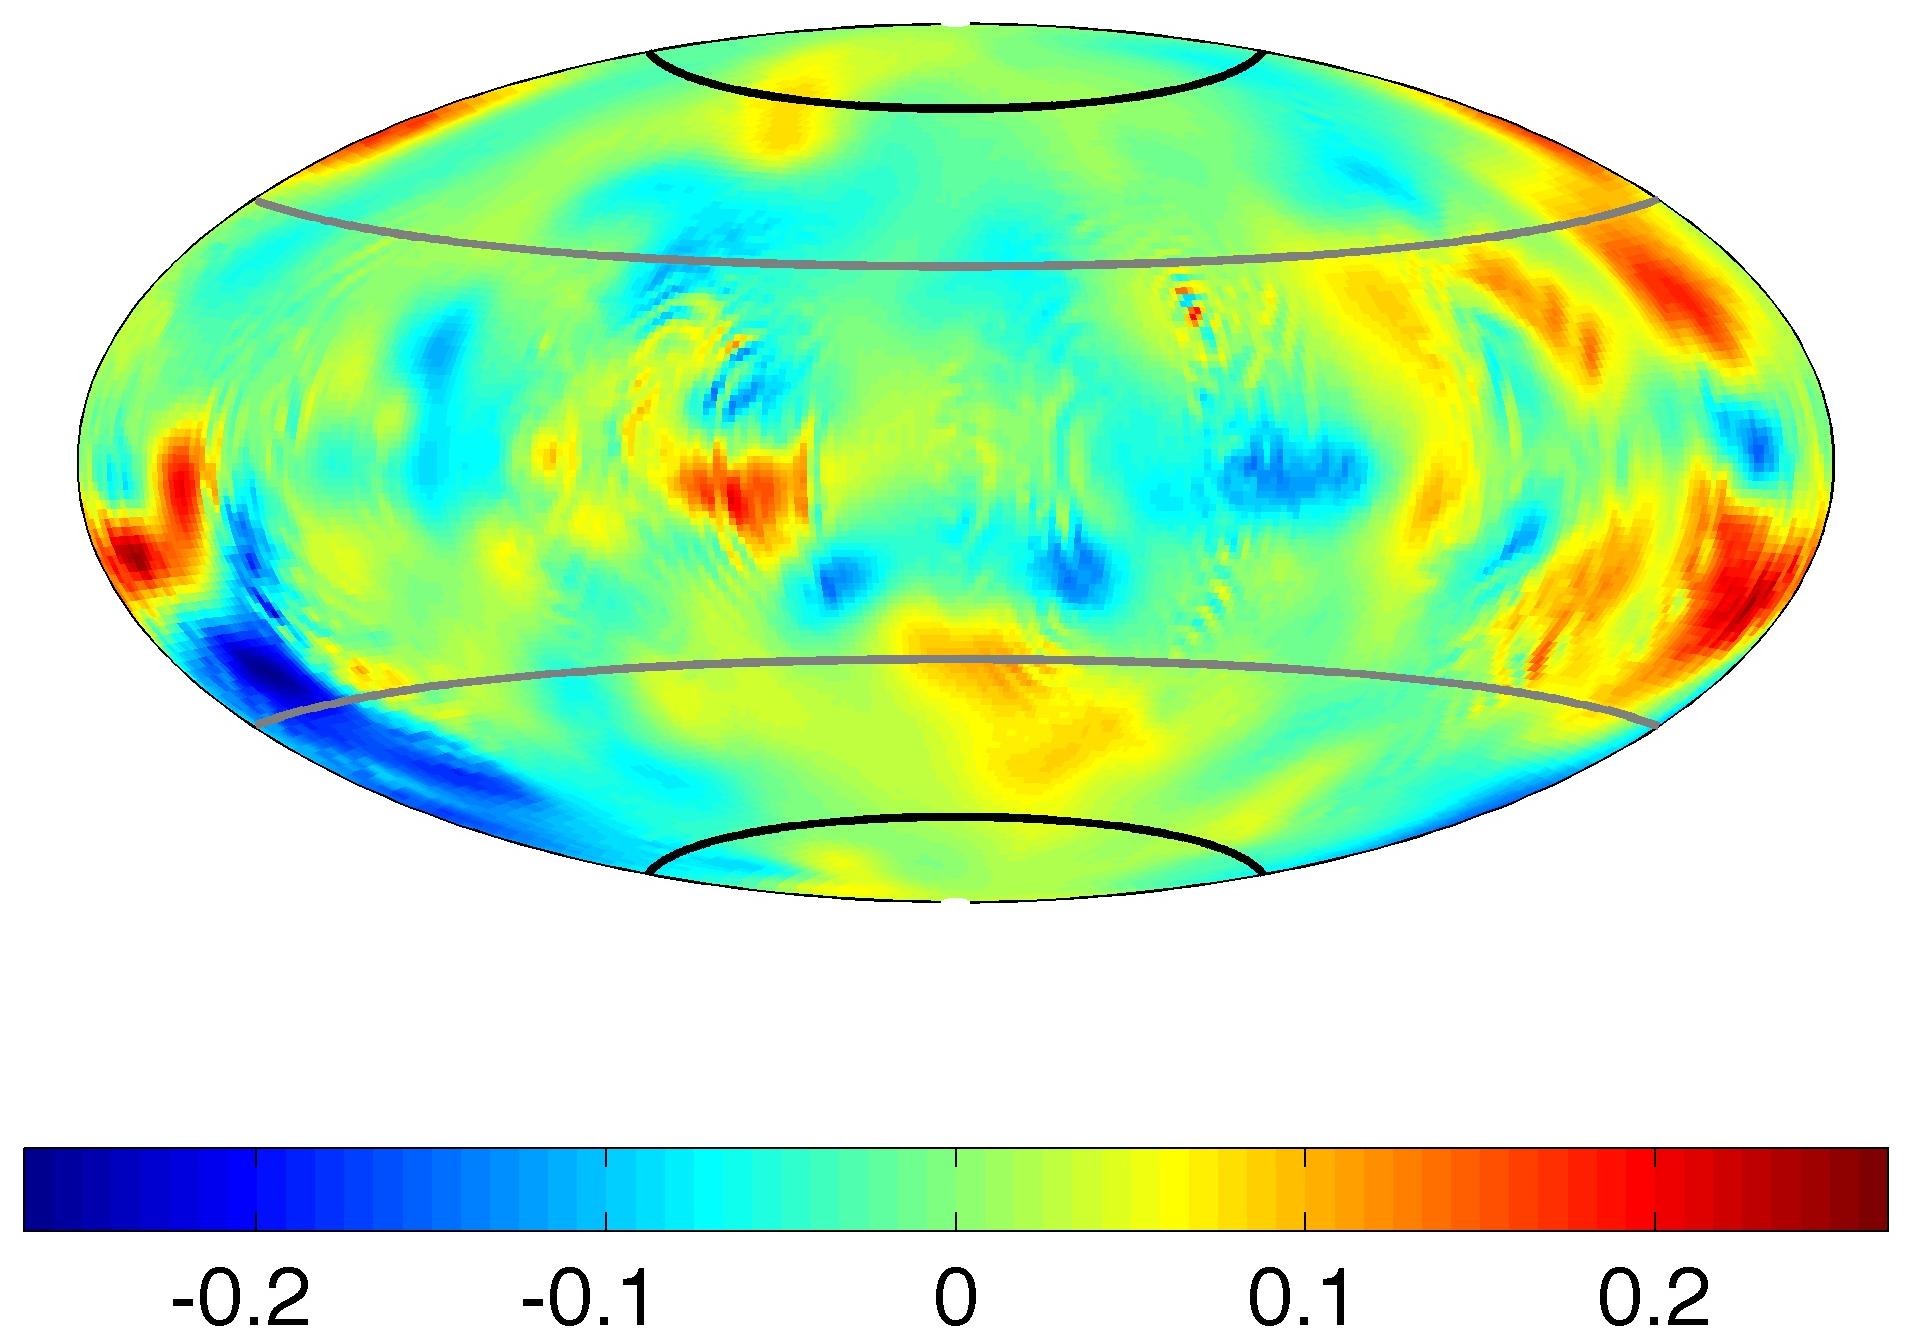
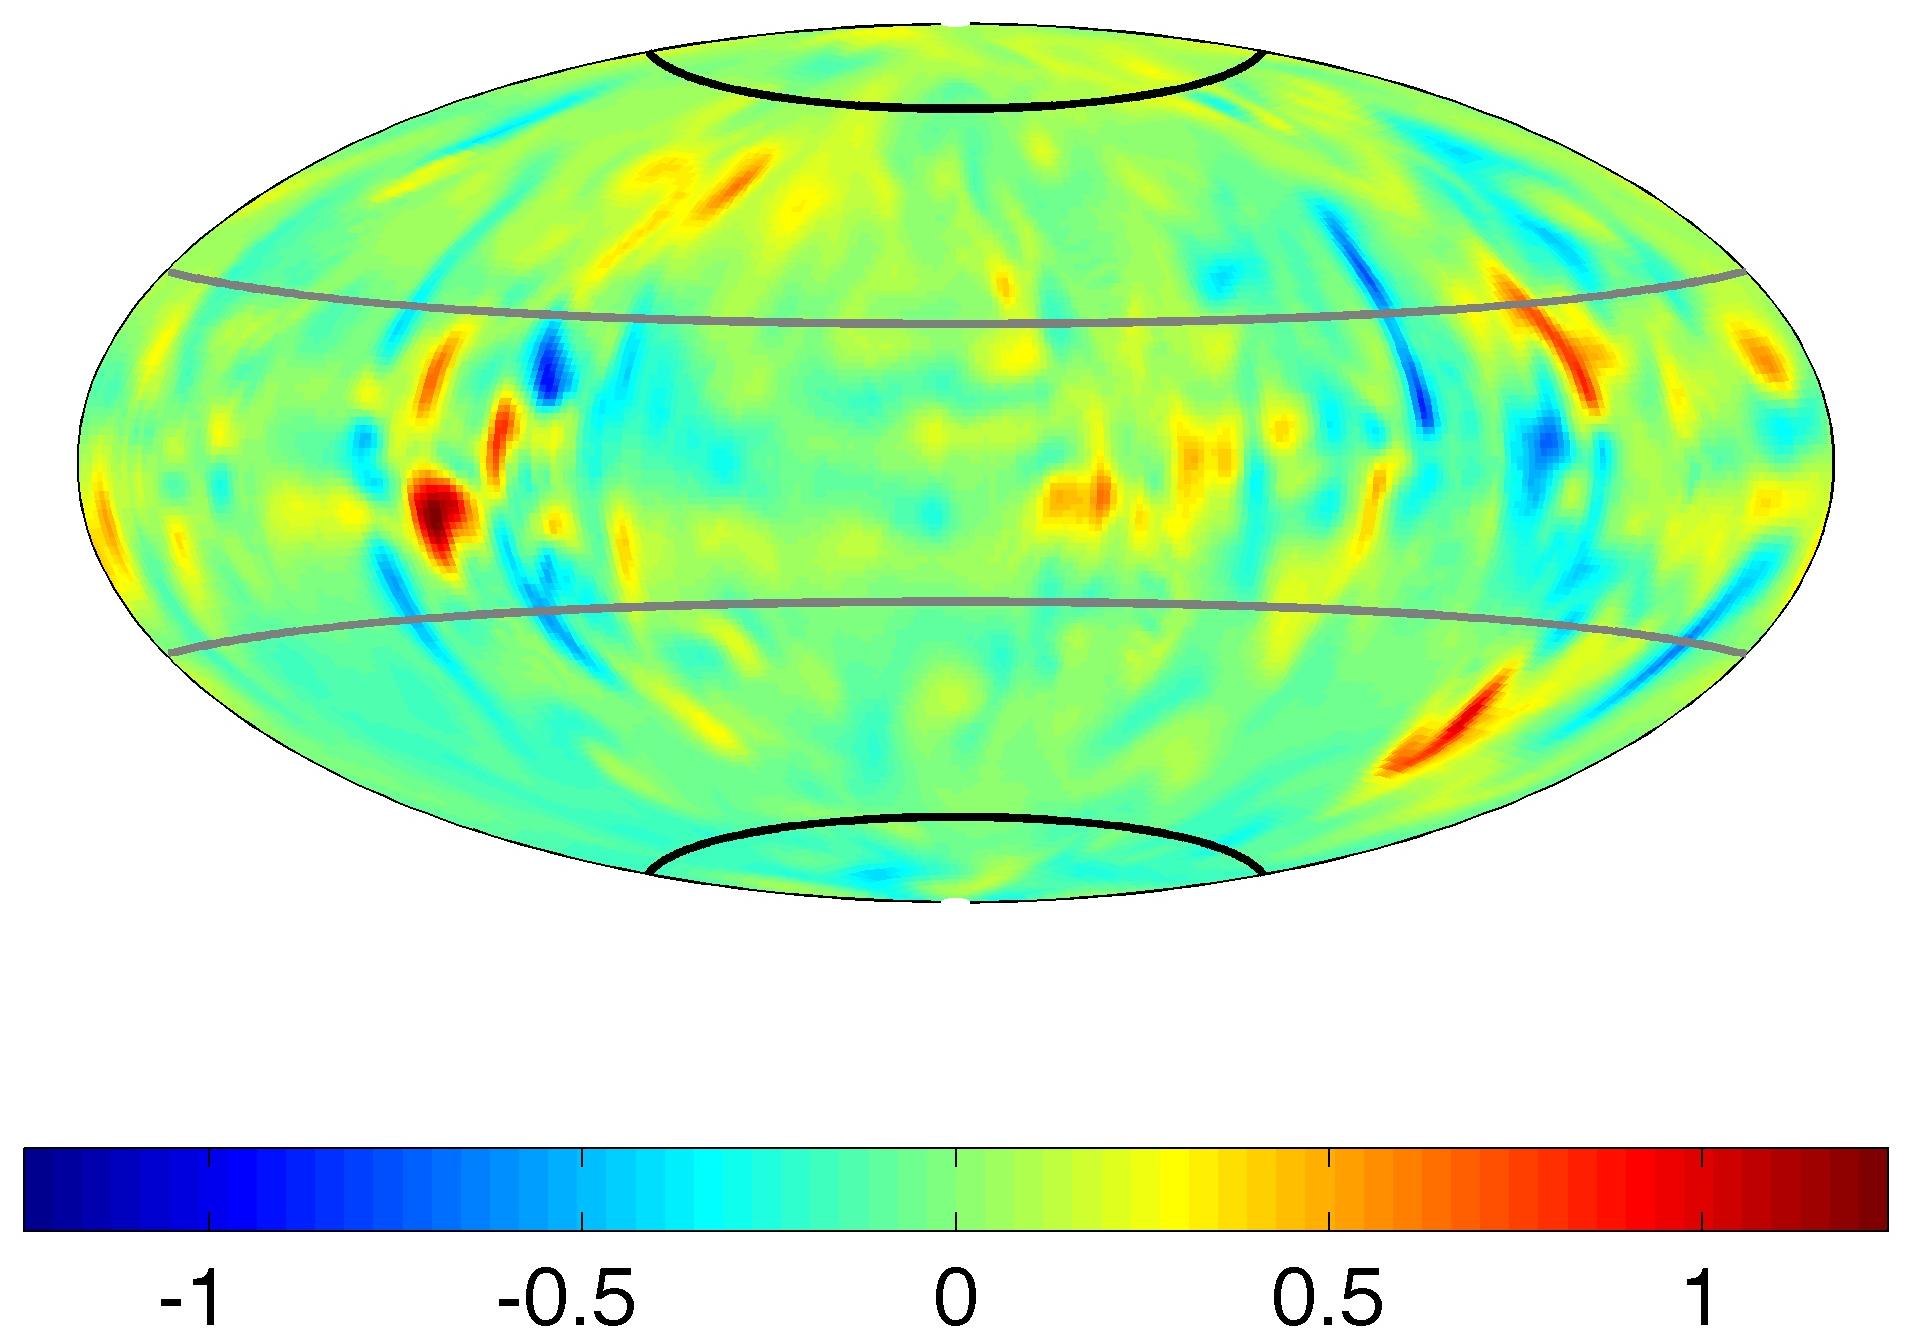
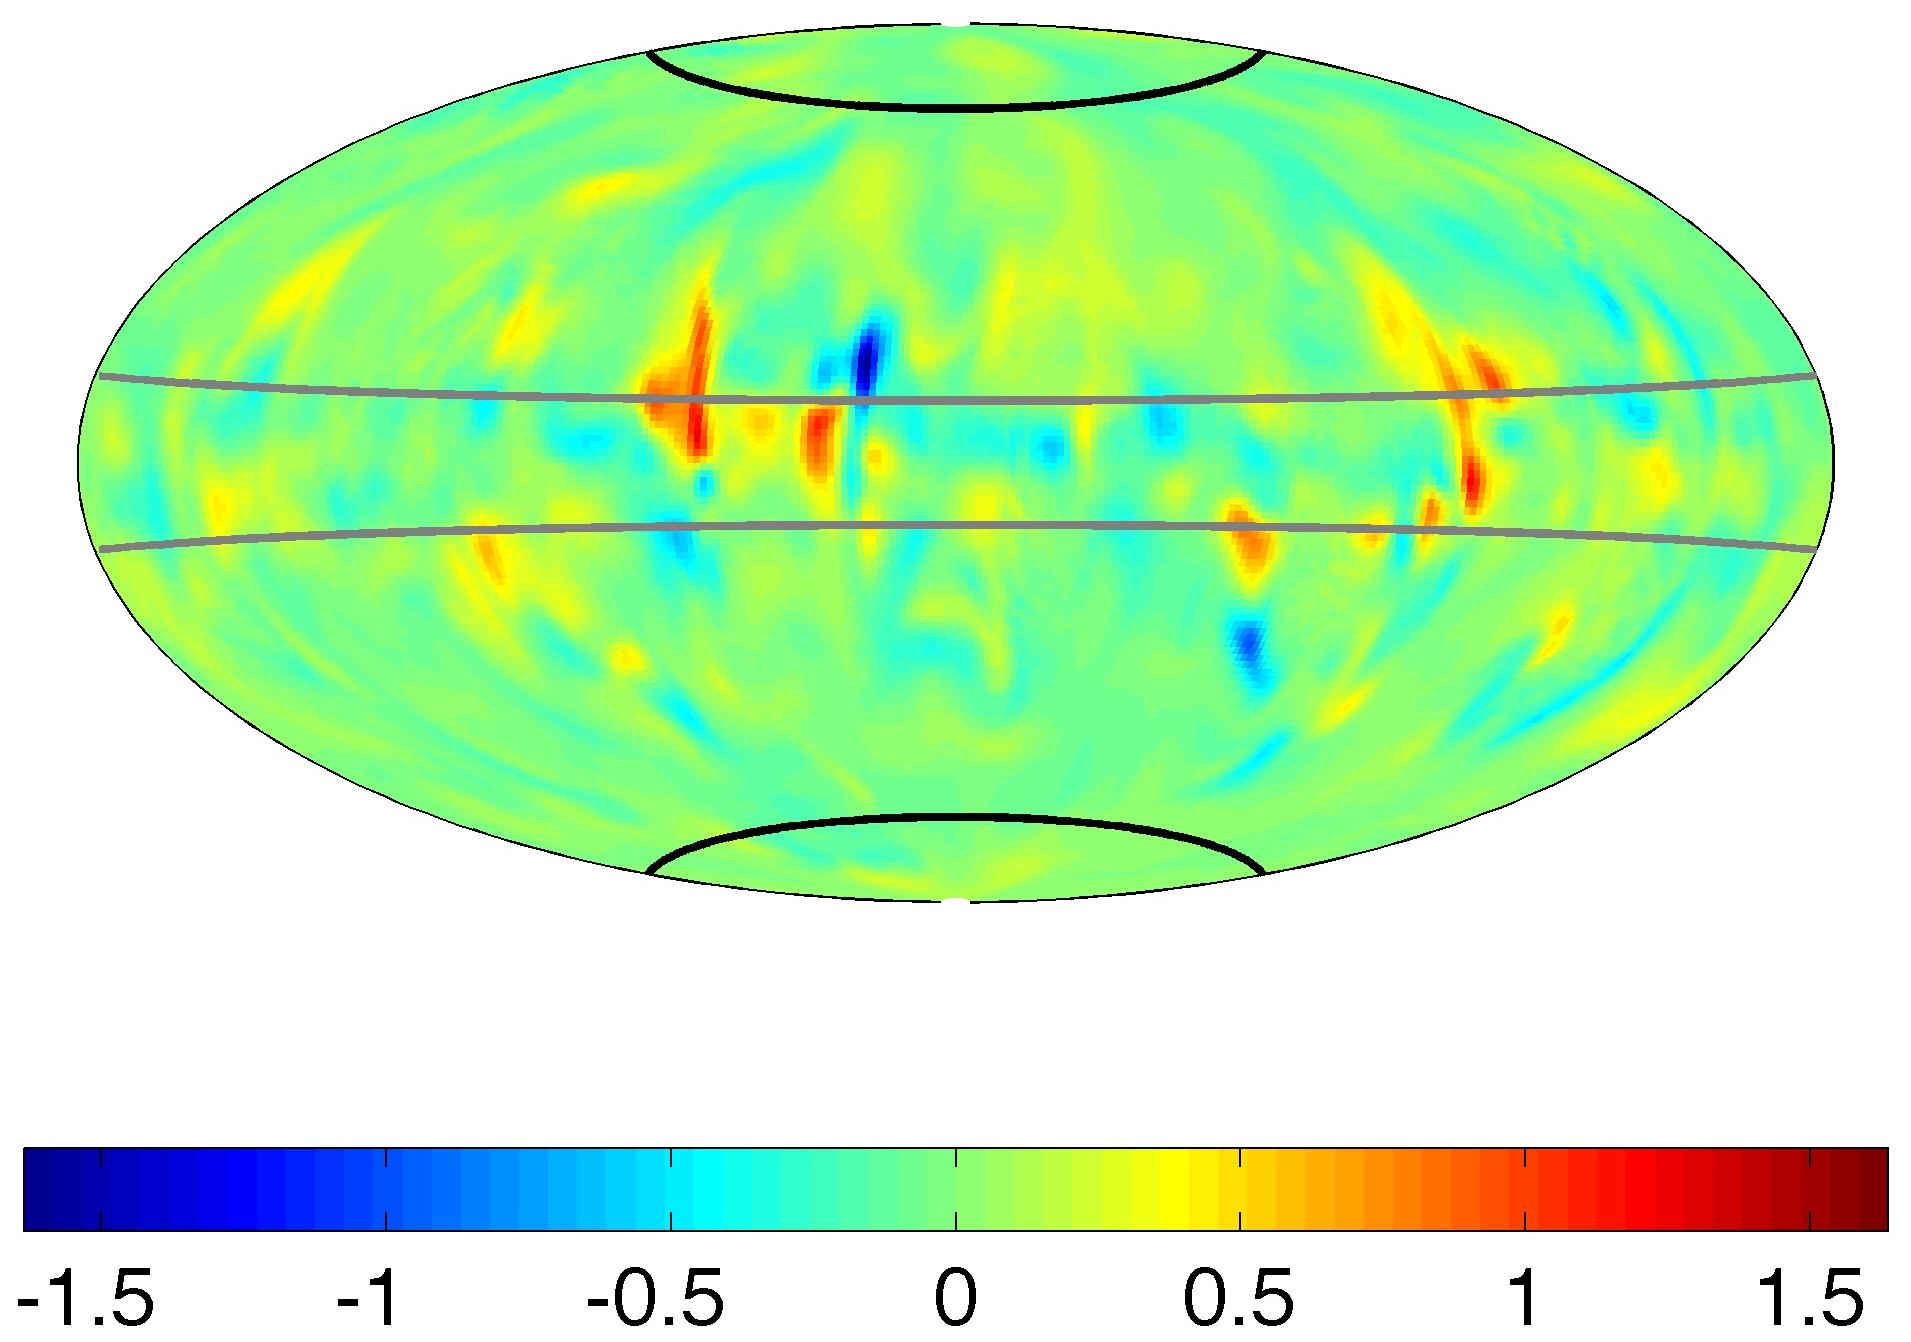
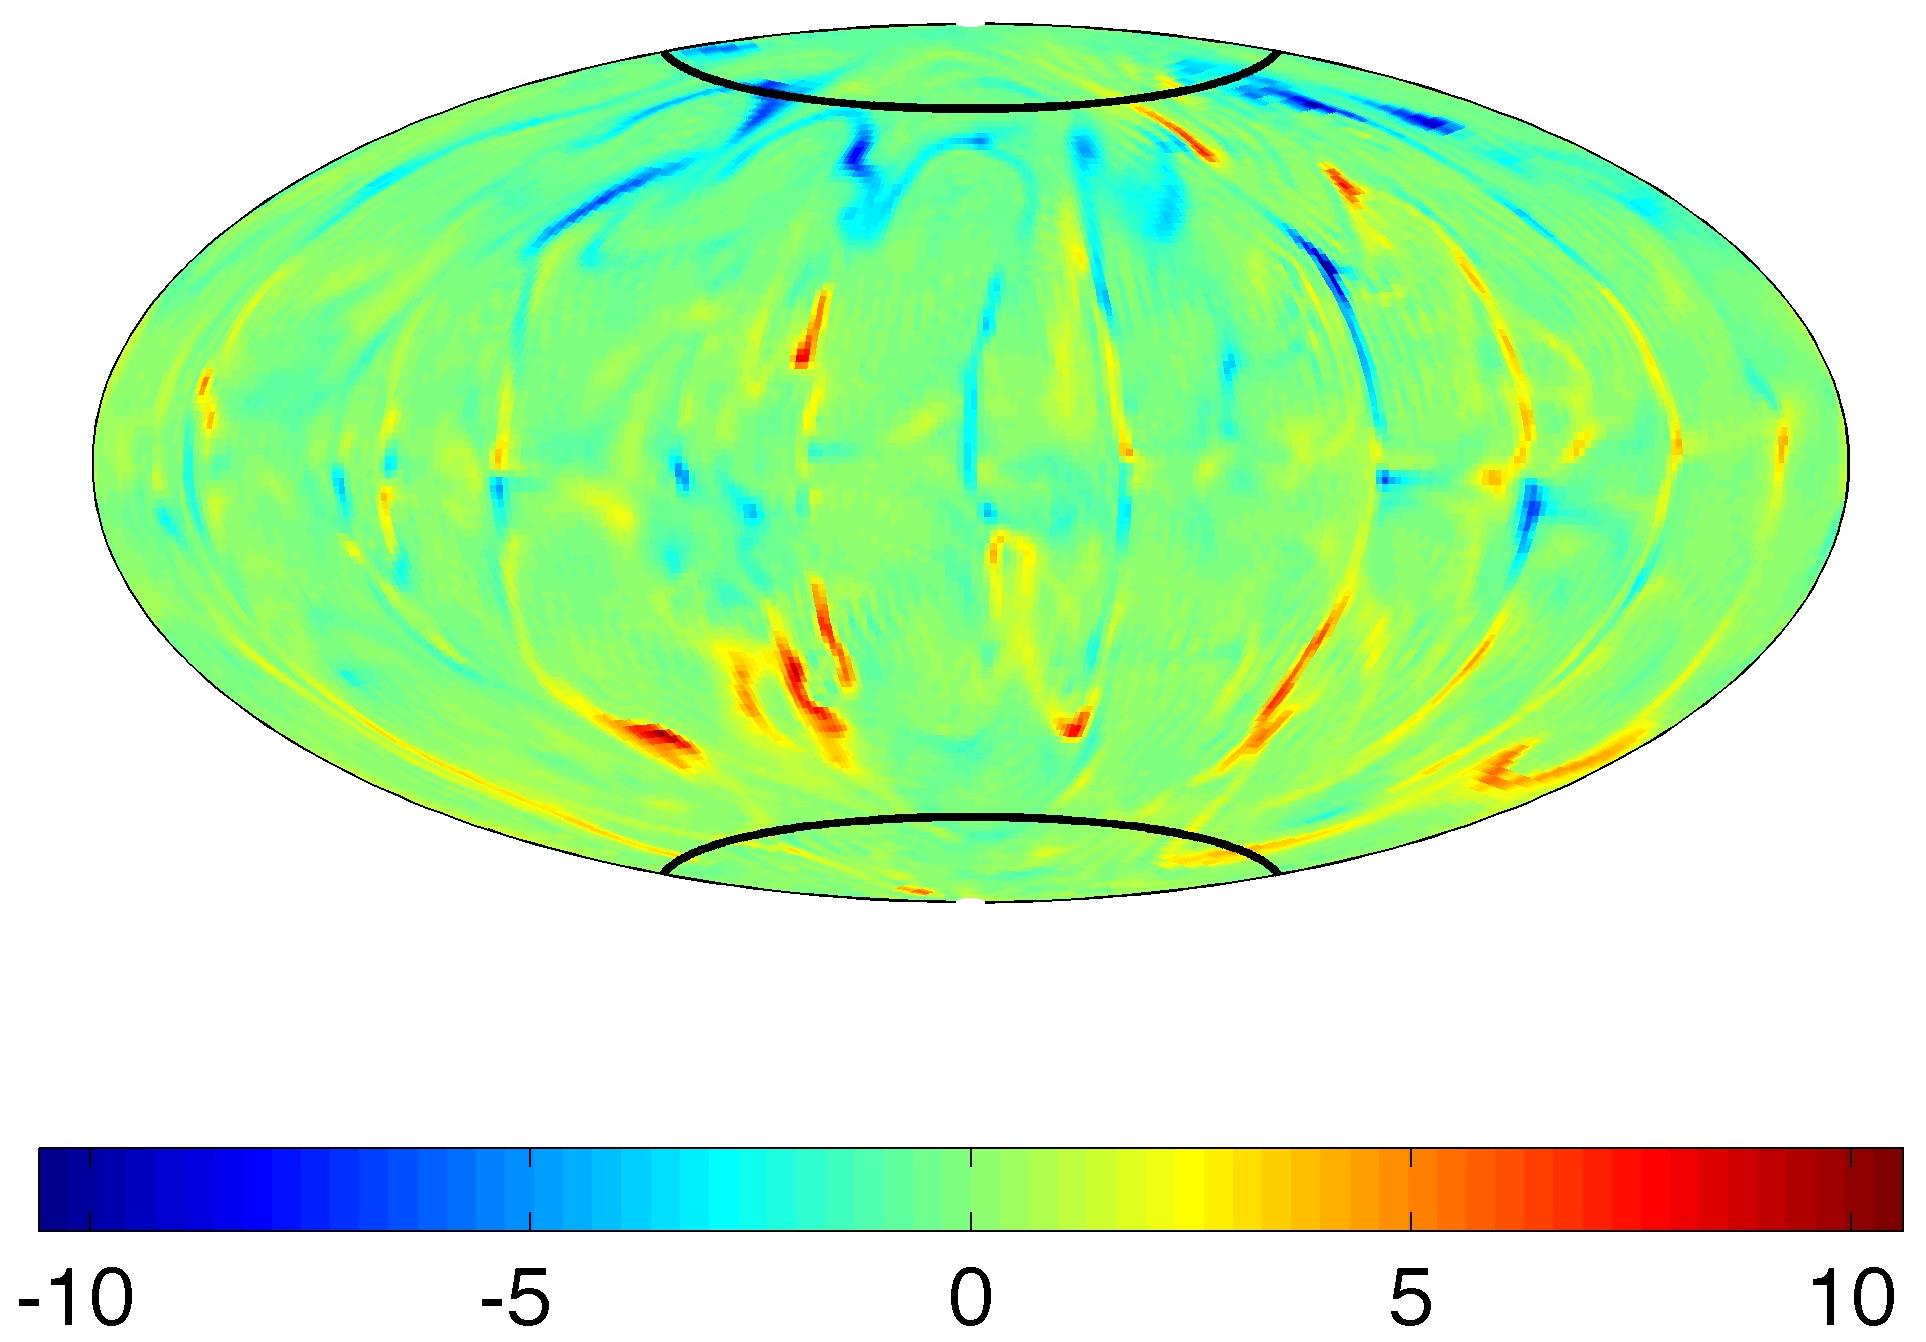
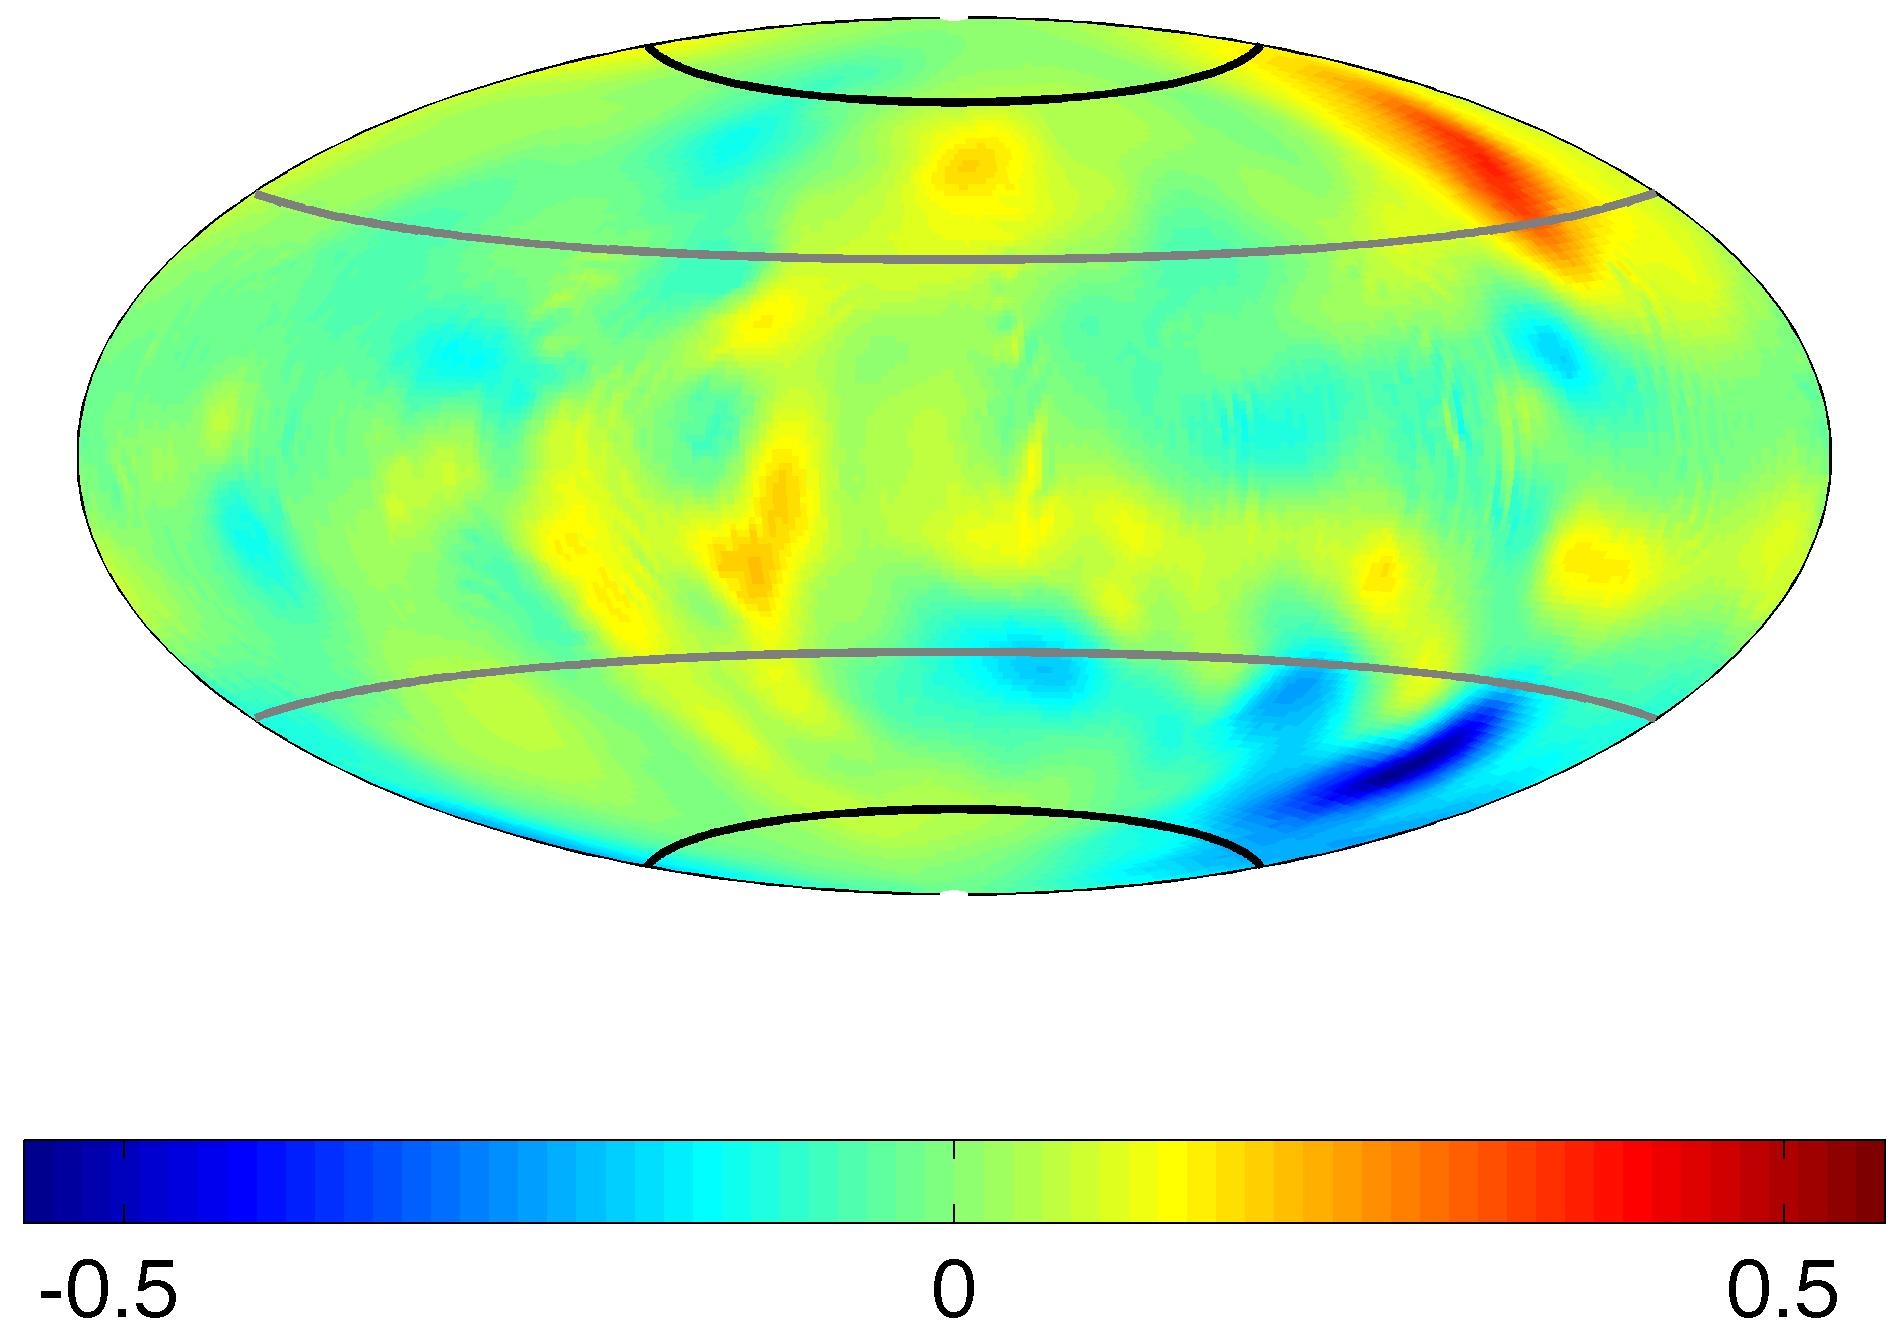
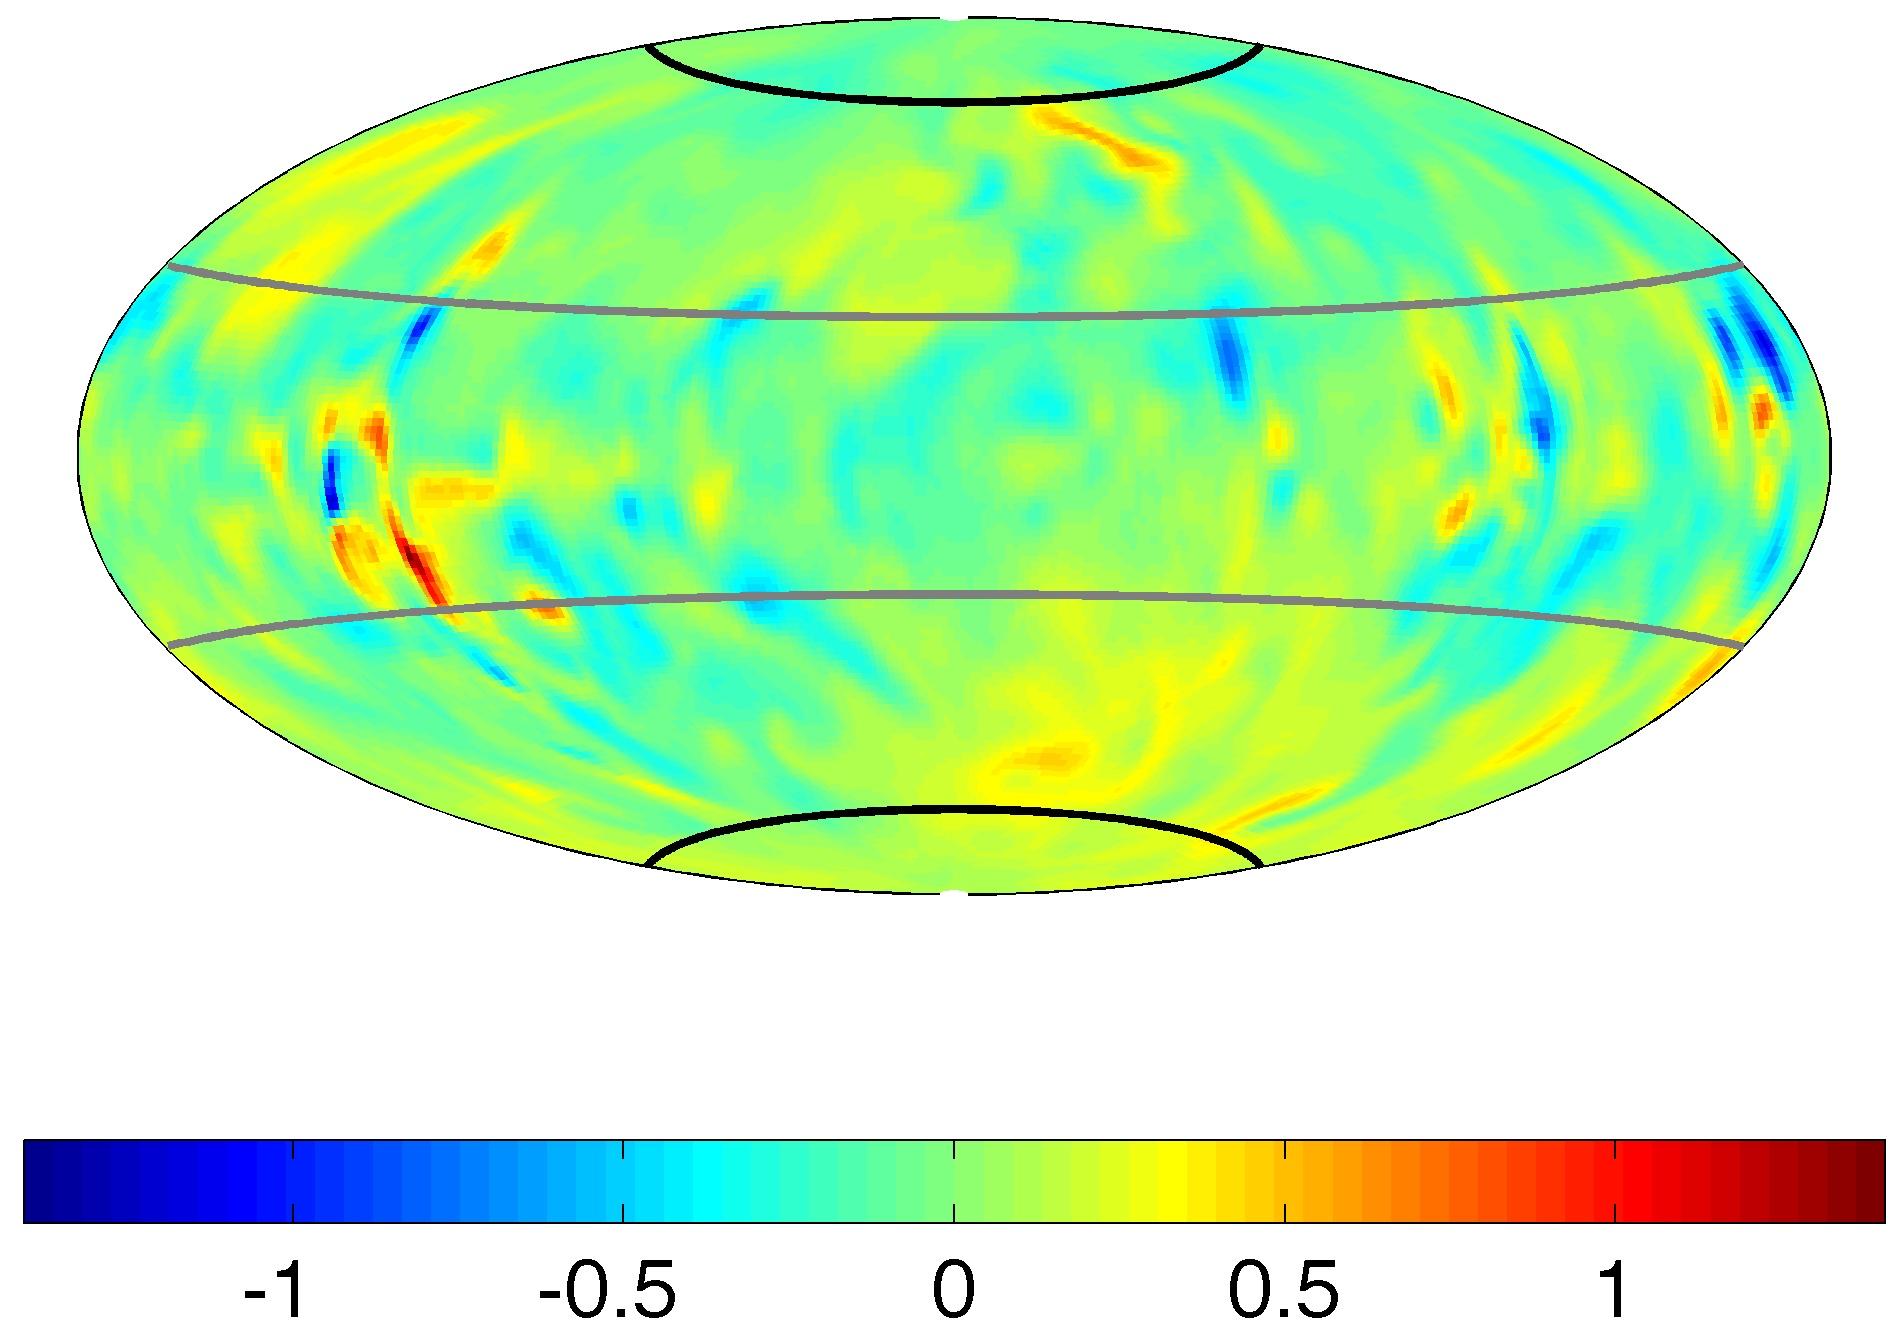
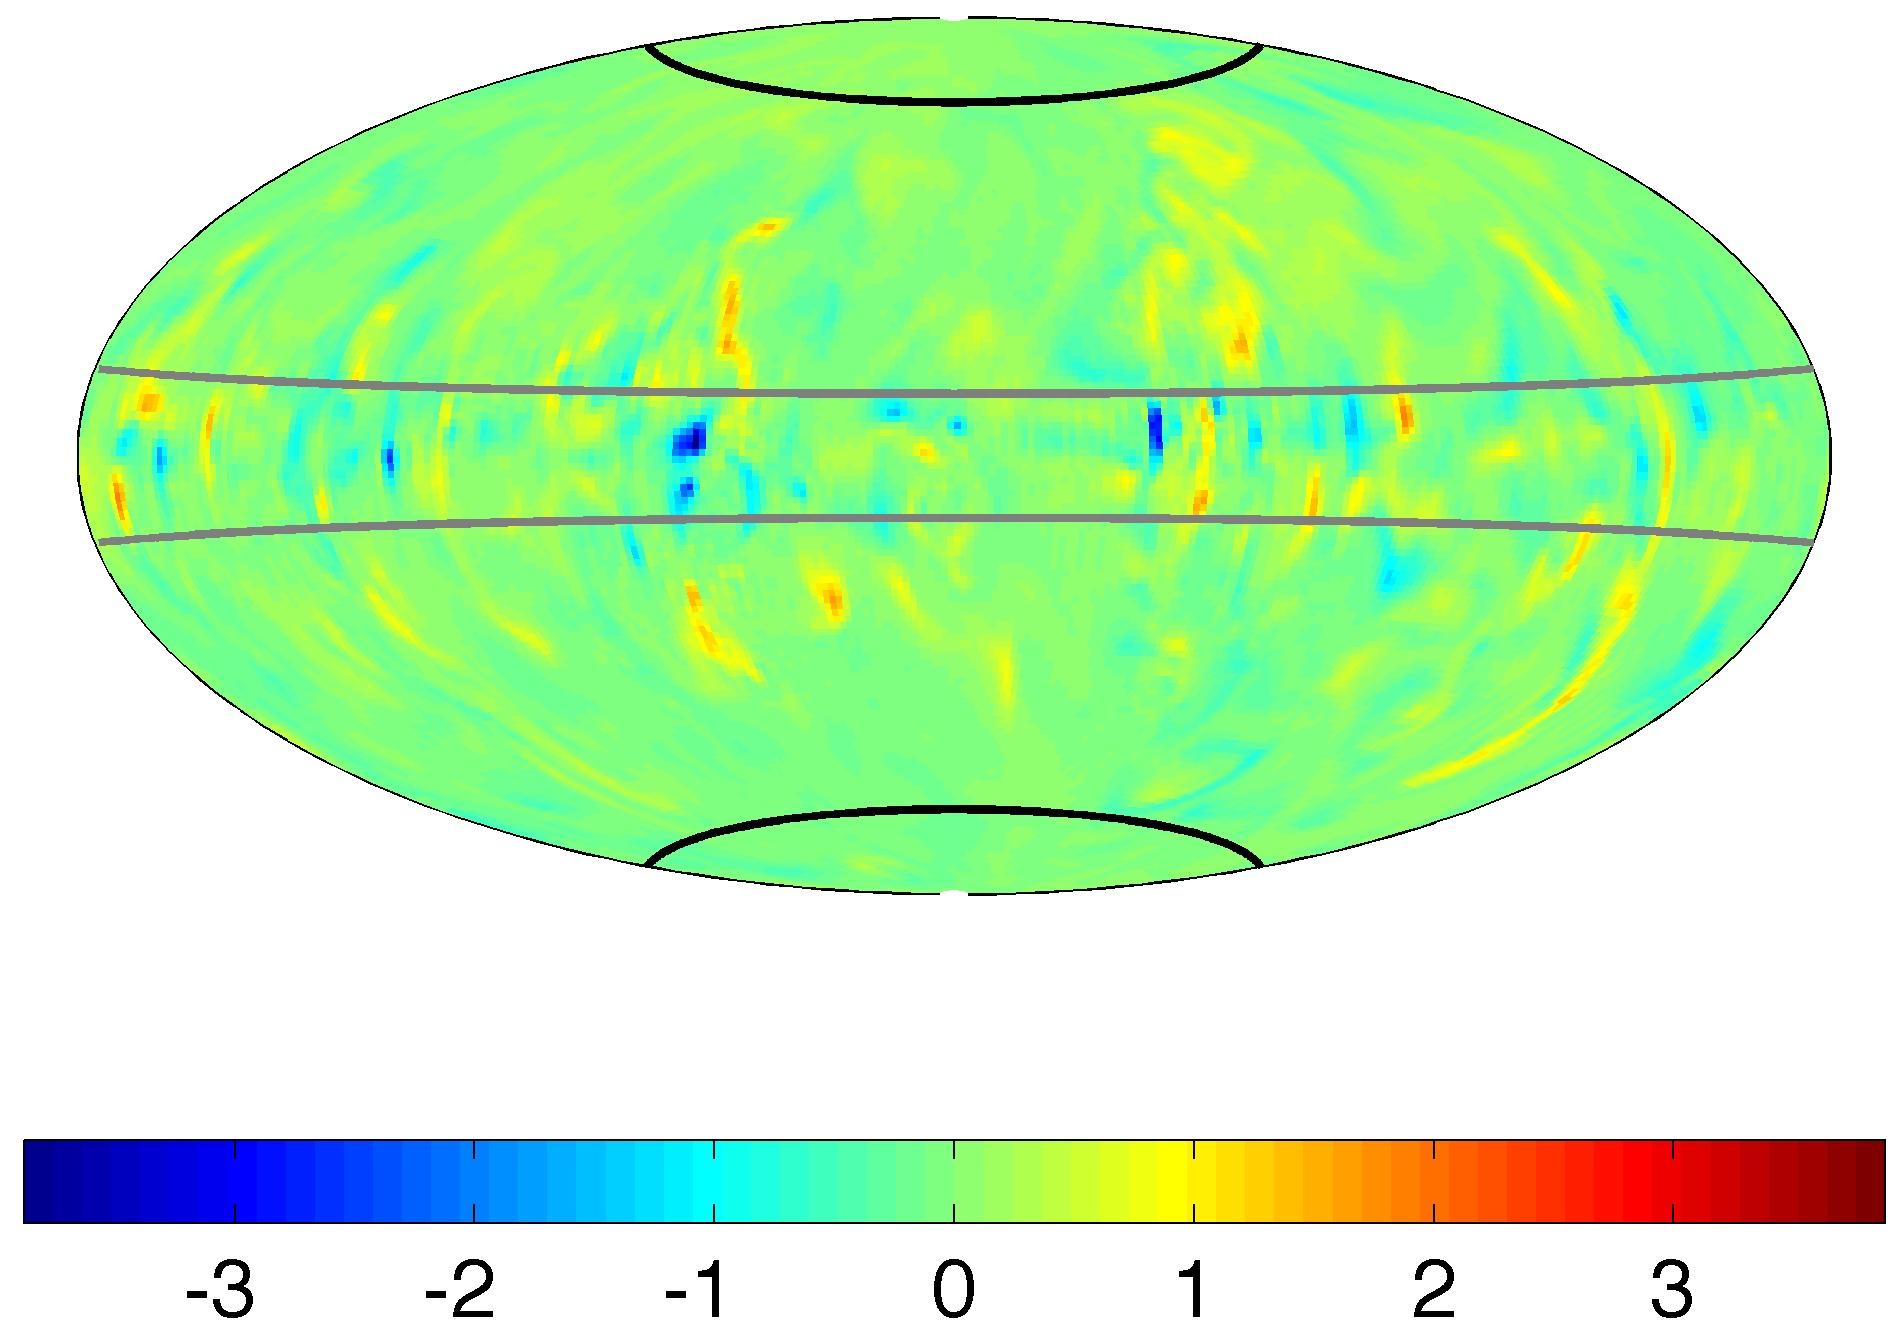
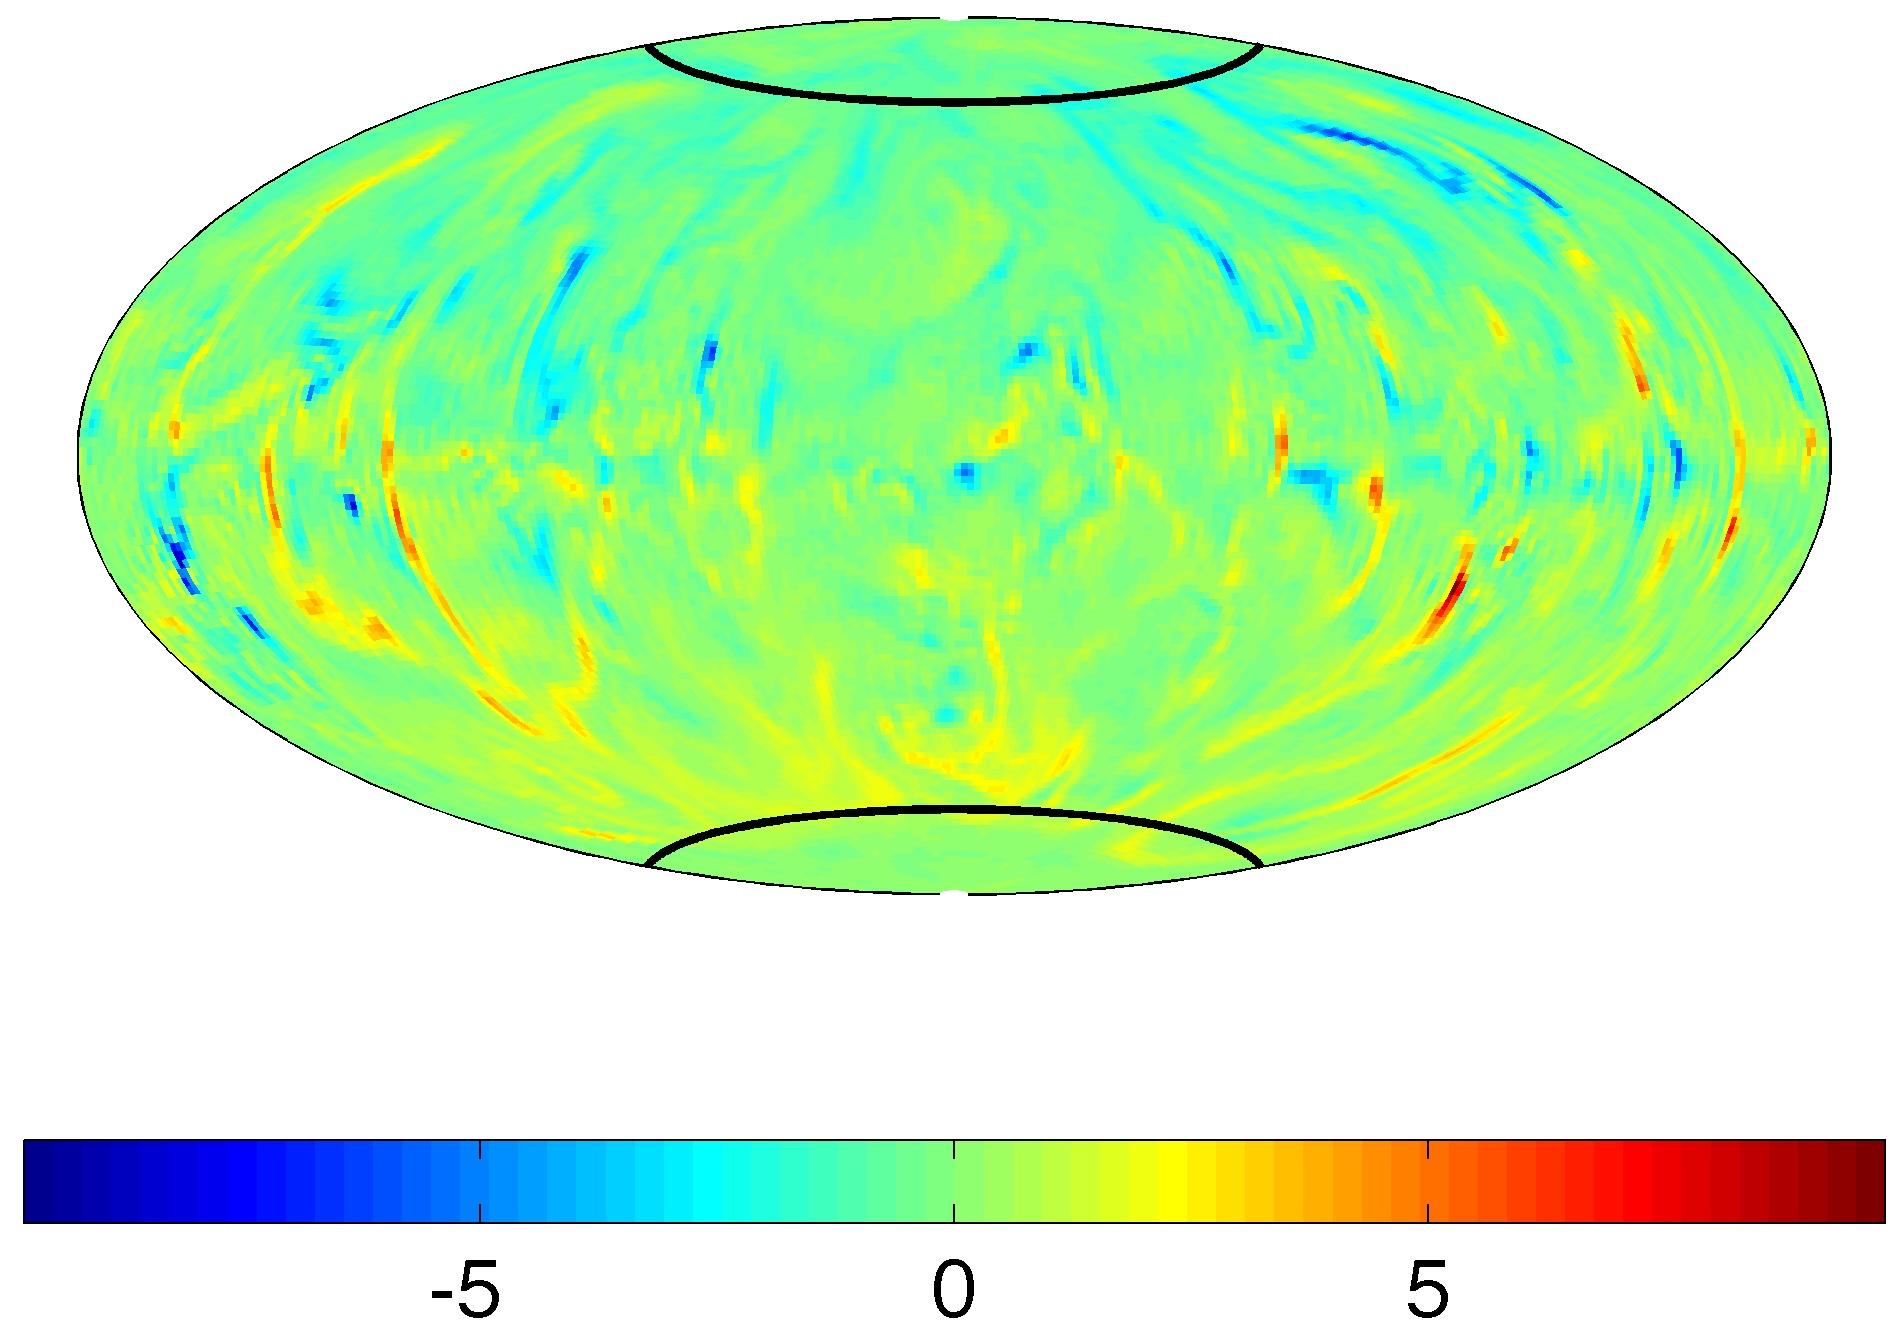
The radial component of the magnetic field at the top of the simulated fluid is shown in figure 8.
| A |
|
|
|
|
| B |
|
|
|
|
| C |
|
|
|
|
| C’ |
|
|
|
|
The symmetry of the magnetic field reflects the symmetry of the internal flow. Similarly, as found by Heimpel et al. (2005), for quasi-geostrophic flows (such as those in set A) the thermal plumes generate Taylor columns in the flow that transport magnetic field lines, resulting in a magnetic field morphology that correlates well with the flow and the thermal structure. For the weakly forced system (set A), the case with a homogeneous electrical conductivity results in a dipolar dominated dynamo with low non-axisymmetric components. The variable conductivity cases, where the magnetic field generated by the strong dynamo region has diffused through the low electrical conductivity fluid, exhibit a dominant dipolar field as well, which is highly axisymmetric (more so than the homogeneous case). In contrast, the strongly forced systems (sets B, C and C’), with a more disorganized flow regime, result in non-axisymmetric fields with significant higher degree components.
There is an identifiable transition in flow and magnetic field morphology that corresponds to different values of the conductivity profile radius ratio . For cases with thick variable conductivity layers (low ), thermal and flow fields resemble those of non-magnetic convection (see figures 5 and 6). In contrast, for relatively thin variable conductivity layers (high ) result in flow and magnetic fields that closely resemble the homogenous conductivity () cases. Such transition may be identified in Table 1 as a large increase in the CMB Elsasser number, , for increasing .
This transition in magnetic field morphology and magnitude corresponds as well to a change in the relative strength of Coriolis and Lorentz forces. Time averages of the Coriolis and Lorentz forces as a function of radius for sets B and C are shown in figures 9 and 10. The volume averages has been taken over cylinders of radius that have a symmetry axis parallel to .


In set B, runs where is large, the top of the core exhibits a balance between Lorentz and Coriolis forces, with the exception of the region included in the Ekman layer (i.e., the last three grid points at the top of the simulated volume). For set C, the Coriolis is balanced by Lorentz in . For both sets of magnetic cases with low , the sum of Lorentz, Coriolis and Reynolds stresses is completely dominated by the Coriolis force, which is balanced by viscous forces at the top of the core. In this set for the case with , it is hard to asses whether there is a balance between Coriolis and Lorentz forces or whether the Coriolis dominates.
6 Discussion
We find that the geometry and temporal variability of the magnetic field depends, to first order, on the spatial distribution of force balances. The decrease of the electrical conductivity at the top of the simulated fluid results in significant changes in the resultant flow regime.
Christensen and Aubert (2006) reported an increase in the wave number with increasing for non-magnetic convective runs, in agreement with experimental results (Aubert et al., 2001). They also point out that for magnetic cases the correlation between mean wave number and Rayleigh number is incoherent, and they attribute it to a difference in force balances present in the magnetic cases versus the non-magnetic cases. In our models, for weakly forced cases, the prograde tilt of the Taylor columns caused by the spherical boundary is allowed for the cases where the Lorentz force is small at the boundaries (i.e., and in set A). Based on the snapshots shown here, e.g., Figure 6, there is indication that the characteristic length scale of the flow depends not only on the presence or absence of the Lorentz force but also on its spatial distribution. A reduction in the Lorentz force at the top boundary results in an overall change in the flow for sets A and C, where the convection becomes similar to that of the non-magnetic case. In set B the flow behaviour is different for high/low electrical conductivity regions changing the characteristic length scale of the flow as a function of radius.
The models with free-slip boundaries (set C’) show that strong azimuthal flow in the non-magnetic case becomes weaker in regions of considerable electrical conductivity (see figure 5). This result is expected since strong zonal flows, can develop for free slip boundaries are damped by magnetic Lorentz forces. The Lorentz forces are proportional to the flow velocity and to the strength and volume of the conductive layer. In sets other than C’, the resultant velocity is weaker. This is also expected, since strong zonal flows do not develop in no-slip boundary systems.
6.1 Boundary layers
It has been suggested in a recent paper that rotating convection can be controlled largely by the boundary layers (King et al., 2009). They compare the relation between: 1) the thermal boundary layer, , where is the Nusselt number, is the heat capacity, and is the total heat flow at the top boundary; and 2) the Ekman boundary layer .
For non-magnetic rotating convection viscous and Coriolis forces govern the dynamics of the Ekman boundary layer. For convective dynamos there also exists the magnetic Lorentz force. The non-dimensional magnetic parameter analogous to the Ekman number is the Hartmann number which is defined as the ratio of Lorentz to viscous forces. Associated with the Hartmann number is the Hartmann boundary layer. Inside the Hartmann layer viscous forces are important, while outside the layer magnetic forces dominate. The Hartmann layer thickness is , where is the magnetic field normal to the surface (Potherat et al., 2002). Written in terms of the non-dimensional parameters used here,
| (14) |
where is a measure of the normalized electrical conductivity in the layer.
For this study the boundary layers are also affected by radially variable electrical conductivity. Decreasing the conductivity near the outer boundary decreases the Lorentz force. A decreased electrical conductivity allows for a thicker boundary layer in which turbulent and/or molecular viscous forces are important. Figure 11 shows the time averaged boundary layer thickness of Hartmann, Ekman and thermal boundary layers as a function of .

In sets A, C and C’ the Ekman boundary layer thickness is . When Lorentz forces do not influence the flow . This is case for in sets A, C and C’ as well as and in sets A and C’ (see also Table 1). In the case of set B where , only for , but for is only a factor of 3 times smaller than . The transition in the flow behavior, found to be a consequence of the force balances at the top of the core, is correlated to the relation between the Ekman and Hartmann boundary layers.
When pressure gradients and gravity forces are balanced by the Coriolis force the flow is in a geostrophic balance. If the Coriolis is balanced by Lorentz forces, the flow is said to be in a magnetostrophic balance. Noting that we keep the thermal boundary layer constant for each set, and that is always large (see Table 1 and figure 11), we found that the relative thickness of Hartmann and Ekman layers results in force balances at the top of the core allowing for Lorentz or Coriolis forces to control the flow, resulting in magnetostrophic () or geostrophic () systems.
Inspection of the radial magnetic field (Figure 8), reveals the interplay between the Ekman and Hartmann boundary layers, and the variable conductivity layers near the outer boundary for the various cases. For set A, a relatively low results in relatively weak magnetic field. Here the Hartmann layer thickness is similar to that of the low conductivity layer. For this set, we interpret the presence of strong surface radial magnetic field patches near the magnetic tangent cylinder to be indicative of the flow field, which tends to be deflected by a Hartmann layer topography (Potherat et al., 2002). For Set B, lower and higher , result in higher and a that is thinner than the variable conductivity layer in the cases with and . This results in high radial magnetic field patches at the outer surface outside the magnetic tangent cylinder (i.e., at lower latitudes than the intersection of the tangent cylinder with the outer surface).
In summary, for thick Hartmann layers, , the flow is unaffected by the presence of magnetic forces and it may be controlled by the relation between Ekman and thermal boundary layers (King et al., 2009). However for a thin layer, , the Lorentz forces dominate outside the Hartmann boundary layer while inside both, thermal and Ekman boundary layers. In our models, Ekman and Hartmann boundary layers define which force (Coriolis or Lorentz) is dominant just inside the region in which viscous forces are significant, so that the system follows a geostrophic or a magnetostrophic regime.
For rotating-convection, King et al. (2009) argue that for stress-free boundaries, there is a thermal Ekman layer which takes the place of the Ekman layer. Such layer would define the volume over which the rotation responds to density perturbations, modifying plume formation. They argue that the Ekman layer is dynamically important in stress-free systems. We find a transition in set C’ for to be between and This transition coincides with the change in the relation between and the traditional (see figure 11). This is consistent with the relevance of in the dynamics with or without stress-free boundary conditions.
6.2 Planetary implications
Computational limitations preclude the use of accurate diffusion coefficients in modeling the Earth and planets. Furthermore, since we have carried out only a few cases that show the correspondence of strong and a weak external magnetic fields to boundary layers with different viscosities and electrical conductivity profiles, we are not in a position to attempt to scale our present results to conditions in planetary interiors. However, we can come to some preliminary conclusions using estimated planetary values of the Ekman and Hartmann layer thicknesses. Considering turbulent molecular viscous diffusion we can estimate the earth-like Ekman numbers of and , respectively, yielding Ekman layer thickness estimates of order 200 m and 0.2 m, respectively. Considering an Elsasser number at the top of Earth’s core of 0.3 (Stevenson, 2003), the Hartmann to Ekman layer thickness of Earth may be estimated to be where both, Ekman and Hartmann layers thickness are comparable, and a magnetostrophic core is expected.
Observations of Mercury’s magnetic field by Mariner 10 and recent MESSENGER flybys are consistent with a Hermean magnetic field that is weaker by about two orders of magnitude, but roughly similar in morphology to that of Earth (a moderately tilted axial dipole). Because Mercury is small, and its rotation rate is quite low (its sidereal day is 58.6 Earth days), its Ekman number is about 100 times greater than that of Earth. The Elsasser number scales like , Mercury’s is less than that of Earth by a factor of roughly 1/500. Since the Hartmann layer thickness scales like we obtain estimates for a Hermean Hartmann to Ekman layer thickness to be where one expects a non-magnetostrophic flow.
7 Conclusions
In our models, the dynamo-generated magnetic field morphology and intensity are strongly affected by the relative strength of viscous, Coriolis and Lorentz forces near the outer boundary. The relative scale of Ekman and Hartmann boundary layer thicknesses is determined by an electrical conductivity gradient. For uniform electrical conductivity models Coriolis and Lorentz forces are typically of of the same order, yielding a magnetostrophic balance. Low electrically conductivity near the top boundary can separate the Ekman-Hartman layer into a thin Ekman layer and a thicker Hartmann layer, resulting in changes of the detailed magnetic field morphology, and a large-scale external magnetic field that is relatively weak (see Table 1). Given the likelihood of a high concentration of light element in Mercury’s core, it is plausible that a low electrical conductivity layer is present near the core mantle boundary. This means that the dynamics of the boundary layers obtained in our models may be applicable to conditions in Mercury’s core. Our results imply that a low conductivity layer is consistent with Mercury’s weak observable magnetic field. However, while radially variable electrical conductivity is the mechanism studied in this paper, it is one of several models that can result in weak magnetic fields. With the anticipated arrival of the MESSENGER spacecraft in orbit, we will soon be in a position to use detailed mapping to better constrain the relative contributions of the various dynamical processes that generate Mercury’s global magnetic field.
Acknowledgements
The authors thank S. C. Solomon and J. M. Aurnou for helpful comments on the manuscript, Erik King for enlightening discussions, and the two anonymous referees for comments and questions that broadened the focus and improved greatly the quality of the manuscript. At DTM, NGP has been supported by the NASA MESSENGER project and by the NASA Planetary Geology and Geophysics Program, under contract NASW-00002 and grant NNX07AP50G, respectively. Computational resources were provided by the Western Canada Research Grid (Westgird).
Appendix A Symbols
| Symbol | Description | units |
|---|---|---|
| polynomial exponent of the electrical conductivity function | ||
| thermal expansion coefficient | K-1 | |
| magnetic field induction vector | ||
| heat capacity | J (kg K)-1 | |
| shell radii ratio | ||
| electrically conductive volume radii ratio | ||
| Ekman boundary layer thickness | ||
| Hartmann boundary layer thickness | ||
| thermal boundary layer thickness | ||
| Ekman number | ||
| acceleration of gravity | ||
| acceleration of gravity at the CMB | ||
| Hartmann number | ||
| thermal diffusivity | m2s-1 | |
| maximum spherical harmonic degree | ||
| model-normalized Elsasser number | ||
| model-normalized CMB Elsasser number | ||
| model-normalized CMB radial field Elsasser number | ||
| fluid electrical diffusivity | m2s-1 | |
| normalized electrical diffusivity | ||
| electrical diffusivity at the ICB | m2s-1 | |
| magnetic energy in the fluid core | ||
| axisymmetric magnetic energy in the fluid core | ||
| magnetic energy at the CMB | ||
| axisymmetric magnetic energy at the CMB | ||
| magnetic permeability of vacuum | H m-1 | |
| Nusselt number | ||
| kinematic viscosity | m2s-1 | |
| Angular momentum | s-1 | |
| Pressure scalar | ||
| toroidal potential | ||
| poloidal potential | ||
| modified Magnetic Prandtl number | ||
| Prandtl number | ||
| total heat flux at CMB | ||
| ratio axisymmetric dipole to total magnetic energy | ||
| ratio axisymmetric dipole to total magnetic energy at the CMB | ||
| Unit vector in the radial direction | ||
| Fluid density | kg m-3 | |
| Rayleigh number | ||
| critical Rayleigh number for the onset of convection | ||
| Reynolds number | ||
| Shell internal radius | ||
| electrical conductivity transition radius | ||
| Shell external radius | ||
| fluid electrical conductivity | m-2s | |
| normalized electrical conductivity | ||
| electrical conductivity at the ICB | m-2s | |
| normalized electrical conductivity at | ||
| normalized electrical conductivity at the CMB | ||
| Temperature scalar | ||
| flow velocity vector | ||
| Unit vector in the direction of the angular momentum |
References
- Al-Shamali et al. (2004) Al-Shamali, F., Heimpel, M. H., Aurnou, J. M., 2004. Varying the spherical shell geometry in rotating thermal convection. Geophys. Astrophys. Fluid Dyn. 98, 153–169.
- Alexandrakis and Eaton (2007) Alexandrakis, C., Eaton, D. W., 2007. Empirical transfer functions: Application to determination of outermost core velocity structure using SmKS phases. Geophysical Research Letters 34, L22317.
- Anufriev et al. (2005) Anufriev, A., Jones, C., Soward, A., 2005. The Boussinesq and anelastic liquid approximations for convection in the Earth’s core. Physics of the Earth and Planetary Interiors 152, 163–190.
- Aubert et al. (2001) Aubert, J., Brito, D., Nataf, H., Cardin, P., Masson, J., 2001. A systematic experimental study of rapidly rotating spherical convection in water and liquid gallium. Physics of the Earth and Planetary Interiors 128 (1-4), 51–74.
- Birch (1952) Birch, F., 1952. Elasticity and constitution of the Earth interior. J Geophys Res 57, 227–286.
- Braginsky (1993) Braginsky, S. I., 1993. MAC-oscillations of the hidden ocean of the core. J Geomagn Geoelectr 45, 1517–1538.
- Braginsky (2007) Braginsky, S. I., 2007. Formation of the stratified ocean of the core: A ternary alloy model. Earth and Planetary Science Letters 253, 507–512.
- Buffett et al. (2000) Buffett, B., Garnero, E., Jeanloz, R., 2000. Sediments at the top of Earth’s core. Science 290, 1338–1342.
- Caracas and Verstraete (2009) Caracas, R., Verstraete, M., 2009. Fe-Si alloys in the lowermost mantle and the outer core. EosTrans. AGU 90 (22), Jt. Assem. Suppl. Abstract DI71A–07.
- Chandrasekhar (1961) Chandrasekhar, S., 1961. Hydrodynamic and Hydromagnetic stability. Dover.
- Christensen et al. (1998) Christensen, U., Olson, P., Glatzmaier, G., Jan 1998. A dynamo model interpretation of geomagnetic field structures. Geophysical Research Letters 25 (10), 1565–1568.
- Christensen et al. (1999) Christensen, U., Olson, P., Glatzmaier, G., 1999. Numerical modelling of the geodynamo: a systematic parameter study. Geophys J Int 138, 393–409.
- Christensen (2006) Christensen, U. R., 2006. A deep dynamo generating Mercury’s magnetic field. Nature 444, 1056–1058.
- Christensen and Aubert (2006) Christensen, U. R., Aubert, J., 2006. Scaling properties of convection-driven dynamos in rotating spherical shells and aplication to planetary magnetic fields. Geophys. J. Int. 166, 97–114.
- Christensen and Wicht (2008) Christensen, U. R., Wicht, J., 2008. Models of field generation in partly stable plantary cores: Applications to Mercury and Saturn. Icarus 196, 16–34.
- Clune et al. (1999) Clune, T., Elliott, J., Miesch, M., Toomre, J., Glatzmaier, G., Jan 1999. Computational aspects of a code to study rotating turbulent convection in spherical shells. Parallel Comput 25 (4), 361–380.
- Dormy et al. (1998) Dormy, E., Cardin, P., Jault, D., 1998. MHD flow in a slightly differentially rotating spherical shell, with conducting inner core. Earth and Planetary Science Letters.
- Evonuk and Glatzmaier (2004) Evonuk, M., Glatzmaier, G. A., 2004. 2D studies of various approximations used for modeling convection in giant planets. Geophysical and Astrophysical Fluid Dynamics 98, 241–255.
- Fearn and Loper (1981) Fearn, D., Loper, D., Jan 1981. The effect of composition upon the stratification of the core. Geophys J Roy Astr S 65 (1), 258–258.
- Featherstone et al. (2007) Featherstone, N. A., Browning, M. K., Brun, A. S., Toomre, J., 2007. Dynamo action in the presence of an imposed magnetic field. Astron. Nachr. 328, 1126–1129.
- Glatzmaier (1984) Glatzmaier, G., 1984. Numerical simulations of stellar convective dynamos .1. the model and method. J Comput Phys 55, 461–484.
- Glatzmaier and Roberts (1995) Glatzmaier, G., Roberts, P., 1995. A 3-dimensional self-consistent computer-simulation of a geomagnetic-field reversal. Nature 377, 203–209.
- Gómez-Pérez (2007) Gómez-Pérez, N., 2007. Planetary magnetic fields in the solar system: A numerical study of dynamo models. Ph.D. thesis, University of Alberta (Canada).
- Gómez-Pérez and Heimpel (2007) Gómez-Pérez, N., Heimpel, M. H., Oct 2007. Numerical models of zonal flow dynamos: An application to the ice giants. Geophys. Astrophys. Fluid Dyn. 101 (5 & 6), 371–388.
- Guillot (2005) Guillot, T., 2005. The interiors of giant planets: Models and outstanding questions. Ann. Rev. Earth Planet. Sci. 33, 493–530.
- Hauck et al. (2004) Hauck, S., Dombard, A., Phillips, R., Solomon, S., 2004. Internal and tectonic evolution of Mercury. Earth and Planetary Science Letters 222, 713–728.
- Heimpel and Kabin (2008) Heimpel, M., Kabin, K., 2008. Mercury redux. Nature Geosci 1, 564–566.
- Heimpel et al. (2005) Heimpel, M. H., Aurnou, J. M., Al-Shamali, F. M., Gómez Pérez, N., 2005. A numerical study of dynamo action as a function of spherical shell geometry. Earth Planet. Sci. Lett. 236 (1-2), 542–557.
- Jacobs (1975) Jacobs, J. A., 1975. The Earth’s Core. Vol. 10. Academic Press, London.
- Kageyama et al. (1993) Kageyama, A., Watanabe, K., Sato, T., 1993. Simulation study of a magnetohydrodynamic dynamo - convection in a rotating spherical-shell. Phys Fluids B-Plasma 5, 2793–2805.
- King et al. (2009) King, E. M., Stellmach, S., Noir, J., Hansen, U., Aurnou, J. M., 2009. Boundary layer control of rotating convection systems. Nature 457, 301–304.
- Kuang and Bloxham (1997) Kuang, W., Bloxham, J., 1997. An Earth-like numerical dynamo model. Nature 389, 371–374.
- Lister and Buffett (1998) Lister, J., Buffett, B., 1998. Stratification of the outer core at the core-mantle boundary. Physics of the Earth and Planetary Interiors 105, 5–19.
- Margot et al. (2007) Margot, J. L., Peale, S. J., Jurgens, R. F., Slade, M. A., Holin, I. V., 2007. Large longitude libration of Mercury reveals a molten core. Science 316, 710–714.
- McDonough (2003) McDonough, W. F., 2003. Compositional model for the Earth’s core. In: Carlson, R. W. (Ed.), The mantle and core. Elsevier-Pergamon, Oxford.
- Moffatt and Loper (1994) Moffatt, H., Loper, D., 1994. The magnetostrophic rise of a buoyant parcel in the Earth’s core. Geophys J Int 117, 394–402.
- Nellis (2000) Nellis, W., 2000. Metallization of fluid hydrogen at 140 GPa (1.4 Mbar): implications for Jupiter. Planetary and Space Science.
- Poirier (1994) Poirier, J., 1994. Light elements in the Earth’s outer core: A critical review. Phys. Earth Planet. Int. 85, 319–337.
- Potherat et al. (2002) Potherat, A., Sommeria, J., Moreau, R., 2002. Effective boundary conditions for magnetohydrodynamic flows with thin Hartmann layers. Phys. Fluids 14 (1), 403–410.
- Sakuraba and Kono (1999) Sakuraba, A., Kono, M., 1999. Effect of the inner core on the numerical solution of the magnetohydrodynamic dynamo. Physics of the Earth and Planetary Interiors 111, 105–121.
- Solomon et al. (2008) Solomon, S. C., McNutt, R. L., Watters, T., Lawrence, D. J., Feldman, W. C., , Head, J. W., Krimigis, S. M., Murchie, S. L., Phillips, R. J., Slavin, J. A., Zuber, M. T., 2008. Return to Mercury: A global perspective on MESSENGER’s first Mercury flyby. Science 321, 59–62.
- Stacey and Anderson (2001) Stacey, F., Anderson, O., 2001. Electrical and thermal conductivities of Fe-Ni-Si alloy under core conditions. Physics of the Earth and Planetary Interiors 124, 153–162.
- Stacey and Loper (2007) Stacey, F., Loper, D., 2007. A revised estimate of the conductivity of iron alloy at high pressure and implications for the core energy balance. Physics of the Earth and Planetary Interiors 161, 13–18.
- Stanley and Bloxham (2006) Stanley, S., Bloxham, J., 2006. Numerical dynamo models of Uranus’ and Neptune’s magnetic fields. Icarus 184, 556–572.
- Stanley and Mohammadi (2008) Stanley, S., Mohammadi, A., 2008. Effects of an outer thin stably stratified layer on planetary dynamos. Physics of the Earth and Planetary Interiors 168, 179–190.
- Stevenson (2003) Stevenson, D. J., 2003. Planetary magnetic fields. Earth Planet. Sci. Lett. 208, 1–11.
- Stevenson (2008) Stevenson, D. J., Jan 2008. Metallic helium in massive planets. P Natl Acad Sci Usa 105 (32), 11035–11036.
- Tanaka (2007) Tanaka, S., 2007. Possibility of a low P-wave velocity layer in the outermost core from global SmKS waveforms. Earth and Planetary Science Letters 259, 486–499.
- Wicht (2002) Wicht, J., 2002. Inner-core conductivity in numerical dynamo simulations. Physics of the Earth and Planetary Interiors 132, 281–302.
- Wood et al. (2006) Wood, B., Walter, M., Wade, J., 2006. Accretion of the Earth and segregation of its core. Nature 441, 825–833.