Asymptotic Giant Branch Stars in the Leo I Dwarf Spheroidal Galaxy
Abstract
Twenty six Asymptotic Giant Branch (AGB) variables are identified in the Local Group galaxy Leo I. These include 7 Mira and 5 semi-regular variables for which periods, amplitudes and mean magnitudes are determined. The large range of periods for the Miras, days, suggests an AGB spanning a significant age range. The youngest must be around 1.6 Gyr while the oldest could be 10 Gyr or more. Two of these old Miras are found in the outer regions of Leo I (over 490 arcsec from the centre) where stars on the extended AGB are rare. They could provide an interesting test of third dredge-up and mass loss in old stars with low metallicity and are worth further detailed investigation. At least two stars, one a Mira, the other an irregular variable, are undergoing obscuration events due to dust ejection.
An application of the Mira period-luminosity relation to these stars yields a distance modulus for Leo I of mag (internal), (total) (on a scale that puts the LMC at 18.39 mag) in good agreement with other determinations.
keywords:
stars: AGB and post-AGB – stars: variables: other –galaxies: dwarf – galaxies: individual: Leo I–Local Group – galaxies:stellar content.1 Introduction
This paper is one of a series aimed at finding and characterizing luminous Asymptotic Giant Branch variables within Local Group galaxies; it follows similar work on Phoenix and Fornax (Menzies et al. 2008; Whitelock et al. 2009). Menzies et al. (2002 hereafter Paper I) reported the discovery of several dust-enshrouded AGB stars in Leo I. Here we discuss multi-epoch photometry of those stars which enables us to characterise them. The large-amplitude, or Mira, variables are of particular interest, first, because they tell us about the intermediate age population of which they are the most luminous representatives, secondly because they provide an independent distance calibration, via the period-luminosity (PL) relation (Whitelock et al. 2008), and thirdly because they will be major contributors to the processed material currently entering the interstellar medium of Leo I and are therefore an important source of enrichment.
Leo I is one of the most distant of the Local Group Galaxies associated with the Milky Way. It has a complex star formation history (Gallart et al. 1999; Hernandez et al. 2000; Dolphin 2002) with evidence for star formation over much of its lifetime. The most recent episode occurred about 1 Gyr ago and may have been the result of Leo I’s interaction with the Milky Way (Mateo, Olszewski & Walker 2008). Most published work indicates little evidence for population gradients (e.g. Koch et al. 2007). However, Mateo et al. (2008) find that the AGB stars are almost exclusively located within a radius of 400 arcsec whereas giant branch (GB) stars have a more extended distribution. The analysis of infrared photometry by Held et al. (2010) also indicates a strong radial gradient in the intermediate-age populations and supports the findings by Mateo et al.
| L# | Memb | other name | ||||||
|---|---|---|---|---|---|---|---|---|
| (equinox 2000.0) | ————– (mag) —————– | |||||||
| 10:08:02.7 | 12:17:56 | 6010 | 16.00 | 15.29 | 15.04 | 0.96 | ||
| 10:08:07.9 | 12:15:18 | 6014 | 16.36 | 15.52 | 15.35 | 1.01 | m | MOW253 |
| 10:08:10.7 | 12:17:24 | 6020 | 16.66 | 15.87 | 15.74 | 0.92 | m | MOW167 |
| 10:08:10.9 | 12:12:40 | 7019 | 16.70 | 15.97 | 15.89 | 0.81 | ||
| 10:08:14.5 | 12:18:02 | 1024 | 16.07 | 15.27 | 15.07 | 1.00 | m | MOW104 |
| 10:08:14.5 | 12:18:02 | 6011 | 16.10 | 15.28 | 15.08 | 1.02 | ||
| 10:08:14.9 | 12:14:04 | 7012 | 15.76 | 15.05 | 14.89 | 0.87 | ||
| 10:08:15.7 | 12:18:14 | 1069 | 16.70 | 15.98 | 15.80 | 0.90 | ||
| 10:08:15.7 | 12:18:14 | 6022 | 16.71 | 16.00 | 15.80 | 0.90 | ||
| 10:08:15.8 | 12:20:32 | 1098 | 16.40 | 15.66 | 15.48 | 0.93 | m | MOW124 |
| 10:08:15.8 | 12:20:32 | 6026 | 16.42 | 15.65 | 15.47 | 0.95 | ||
| 10:08:16.6 | 12:20:07 | 1093 | 16.41 | 15.69 | 15.45 | 0.97 | m | MOW101,ALW19 |
| 10:08:17.0 | 12:18:15 | 1070 | 16.67 | 15.92 | 15.75 | 0.92 | m | MOW78 |
| 10:08:17.1 | 12:18:52 | 1078 | 16.56 | 15.80 | 15.64 | 0.92 | m | MOW77 |
| 10:08:17.5 | 12:16:15 | 1054 | 16.99 | 16.20 | 16.02 | 0.97 | m | MOW110 |
| 10:08:18.0 | 12:20:09 | 1038 | 16.13 | 15.34 | 14.98 | 1.15 | ||
| 10:08:19.4 | 12:17:07 | 1056 | 16.44 | 15.70 | 15.40 | 1.04 | m | MOW67,ALW1 |
| 10:08:20.2 | 12:17:58 | 1010 | 15.28 | 14.50 | 14.32 | 0.96 | ||
| 10:08:20.4 | 12:17:45 | 1061 | 16.97 | 16.20 | 16.02 | 0.95 | m | MOW43 |
| 10:08:21.3 | 12:14:43 | 1016 | 16.00 | 15.21 | 14.96 | 1.05 | m | MOW161 |
| 10:08:21.4 | 12:13:49 | 8023 | 16.38 | 15.61 | 15.37 | 1.01 | m | MOW193 |
| 10:08:22.0 | 12:18:49 | 1030 | 16.25 | 15.48 | 15.32 | 0.94 | ||
| 10:08:22.0 | 12:19:37 | 1088 | 16.56 | 15.80 | 15.61 | 0.95 | m | MOW38 |
| 10:08:23.2 | 12:18:38 | 1029 | 16.46 | 15.69 | 15.50 | 0.96 | m | MOW12 |
| 10:08:23.9 | 12:17:08 | 1057 | 16.41 | 15.63 | 15.48 | 0.94 | m | MOW36 |
| 10:08:24.5 | 12:20:40 | 1039 | 16.20 | 15.45 | 15.23 | 0.96 | m | MOW65 |
| 10:08:24.7 | 12:23:23 | 4012 | 16.35 | 15.61 | 15.25 | 1.10 | ||
| 10:08:24.8 | 12:19:27 | 1033 | 15.71 | 14.92 | 14.58 | 1.14 | ALW7 | |
| 10:08:27.6 | 12:17:32 | 1059 | 16.41 | 15.69 | 15.40 | 1.01 | m | MOW13,ALW10 |
| 10:08:27.8 | 12:17:55 | 1062 | 16.59 | 15.81 | 15.62 | 0.97 | m | MOW6 |
| 10:08:28.2 | 12:23:30 | 4006 | 16.34 | 15.51 | 15.26 | 1.08 | ||
| 10:08:28.3 | 12:20:29 | 1097 | 16.98 | 16.25 | 16.05 | 0.93 | ||
| 10:08:28.4 | 12:18:49 | 1075 | 16.76 | 16.05 | 15.91 | 0.84 | m | MOW4 |
| 10:08:28.7 | 12:16:25 | 1018 | 16.47 | 15.70 | 15.50 | 0.97 | m | MOW57 |
| 10:08:29.2 | 12:18:32 | 1026 | 16.14 | 15.39 | 15.18 | 0.96 | m | MOW5 |
| 10:08:29.5 | 12:20:43 | 1099 | 16.33 | 15.62 | 15.31 | 1.02 | ALW13 | |
| 10:08:30.0 | 12:16:04 | 1130 | 17.04 | 16.27 | 16.07 | 0.96 | m | MOW85 |
| 10:08:31.0 | 12:17:08 | 1020 | 15.67 | 14.91 | 14.64 | 1.03 | ALW14 | |
| 10:08:31.3 | 12:22:48 | 4011 | 16.39 | 15.68 | 15.45 | 0.95 | ||
| 10:08:31.5 | 12:18:54 | 1079 | 16.64 | 15.91 | 15.76 | 0.88 | m | MOW25 |
| 10:08:32.5 | 12:18:06 | 1066 | 16.59 | 15.85 | 15.69 | 0.89 | m | MOW30 |
| 10:08:33.6 | 12:15:33 | 1048 | 16.64 | 15.93 | 15.72 | 0.92 | ||
| 10:08:33.6 | 12:15:41 | 1049 | 16.39 | 15.63 | 15.43 | 0.97 | m | MOW113 |
| 10:08:33.6 | 12:20:11 | 1094 | 16.53 | 15.75 | 15.57 | 0.96 | ||
| 10:08:34.4 | 12:15:56 | 1052 | 16.47 | 15.72 | 15.54 | 0.93 | m | MOW107 |
| 10:08:34.9 | 12:19:39 | 1089 | 16.58 | 15.84 | 15.68 | 0.90 | m | MOW66 |
| 10:08:34.9 | 12:21:03 | 1041 | 15.97 | 15.24 | 14.91 | 1.06 | m | MOW109,ALW16 |
| 10:08:35.2 | 12:17:24 | 1021 | 16.22 | 15.48 | 15.23 | 0.99 | m | MOW68,ALW18 |
| 10:08:36.9 | 12:20:11 | 1095 | 16.42 | 15.65 | 15.46 | 0.96 | m | MOW96 |
| 10:08:37.1 | 12:19:24 | 1085 | 16.60 | 15.85 | 15.67 | 0.93 | m | MOW89 |
| 10:08:38.0 | 12:15:52 | 1051 | 16.87 | 16.15 | 15.97 | 0.90 | m | MOW145 |
| 10:08:38.3 | 12:15:45 | 1050 | 16.58 | 15.82 | 15.65 | 0.93 | m | MOW157 |
| 10:08:39.0 | 12:18:32 | 1073 | 16.47 | 15.65 | 15.46 | 1.00 | ||
| 10:08:41.8 | 12:20:47 | 1040 | 16.07 | 15.29 | 15.15 | 0.92 | ||
| 10:08:42.1 | 12:19:32 | 1087 | 16.80 | 16.08 | 15.93 | 0.87 | m | MOW153 |
| 10:08:42.8 | 12:23:45 | 3020 | 16.97 | 16.18 | 15.95 | 1.02 | m | MOW289 |
| 10:08:44.2 | 12:23:46 | 3017 | 15.76 | 15.05 | 14.87 | 0.89 | ||
| 10:08:44.5 | 12:17:23 | 2027 | 16.74 | 15.97 | 15.79 | 0.95 | m | MOW179 |
| 10:08:45.3 | 12:16:32 | 2016 | 16.03 | 15.26 | 15.09 | 0.94 | ||
| 10:08:46.0 | 12:22:33 | 3034 | 17.02 | 16.22 | 16.05 | 0.97 | m | MOW279 |
| 10:08:48.3 | 12:19:42 | 2035 | 16.82 | 16.08 | 15.89 | 0.93 | m | MOW236 |
| 10:08:55.5 | 12:14:01 | 9047 | 16.94 | 16.20 | 16.06 | 0.88 | m | MOW324 |
| Notes: the “other names” starting with MOW come from Mateo et al. (2008), and with ALW | ||||||||
| from Azzopardi et al. (1986). An “m” in the Memb column indicates a radial velocity member | ||||||||
| according to Mateo et al. The carbon star, ALW7, is incorrectly identified by Demers & Battinelli | ||||||||
| (2002) with their star 10. | ||||||||
The chemical evolution of Leo I has been discussed by many authors, most recently by Gullieuszik et al. (2009), who use the calcium triplet to find a very narrow distribution peaking at . Very little is known about the abundances of the -elements, but Shetrone et al. (2003) suggest that the ratio of - to iron-peak elements is lower in dwarf spheroidals, including Leo I, than in globular clusters. If the element enrichment pattern in Leo I has been comparable to that in Fornax (Letarte 2007) then -poor stars as old as 10 Gyr may be present, although those with ages comparable to the globular clusters will be -rich.
Estimates for the interstellar extinction towards Leo I are low, and range from mag (Bellazzini et al. 2004) to mag (Held et al. 2001). Here we use a value of mag, which amounts to mag and therefore has a negligible effect on anything deduced from the infrared photometry discussed here.
2 Observations
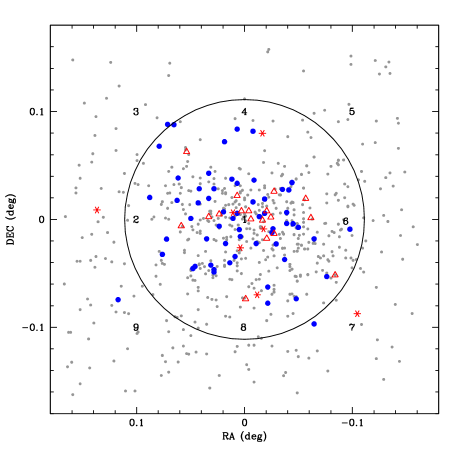
Observations were made with the SIRIUS camera on the Japanese-South African Infrared Survey Facility (IRSF) at SAAO, Sutherland. The camera produces simultaneous , and images covering an approximately arcmin square field (after dithering) with a scale of 0.45 arcsec/pixel. Initially, only two adjacent fields, one centred on the galaxy and one to the east, were observed (see Paper 1). When it was realised that there was a very red variable in the eastern field, the coverage was extended to a grid. With generous overlaps between adjacent fields, the area observed was 19.719.2 arcmin squared (see Fig. 1).
Images were obtained at about 18 epochs spread over 3 years in fields 1 and 2, and between 10 and 15 epochs over about 2 years in the remaining seven fields. In each field, 10 dithered images were combined after flat-fielding and dark and sky subtraction. Typical exposures were of either 30 or 20 s for each image, depending on the seeing and on the brightness of the sky in the band. Photometry was performed using DoPHOT (Schechter et al. 1993) in ‘fixed-position’ mode, using the best-seeing -band image in each field as templates. Aladin was used to correct the coordinate system on each template and RA and Dec were determined for each measured star. This allowed a cross-correlation to be made with the 2MASS catalogue (Cutri et al. 2003), and photometric zero points were determined by comparison of our photometry with that of 2MASS. In each field, stars in common with the 2MASS catalogue with photometric quality A in each colour were identified and the IRSF zero point was adjusted to match that of 2MASS. The number of common stars per field varies from 28 in the middle field to 6 in field 4 while field 5 has only 2 stars, in common with 2MASS. The mean standard deviation over all fields of the differences between IRSF and 2MASS are 0.04 mag in and 0.06 mag in each of and . No account was taken of possible colour transformations, such as in Kato et al. (2007). Those transformations were derived using highly reddened objects to define the red end and it is not obvious that the same transformations will apply to carbon stars.
3 Colour-Magnitude and Colour-Colour Diagrams
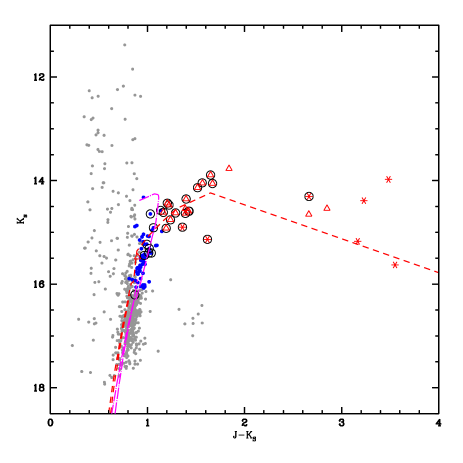
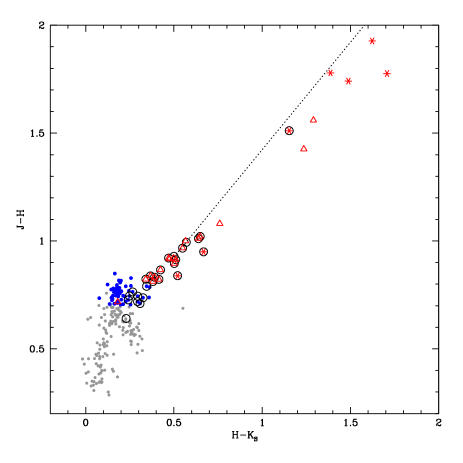
Fig. 2 shows the diagram and Fig. 3 the diagram for all variables, which will be discussed in section 4.2, and for constant stars selected on the basis of their standard deviations: for stars with , or mag, standard deviations mag; at the faint end the limit rises to 0.2 at , and 0.25 at . Mean magnitudes from all of our observations are used in all of these plots.
The clump of points around and are most likely unresolved background galaxies (see Whitelock et al. 2009).
To illustrate the possible evolutionary state of the stars plotted, we have included two isochrones from Marigo et al. (2008) assuming a distance modulus of 21.80 and a visual extinction of AV=0.12. The first is for a 10 Gyr population with metallicity Z=0.001. This has a blue-ward hook at the brightest magnitude which takes it into the region of the brightest blue stars we have selected as AGB stars (); the tip of its red giant branch (TRGB) is at mag. The other isochrone is for an age of 2 Gyr and Z=0.0012; its TRGB is at mag. This extends into the region occupied by the red variables, but is very uncertain beyond . The metallicity was chosen on the basis of the recent result of Gullieuszik et al. (2009) showing a mean [M/H]=–1.2 (equivalent to Z=0.0012) and very little dispersion. We have not included the isochrones on the colour-colour diagram (Fig. 3) since, as we found for Fornax (Whitelock et al. 2008), there is very little correlation between the isochrones and the data points.
4 Asymptotic Giant Branch
We assume that stars with mag and are AGB stars in Leo I; mag is the TRGB (Held et al. 2010) and objects with will be foreground dwarfs. In this way we make a conservative selection and can be reasonably certain that all stars selected will be AGB stars in Leo I, even if the selection also results in a few AGB stars being omitted.
From this selection we eliminated one star shown by Mateo et al. (2008) to be a radial velocity non-member. The data for the AGB stars are listed in Table 1, where the column headed refers to our internal star numbers, and the stars in common are noted by the Mateo et al. internal numbers prefixed by MOW. Mateo et al. assigned stars to the AGB or RGB based on the colour-magnitude diagram. We find two of their AGB stars fall on our RGB, both on the blue side of the RGB in our colour-magnitude diagram. A further five stars that they call RGB stars are above our dividing line, four being on the extreme red side of our AGB. There may be some physical reason for these discrepancies rather than photometric error, but this is not really relevant to the subject matter of the present paper.
| L# | P | Sp | 2MASS | other names | ||||||||
| (day) | ———————————— (mag) ————————————– | |||||||||||
| Miras | ||||||||||||
| 1019 | 158 | 16.75 | 1.21 | 15.80 | 0.89 | 15.14 | 0.62 | 1.61 | 18.58 | C | 10082751+1216539 | ALW9 |
| 8026 | 180 | 16.30 | 0.78 | 15.40 | 0.61 | 14.91 | 0.41 | 1.39 | 18.23 | C | 10082387+1214165 | ALW4 |
| 7020 | 191 | 18.34 | 1.87 | 16.56 | 1.57 | 15.17 | 1.24 | 3.17 | 18.20 | 10080111+1213144 | ||
| 4005 | 252 | 16.97 | 0.55 | 15.46 | 0.53 | 14.31 | 0.48 | 2.66 | 17.62 | C | 10082268+1223159 | C13 |
| 2077 | 283 | 19.18 | 1.87 | 17.25 | 1.23 | 15.63 | 1.17 | 3.53 | 18.33 | E | ||
| 1077 | 336 | 17.62 | 1.23 | 15.88 | 1.01 | 14.39 | 0.81 | 3.23 | 17.32 | 10082927+1218516 | A | |
| 1064 | 523 | 17.46 | 1.52 | 15.68 | 1.29 | 13.98 | 1.03 | 3.48 | 16.63 | 10082225+1217571 | C | |
| SRs | ||||||||||||
| 6015 | 141 | 16.38 | 0.29 | 15.66 | 0.34 | 15.48 | 0.26 | 0.90 | 10080593+1215228 | MOW273 | ||
| 1031 | 216 | 16.01 | 0.29 | 15.09 | 0.19 | 14.59 | 0.21 | 1.42 | 17.92 | C | 10082561+1218571 | C10 |
| 1043 | 222 | 16.02 | 0.40 | 15.10 | 0.25 | 14.63 | 0.19 | 1.39 | 17.94 | C | 10083988+1222144 | C08 |
| 1037 | 316 | 15.73 | 0.60 | 14.70 | 0.35 | 14.06 | 0.21 | 1.67 | 17.50 | C | 10082008+1220023 | C02 |
| 1067 | 999 | 17.31 | 0.43 | 15.89 | 0.31 | 14.65 | 0.29 | 2.66 | 17.92 | 10084120+1218068 | D, MOW128 | |
| L# | Sp | 2MASS | other names | ||||||||
|---|---|---|---|---|---|---|---|---|---|---|---|
| ——————————— (mag) ——————————— | |||||||||||
| 1080 | 17.39 | 2.3 | 15.83 | 1.1 | 14.54 | 0.9 | 2.85 | 17.73 | 10082730+1218571 | B | |
| 1012 | 15.54 | 0.3 | 14.53 | 0.3 | 13.89 | 0.3 | 1.65 | 17.33 | C | 10082064+1218364 | C03 |
| 1013 | 15.65 | 0.4 | 14.69 | 0.2 | 14.14 | 0.3 | 1.52 | 17.52 | C | 10083233+1218460 | C07 |
| 1014 | 15.61 | 0.4 | 14.53 | 0.3 | 13.77 | 0.3 | 1.84 | 17.25 | 10082170+1218575 | ||
| 1025 | 15.75 | 0.2 | 14.86 | 0.2 | 14.36 | 0.2 | 1.40 | 17.68 | C | 10082528+1218301 | ALW8,C06 |
| 1035 | 16.02 | 0.6 | 15.10 | 0.4 | 14.59 | 0.3 | 1.42 | 17.93 | C | 10081288+1219379 | C11 |
| 6006 | 15.61 | 0.2 | 14.61 | 0.1 | 14.04 | 0.1 | 1.56 | 17.44 | C | 10081170+1218334 | C04 |
| 1022 | 15.91 | 0.3 | 15.05 | 0.2 | 14.62 | 0.2 | 1.29 | C | 10082175+1217249 | ALW3,C09 | |
| 8024 | 16.12 | 0.3 | 15.30 | 0.2 | 14.92 | 0.2 | 1.19 | C | 10082634+1214026 | ALW6 | |
| 6012 | 15.93 | 0.3 | 15.02 | 0.2 | 14.54 | 0.2 | 1.39 | 17.85 | 10081288+1219379 | ||
| 1036 | 16.00 | 0.3 | 15.17 | 0.2 | 14.76 | 0.2 | 1.24 | C | 10082849+1218485 | ALW11,C12 | |
| 1011 | 15.69 | 0.2 | 14.86 | 0.1 | 14.47 | 0.1 | 1.22 | C | 10082254+1218259 | ALW5,C05 | |
| 1023 | 15.64 | 0.3 | 14.80 | 0.2 | 14.44 | 0.2 | 1.20 | C | 10081995+1217414 | ALW2,C01 | |
| 1028 | 15.78 | 0.3 | 14.96 | 0.2 | 14.61 | 0.2 | 1.16 | C | 10083471+1218374 | ALW15 | |
4.1 Carbon stars
Azzopardi, Lequeux & Westerlund (1986) and Demers & Battinelli (2002) identified 26 carbon stars in Leo I and all of these appear in our sample; they are identified in Figs. 2, 3 and in the tables. With one exception the carbon stars are all brighter than (). In the 2 Gyr isochrone, illustrated in Fig. 2, stars brighter than are carbon rich, while the 10 Gyr model does not produce C-stars at all.
The faintest carbon star, ALW12 ( mag), is referred to as a ‘probable carbon star’ by Azzopardi et al. (1986); its status therefore remains uncertain. If it really is carbon rich it is too faint for this enrichment to be the result of third dredge-up; it could, however, be an extrinsic carbon star (i.e. one which received its enrichment by mass transfer from a companion).
Given the low metallicity and, more importantly, the probable low oxygen abundance (Shetrone et al. 2003) of Leo I we would anticipate that all of the intermediate-age AGB variable stars will be carbon-rich. It is less obvious what we should expect for very old AGB variables, but we do not expect to see high mass-loss, i.e. very red, stars that are oxygen-rich in this environment (Lagadec & Zijlstra 2008).
The Miras L7020 and L2077 are outside the regions surveyed for carbon stars. The other three periodic variables that have no carbon star identification have (L6015 is different and is discussed in the next section); presumably all these stars are extremely faint at short wavelengths.
Held et al. (2010) do a detailed division of AGB stars into presumed oxygen- and carbon-rich on the basis of their colours and compare carbon star numbers to theoretical predictions.
4.2 Variable stars
We examined all of the bright red stars () with significant standard deviations ( mag) for periodic variations. (Although it is bluer than this limit, L6015, with , is relatively bright and was recognised as a variable when its photometry was noticed to have much larger standard deviations in all wavebands than stars of similar brightness.)
Table 2 lists the Fourier mean magnitudes for the periodic variables, the peak-to-peak amplitudes (), mean , and apparent bolometric magnitude, ; a C indicates it is a known carbon star, while 2MASS and other identifications are also given.
Following Whitelock et al. (2006) we call variables with mag Miras, and lower amplitude variables semi-regulars (SRs). Figs. 4 and 5 illustrate the light curves of the Mira and SR variables, respectively, phased at their best-fitting periods. Note that the periods of the Miras are, in general, much more secure than those of the SR variables.
With the exception of L4005 the Miras are all definite Miras. L4005 is included with the group because of its large amplitude, but its light curve is not well defined so its status as a Mira is uncertain. L8026 is almost certainly a Mira variable, but its light curve is not well defined as only 8 observations (7 ) were available to define its period and mean magnitude and they do not cover maximum light. L2077 is clearly a Mira, but also has a long-term trend, it is discussed in Section 4.3.
Stars which are clearly variable, but for which we have been unable to establish a period, are listed in Table 3 together with the full range of their variations: . Some of these will be irregular variables, others are SRs, but require more observations to define their periods.
The variables are identified on the colour-magnitude (Fig. 2) and (Fig. 3) diagrams. The reddest stars (those with ) are all variable. It is generally understood that AGB stars move to the right and down in Fig. 2 and to the upper right in Fig. 3 as their mass-loss increases and their shells become optically thick at .
The SR variable L6015, at is significantly less red than any of the other variables, which indicates that it has a very low mass-loss rate. Nevertheless, the period established here puts it on the same PL() relation (see section 4.4) as the Miras and suggests that it is pulsating in the fundamental mode (Wood 2000). This star is a radial velocity member of Leo I according to Mateo et al. (2008).


4.3 Long term trends
Whitelock et al. (2006) established that among Galactic carbon-variables about one third of Miras showed obscuration events, as did an unknown fraction of non-Mira variables. An obscuration event is generally associated with the ejection of a puff of dust into our line of sight, and the phenomenon is particularly well illustrated by the light-curve of II Lup (Feast et al. 2003) which covers a time span of 18 years. The ejection of puffs of dust in random directions is well studied among the hydrogen-deficient R CrB (RCB) stars.
Fig. 6 illustrates two of the Leo I variables that show obvious long-term trends. L1080 is clearly variable, but not periodic. Its light-curve is reminiscent of that of an RCB star, in that it shows SR-type variability before going into a deep minimum. Its colours are very red for a non-Mira and in the colour-magnitude diagram (Fig. 2) it is found among the extreme AGB stars with .
L2077 is a Mira with a clear period of 280 days, but its mean magnitude also brightened by over 0.5 mag at (by about 1.0 mag at and 0.5 mag at ) during the 3 years we monitored it. It is rather faint for its period as is discussed in section 4.5.
Most of the observations by Held et al. (2010) for the variables are completely consistent with the values in Tables 2 and 3, the one exception being the SR variable L1037 (21484 in their table 5), which we both identify with C02 from Demers & Battinelli (2002). They find , which is much redder than the values in Table 2 and the 2MASS observation and, as well, is outside of the range illustrated in Fig. 5. The Held et al. observations were made almost a year after ours and may indicate the ejection of a dust shell.
Whitelock et al. (2009) identified several variables in Fornax that seemed to show examples of dust shell ejecta.
4.4 Distribution of AGB stars and variables
In Fig 1 we show where the AGB stars and variables lie with respect to the centre of Leo I. As found by Mateo et al. (2008), we see that most of the AGB stars lie within a circle of radius 400 arcsec and are less widely distributed than the RGB stars. Mateo et al. convincingly demonstrate that the extended AGB cannot be from the same population as the bulk of the GB stars.
It is perhaps surprising that two of the Mira variables, L2077 and L7020, lie well outside the 400 arcsec circle (they are 490.4 and 493.4 arcsec from the centre, respectively). There are only three probable AGB stars lying outside the circle, one of them being a confirmed radial velocity member. It is possible that these two Miras, which have relatively short periods, and, by analogy, the other three with short periods, are old stars and not from the same population as the main extended AGB. This is discussed further in section 6.
4.5 Bolometric magnitudes and the period-luminosity (PL) relation
In calculating the bolometric magnitudes of the variables we assume mag, but note that the difference in distance modulus derived from this assumption and mag is less than 0.01 mag.
Fig. 7 shows the PL() relation for the periodic variables in Leo I compared to the relation for C-rich Miras in the LMC:
| (1) |
from Whitelock, Feast & van Leeuwen (2008) on the assumption that the distance modulus of Leo I is 21.80 (see below). Five of the Miras fall close to the relation and the other two considerably below it. As these stars are red compared to the LMC objects used to define the PL relation, this is hardly surprising and we would anticipate that they are affected by circumstellar extinction at .
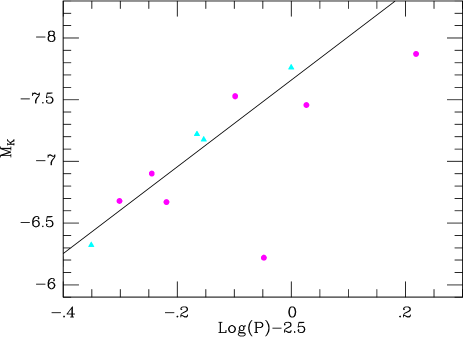
Apparent bolometric magnitudes were calculated from colour dependent bolometric corrections, as was done in our previous work on Fornax (Whitelock et al. 2009). To determine the distance to Leo I we fit the following equation to the Mira observations:
| (2) |
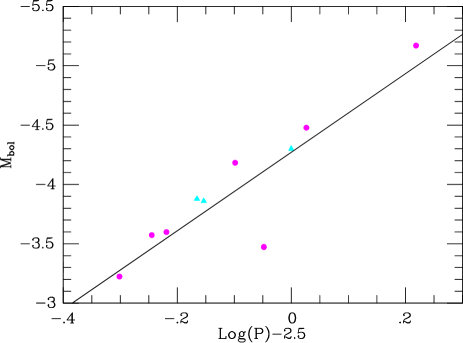
(This is A1 from Whitelock et al. (2009), and assumes an LMC modulus of 18.39.) Using all 7 Miras we obtain mag (internal error only). Eliminating L4005 (which has an uncertain status as a Mira) and using the other 6 stars gives mag. Eliminating L2077 (which was undergoing an obscuration event when we observed it, see section 4.3) and using the other 6 stars gives mag. Fig. 8 shows the PL relation with all the variables and the relation just derived for all 7 Miras.
Note that the SR variable L6015 does not appear in Fig. 8; we cannot use the same method to estimate its bolometric magnitude because the bolometric corrections are not defined for stars with (on the SAAO system).
Table 3 includes estimates of the bolometric magnitudes for the variables without periods where their colours allow it to be estimated, but these should be used with caution as we do not know that these variables are comparable to those for which the bolometric correction was established.
To establish the complete (external plus internal) error on the distance modulus we must include the uncertainty of the adopted distance modulus for the LMC, (van Leeuwen et al.2007, derived from Cepheid variables). Taking this into account the distance modulus of Leo I from all seven Miras is, .
Omitting L2077, on the assumption that its apparent low luminosity results from obscuration by a non-uniform shell, results in a modulus of . However, in view of the selection process involved, we have increased the error in this case by adding in quadrature the, primarily intrinsic, rms scatter per star. Whitelock et al. (2008) found the scatter for LMC Miras about the PL to be mag, so we estimate the rms scatter per star for the 6 stars here as . This increases the standard error from 0.06 to 0.08.
5 The Distance to Leo I
Here we compare the distance obtained above with independent estimates from the literature using RR Lyrae variables (RRs) and the tip of the red giant branch. These are expressed in a self consistent way, assuming the interstellar reddening amounts to mag (which affects estimates based on shorter wavelength measurements although its impact on our infrared measures is minimal). The results are given in Table 4.
Held et al. (2001) discuss and photometry for RRs they discovered in Leo I. Assuming mag for the galaxy, they find a mean value for the RRs of . We assume the following expression for the absolute magnitude of the RRs (Feast 2010):
| (3) |
which was derived from a mean of the trigonometrical, pulsation and statistical parallaxes. Held et al. adopted , giving . Hence (standard error from Held et al.). Equation 3, with the mean [Fe/H] value for the LMC from Gratton et al. (2004), gives a distance modulus for the LMC of 18.38 mag. Thus, on a scale of for the LMC, the RRs give for Leo I.
However, Gullieuszik et al. (2009) recently determined the metallicity of Leo I as , with a very narrow intrinsic dispersion of only . Converting this to [Fe/H] depends on the metallicity scale and is rather uncertain, but using the globular cluster comparison made by Gullieuszik et al., we would estimate this corresponds to . Following the same argument as above this leads to for the RRs and mag for the distance modulus.
| method | reference | |
|---|---|---|
| (mag) | ||
| RRs | Held et al. (2001) revised | |
| see text | ||
| TRGB() | Bellazzini (2004) revised | |
| TRGB() | Held et al. (2010) revised | |
| Miras | this paper |
Bellazzini et al. (2004) discuss the distance to Leo I from the TRGB, using an independent calibration of based on adopted distances of Cen and 47 Tuc. They find . Assuming mag and they obtain . With our adopted value of mag, this becomes . Held et al. (2010) derive a modulus of from the TRGB at after applying population corrections. As in the case of Fornax discussed by Whitelock et al. (2009) their basic scale is 0.16 mag longer than that adopted here. Thus on a scale consistent with the other results in Table 4 the infrared TRGB distance is 21.88. Note, however, Salaris & Girardi (2005) have urged caution in using the TRGB as a distance indicator in the presence of a significant intermediate mass population — a situation that obviously applies to Leo I.
Each method of distance determination has its own uncertainties, and although touched upon here the details of these are beyond the scope of this paper. Within those uncertainties the various distance estimates to Leo I agree remarkably well and the Miras provide a useful estimate of the distance, independent of the more commonly used methods. If the metallicity of the C-Miras in Leo I is lower than that in the LMC (which seems likely) this result indicates that there are no large metallicity effects in the Mira PL relation.
6 Discussion
Our most direct information about the ages and masses of carbon Miras comes from those discovered in Magellanic Cloud clusters by Nishida et al. (2000). These have periods of between 450 and 526 days and follow the same bolometric PL relation as the carbon-rich field Miras (Whitelock et al. 2003). The clusters in which they are found have ages of about 1.6 Gyr (Mucciarelli et al. 2007a; Mucciarelli, Origlia & Ferraro 2007b; Glatt et al. 2008) and we would therefore suggest that the longest period Mira in Leo I, L1064 with P=523 days, is of similar age.
The other Miras must be older; how much older is difficult to quantify. In view of the fact that two of the stars with days are found in the outer part of Leo I (section 4.4) it is tempting to suggest that they may be much older, possibly comparable to the 10 Gyr or more that is thought to be characteristic of the RGB stars. Note that in the Galaxy oxygen-rich Miras with days are found in relatively metal-rich () globular clusters, which have ages greater than 10 Gyr. Within these clusters, their periods and therefore of course their magnitudes are proportional to the metallicity of the parent cluster (Feast, Whitelock & Menzies 2002). Miras are not found in the more metal-deficient clusters.
Although we have yet to confirm spectroscopically that these two Miras are carbon-rich, their colours certainly suggest it. Most models do not produce carbon stars or high-mass-loss objects at ages of 10 Gyr, although recent work suggests it might happen. Karakas (2010) modelled a star with Z=0.0001 and found that it experienced 26 thermal pulses and a small amount of third-dredge-up. In an envelope with such a low metallicity, even a small amount of dredge-up was enough to make and produce a carbon star. This is clearly an area where more work is needed and these stars are worth a more detailed investigation.
For the future, with the next generation of large telescopes working in the infrared, Mira variables will prove vital distance indicators for studying populations of old and intermediate age stars, where they will be amongst the most luminous objects, easily identified via their large amplitude variations.
Acknowledgments
We are grateful to the following colleagues for acquiring images for this programme: Toshihiko Tanabé, Takahiro Naoi, Shogo Nishiyama, Yoshifusa Ita and Barbara Cunow.
This research has made use of Aladin. This publication makes use of data products from the Two Micron All Sky Survey, which is a joint project of the University of Massachusetts and the Infrared Processing and Analysis Center/California Institute of Technology, funded by the National Aeronautics and Space Administration and the National Science Foundation. This material is based upon work supported financially by the South African National Research Foundation. We also thank Enrico Held for sending us his 2010 paper in advance of publication.
References
- [] Azzopardi M., Lequeux J., Westerlund B. E., 1986, A&A, 161 232
- [] Bellazzini M., Gennari N., Ferraro, F. R., Sollima A., 2004, MNRAS, 354, 708
- [] Cutri R. M., et al., 2003, University of Massachusetts and Infrared Processing and Analysis Center (IPAC/California Institute of Technology), 2MASS
- [] Dolphin A. E., 2002, MNRAS, 332, 91
- [] Demers S., Battinelli P., 2002, AJ, 123, 238
- [] Feast M. W., 2010, in: (eds.) C. Sterken, N. Samus and L. Szabados, “Variable stars, the Galactic halo and galaxy formation”, in press, 2009arXiv0912.4159
- [] Feast M. W., Whitelock P. A., Menzies J. W., MNRAS, 2002, 329, L7
- [] Feast M. W., Whitelock P. A., Marang F., MNRAS, 2003, 346, 878
- [] Gallart C., Freedman W. L., Aparicio A., Bertelli, G., Chiosi C., 1999, AJ, 118, 2245
- [] Glatt K. et al., 2008, AJ, 136, 1703
- [] Gratton R. G., Bragaglia A., Clementini G., Carretta E., Di Fabrizio L., Maio M., Taribello E., 2004, A&A, 421, 937
- [] Gullieuszik M., Held E. V., Saviane I., Rizzi L., 2009, A&A, 500, 735
- [] Held E. V., Clementini G., Rizzi L., Momany Y., 2001, ApJ, 562, L39
- [] Held E. V., Gullieuszik M., Rizzi L., Girardi L., Marigo P., Saviane I., 2010, MNRAS in press
- [] Hernandez X., Gilmore G., Valls-Gabaud D., 2000, MNRAS, 317, 831
- [] Karakas A. I., 2010, MNRAS, in press, arXiv:0912.2142
- [] Kato D., et al., 2007, PASJ, 59, 615
- [] Koch A., Wilkinson M. I., Kleyna J. T., Gilmore G. F., Grebel E. K., Mackey A. D., Evans N. W., Wyse R. F. G., 2007, ApJ, 657, 241
- [] Lagadec E., Zijlstra A. A., 2008, MNRAS, 390, L59
- [] Letarte B., 2007, Thesis, University of Groningen
- [] Marigo P., Girardi L., Bressan A., Groenewegen M. A. T., Silva L., Granato G. L., 2008, A&A, 482, 883
- [] Mateo M., Olszewski E. W., Walker M. G., 2008, ApJ, 675, 201
- [] Menzies J., Feast M., Tanabé T., Whitelock P., Nakada Y., 2002, MNRAS, 335, 923 (Paper I)
- [] Menzies J., Feast M., Whitelock P., Olivier E., Matsunaga N., da Costa G., 2008, MNRAS, 385, 1045
- [] Mucciarelli A., Ferraro F. R., Origlia L., Fusi Pecci F., 2007a, AJ, 133, 2053
- [] Mucciarelli A., Origlia L., Ferraro F. R., 2007b, AJ, 134, 1813
- [] Nishida S., Tanabé T., Nakada Y., Matsumoto S., Sekiguchi K., Glass I.S., 2003, MNRAS, 313, 136
- [] Salaris M., Girardi L., 2005, MNRAS, 357 669
- [] Schechter P. L., Mateo M., Saha A., 1993, PASP, 105, 1342
- [] Shetrone M., Venn K. A., Tolstoy E., Primas F., Hill V., Kaufer A., 2003, AJ, 125, 684
- [] van Leeuwen F., Feast M. W., Whitelock P. A., Laney C. D., 2007, MNRAS, 379, 723
- [] Whitelock P. A., Feast M. W., van Loon J. Th., Zijlstra A. A., 2003, MNRAS, 342, 86
- [] Whitelock P. A., Feast M. W., Marang F., Groenewegen M. A. T., 2006 MNRAS 369, 751
- [] Whitelock P. A., Feast M. W., van Leeuwen F., 2008, MNRAS, 386, 313
- [] Whitelock P. A., Menzies J. W., Feast M. W., Matsunaga N., Tanabé T., Ita Y., 2009, MNRAS, 394, 795
- [] Wood P., 2000, Publ. Astron. Soc. Aust., 17, 18